Zip Codes with the Highest Percentage of Not-for-profit Organizations in Indiana
RELATED REPORTS & OPTIONS
Not-for-profit Organizations
Indiana
Compare Zip Codes
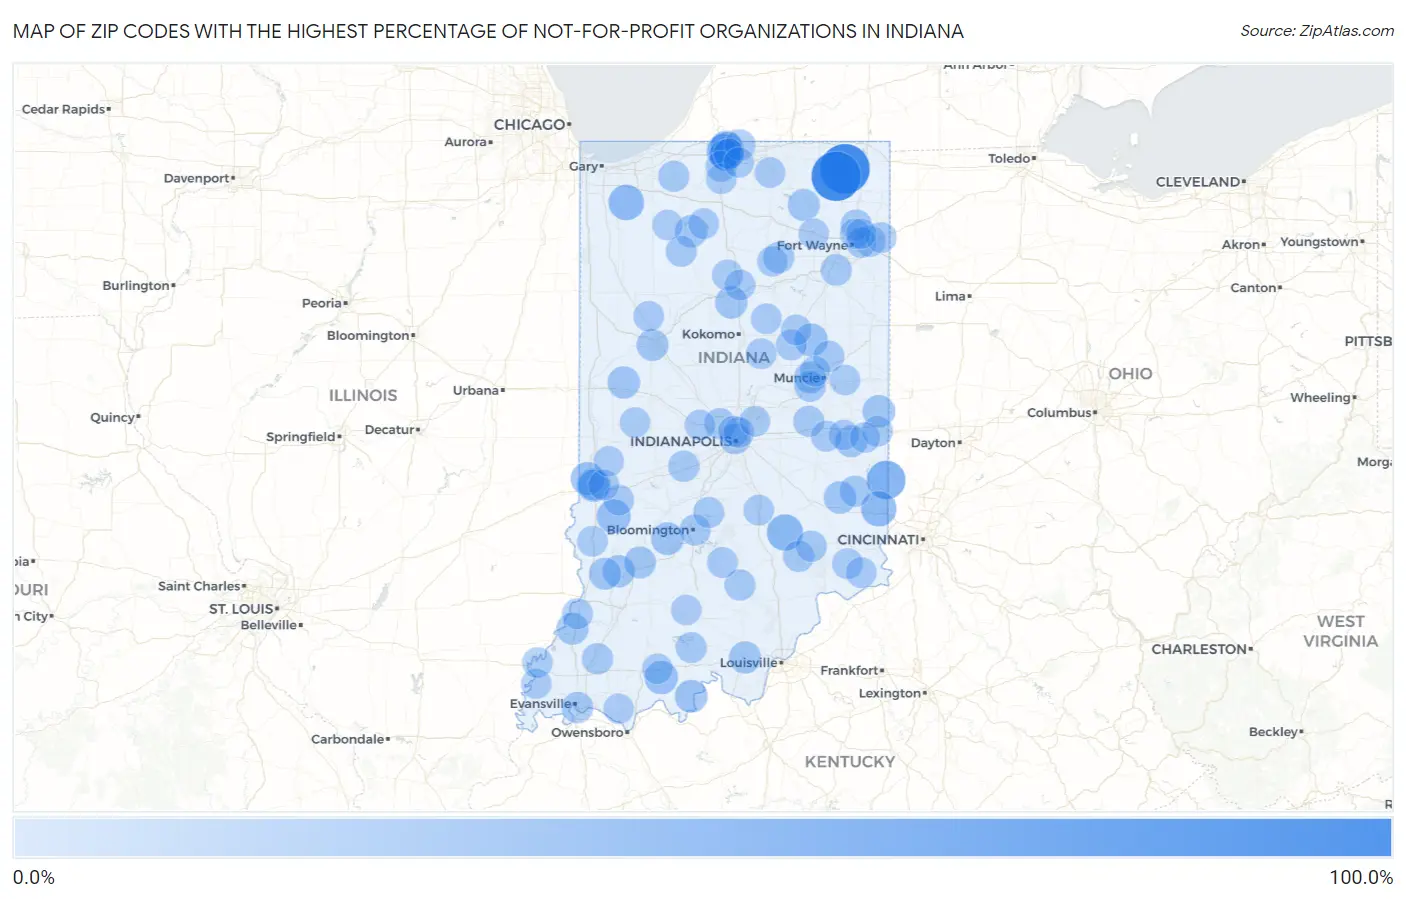
Map of Zip Codes with the Highest Percentage of Not-for-profit Organizations in Indiana
0.0%
100.0%
Zip Codes with the Highest Percentage of Not-for-profit Organizations in Indiana
| Zip Code | % Employed in Not-for-profit | vs State | vs National | |
| 1. | 46789 | 100.0% | 9.8%(+90.2)#1 | 8.4%(+91.6)#4 |
| 2. | 46786 | 100.0% | 9.8%(+90.2)#2 | 8.4%(+91.6)#25 |
| 3. | 47010 | 50.0% | 9.8%(+40.2)#3 | 8.4%(+41.6)#133 |
| 4. | 47236 | 39.2% | 9.8%(+29.4)#4 | 8.4%(+30.8)#246 |
| 5. | 46556 | 36.3% | 9.8%(+26.5)#5 | 8.4%(+27.8)#299 |
| 6. | 46302 | 35.7% | 9.8%(+25.9)#6 | 8.4%(+27.3)#310 |
| 7. | 47035 | 35.2% | 9.8%(+25.5)#7 | 8.4%(+26.8)#322 |
| 8. | 46616 | 30.1% | 9.8%(+20.3)#8 | 8.4%(+21.7)#441 |
| 9. | 47858 | 29.2% | 9.8%(+19.5)#9 | 8.4%(+20.8)#473 |
| 10. | 46617 | 28.6% | 9.8%(+18.9)#10 | 8.4%(+20.2)#492 |
| 11. | 47809 | 28.4% | 9.8%(+18.6)#11 | 8.4%(+19.9)#503 |
| 12. | 47577 | 27.0% | 9.8%(+17.2)#12 | 8.4%(+18.6)#575 |
| 13. | 47876 | 26.7% | 9.8%(+16.9)#13 | 8.4%(+18.2)#589 |
| 14. | 46989 | 25.7% | 9.8%(+15.9)#14 | 8.4%(+17.3)#647 |
| 15. | 47459 | 24.0% | 9.8%(+14.2)#15 | 8.4%(+15.6)#777 |
| 16. | 47525 | 23.7% | 9.8%(+13.9)#16 | 8.4%(+15.3)#813 |
| 17. | 47036 | 22.6% | 9.8%(+12.8)#17 | 8.4%(+14.1)#936 |
| 18. | 46968 | 22.5% | 9.8%(+12.7)#18 | 8.4%(+14.1)#950 |
| 19. | 47341 | 22.4% | 9.8%(+12.6)#19 | 8.4%(+14.0)#965 |
| 20. | 46967 | 22.1% | 9.8%(+12.3)#20 | 8.4%(+13.6)#1,002 |
| 21. | 47958 | 22.0% | 9.8%(+12.3)#21 | 8.4%(+13.6)#1,005 |
| 22. | 47578 | 21.1% | 9.8%(+11.4)#22 | 8.4%(+12.7)#1,129 |
| 23. | 47114 | 21.0% | 9.8%(+11.2)#23 | 8.4%(+12.6)#1,147 |
| 24. | 47524 | 20.7% | 9.8%(+10.9)#24 | 8.4%(+12.2)#1,200 |
| 25. | 47357 | 20.1% | 9.8%(+10.3)#25 | 8.4%(+11.7)#1,269 |
| 26. | 47901 | 20.0% | 9.8%(+10.2)#26 | 8.4%(+11.6)#1,284 |
| 27. | 47535 | 20.0% | 9.8%(+10.2)#27 | 8.4%(+11.6)#1,287 |
| 28. | 46760 | 19.7% | 9.8%(+9.93)#28 | 8.4%(+11.3)#1,342 |
| 29. | 47396 | 19.7% | 9.8%(+9.88)#29 | 8.4%(+11.2)#1,347 |
| 30. | 47449 | 19.6% | 9.8%(+9.86)#30 | 8.4%(+11.2)#1,356 |
| 31. | 47713 | 17.8% | 9.8%(+7.98)#31 | 8.4%(+9.32)#1,773 |
| 32. | 46180 | 17.6% | 9.8%(+7.82)#32 | 8.4%(+9.16)#1,831 |
| 33. | 46637 | 17.5% | 9.8%(+7.77)#33 | 8.4%(+9.11)#1,846 |
| 34. | 47282 | 17.2% | 9.8%(+7.41)#34 | 8.4%(+8.74)#1,963 |
| 35. | 47030 | 17.0% | 9.8%(+7.22)#35 | 8.4%(+8.56)#2,021 |
| 36. | 46774 | 17.0% | 9.8%(+7.21)#36 | 8.4%(+8.54)#2,022 |
| 37. | 46799 | 16.9% | 9.8%(+7.13)#37 | 8.4%(+8.46)#2,051 |
| 38. | 47334 | 16.8% | 9.8%(+7.06)#38 | 8.4%(+8.39)#2,081 |
| 39. | 46278 | 16.8% | 9.8%(+7.00)#39 | 8.4%(+8.34)#2,108 |
| 40. | 46962 | 16.7% | 9.8%(+6.97)#40 | 8.4%(+8.30)#2,126 |
| 41. | 46345 | 16.7% | 9.8%(+6.89)#41 | 8.4%(+8.22)#2,166 |
| 42. | 47683 | 16.7% | 9.8%(+6.89)#42 | 8.4%(+8.22)#2,169 |
| 43. | 47807 | 16.6% | 9.8%(+6.79)#43 | 8.4%(+8.12)#2,197 |
| 44. | 47223 | 16.6% | 9.8%(+6.79)#44 | 8.4%(+8.12)#2,198 |
| 45. | 47405 | 16.6% | 9.8%(+6.77)#45 | 8.4%(+8.11)#2,203 |
| 46. | 46845 | 16.4% | 9.8%(+6.65)#46 | 8.4%(+7.99)#2,264 |
| 47. | 47468 | 16.4% | 9.8%(+6.62)#47 | 8.4%(+7.96)#2,278 |
| 48. | 47281 | 16.3% | 9.8%(+6.54)#48 | 8.4%(+7.88)#2,312 |
| 49. | 46996 | 16.3% | 9.8%(+6.52)#49 | 8.4%(+7.86)#2,316 |
| 50. | 47175 | 16.2% | 9.8%(+6.42)#50 | 8.4%(+7.76)#2,354 |
| 51. | 47338 | 16.2% | 9.8%(+6.38)#51 | 8.4%(+7.72)#2,383 |
| 52. | 47351 | 16.1% | 9.8%(+6.28)#52 | 8.4%(+7.61)#2,427 |
| 53. | 46601 | 16.0% | 9.8%(+6.26)#53 | 8.4%(+7.59)#2,434 |
| 54. | 46614 | 16.0% | 9.8%(+6.21)#54 | 8.4%(+7.54)#2,451 |
| 55. | 46928 | 15.8% | 9.8%(+6.02)#55 | 8.4%(+7.36)#2,529 |
| 56. | 46988 | 15.8% | 9.8%(+5.98)#56 | 8.4%(+7.31)#2,557 |
| 57. | 46530 | 15.7% | 9.8%(+5.88)#57 | 8.4%(+7.21)#2,598 |
| 58. | 47591 | 15.5% | 9.8%(+5.67)#58 | 8.4%(+7.01)#2,702 |
| 59. | 47352 | 15.4% | 9.8%(+5.67)#59 | 8.4%(+7.00)#2,704 |
| 60. | 47017 | 15.4% | 9.8%(+5.67)#60 | 8.4%(+7.00)#2,705 |
| 61. | 46202 | 15.4% | 9.8%(+5.63)#61 | 8.4%(+6.97)#2,719 |
| 62. | 47264 | 15.4% | 9.8%(+5.57)#62 | 8.4%(+6.91)#2,752 |
| 63. | 46511 | 15.1% | 9.8%(+5.37)#63 | 8.4%(+6.70)#2,856 |
| 64. | 47846 | 15.0% | 9.8%(+5.25)#64 | 8.4%(+6.58)#2,928 |
| 65. | 47803 | 15.0% | 9.8%(+5.24)#65 | 8.4%(+6.58)#2,929 |
| 66. | 46076 | 14.9% | 9.8%(+5.16)#66 | 8.4%(+6.50)#2,975 |
| 67. | 47011 | 14.9% | 9.8%(+5.13)#67 | 8.4%(+6.46)#2,991 |
| 68. | 46958 | 14.8% | 9.8%(+5.03)#68 | 8.4%(+6.37)#3,046 |
| 69. | 46208 | 14.8% | 9.8%(+4.98)#69 | 8.4%(+6.31)#3,085 |
| 70. | 46953 | 14.6% | 9.8%(+4.87)#70 | 8.4%(+6.20)#3,148 |
| 71. | 46919 | 14.6% | 9.8%(+4.83)#71 | 8.4%(+6.16)#3,175 |
| 72. | 46205 | 14.5% | 9.8%(+4.74)#72 | 8.4%(+6.08)#3,218 |
| 73. | 47280 | 14.5% | 9.8%(+4.69)#73 | 8.4%(+6.02)#3,259 |
| 74. | 47374 | 14.5% | 9.8%(+4.68)#74 | 8.4%(+6.02)#3,262 |
| 75. | 46815 | 14.5% | 9.8%(+4.67)#75 | 8.4%(+6.01)#3,272 |
| 76. | 47882 | 14.4% | 9.8%(+4.65)#76 | 8.4%(+5.99)#3,287 |
| 77. | 46167 | 14.4% | 9.8%(+4.62)#77 | 8.4%(+5.96)#3,310 |
| 78. | 46797 | 14.4% | 9.8%(+4.59)#78 | 8.4%(+5.92)#3,333 |
| 79. | 46536 | 14.3% | 9.8%(+4.52)#79 | 8.4%(+5.86)#3,367 |
| 80. | 46526 | 14.3% | 9.8%(+4.52)#80 | 8.4%(+5.85)#3,369 |
| 81. | 46943 | 14.3% | 9.8%(+4.51)#81 | 8.4%(+5.84)#3,387 |
| 82. | 47923 | 14.2% | 9.8%(+4.40)#82 | 8.4%(+5.74)#3,447 |
| 83. | 46256 | 14.1% | 9.8%(+4.30)#83 | 8.4%(+5.63)#3,523 |
| 84. | 47304 | 14.0% | 9.8%(+4.27)#84 | 8.4%(+5.60)#3,552 |
| 85. | 46366 | 13.9% | 9.8%(+4.07)#85 | 8.4%(+5.41)#3,712 |
| 86. | 47368 | 13.8% | 9.8%(+4.06)#86 | 8.4%(+5.40)#3,721 |
| 87. | 47616 | 13.8% | 9.8%(+3.99)#87 | 8.4%(+5.32)#3,787 |
| 88. | 47631 | 13.7% | 9.8%(+3.97)#88 | 8.4%(+5.30)#3,807 |
| 89. | 46825 | 13.7% | 9.8%(+3.91)#89 | 8.4%(+5.25)#3,851 |
| 90. | 47989 | 13.7% | 9.8%(+3.88)#90 | 8.4%(+5.22)#3,875 |
| 91. | 46615 | 13.6% | 9.8%(+3.85)#91 | 8.4%(+5.19)#3,912 |
| 92. | 47469 | 13.6% | 9.8%(+3.77)#92 | 8.4%(+5.11)#3,964 |
| 93. | 47874 | 13.5% | 9.8%(+3.74)#93 | 8.4%(+5.08)#3,982 |
| 94. | 47335 | 13.5% | 9.8%(+3.74)#94 | 8.4%(+5.08)#3,987 |
| 95. | 46835 | 13.5% | 9.8%(+3.72)#95 | 8.4%(+5.06)#4,003 |
| 96. | 46725 | 13.5% | 9.8%(+3.71)#96 | 8.4%(+5.05)#4,018 |
| 97. | 47634 | 13.5% | 9.8%(+3.71)#97 | 8.4%(+5.04)#4,026 |
| 98. | 47532 | 13.5% | 9.8%(+3.68)#98 | 8.4%(+5.02)#4,046 |
| 99. | 47330 | 13.4% | 9.8%(+3.67)#99 | 8.4%(+5.00)#4,068 |
| 100. | 46544 | 13.3% | 9.8%(+3.53)#100 | 8.4%(+4.86)#4,221 |
Common Questions
What are the Top 10 Zip Codes with the Highest Percentage of Not-for-profit Organizations in Indiana?
Top 10 Zip Codes with the Highest Percentage of Not-for-profit Organizations in Indiana are:
What zip code has the Highest Percentage of Not-for-profit Organizations in Indiana?
46789 has the Highest Percentage of Not-for-profit Organizations in Indiana with 100.0%.
What is the Percentage of Not-for-profit Organizations in the State of Indiana?
Percentage of Not-for-profit Organizations in Indiana is 9.8%.
What is the Percentage of Not-for-profit Organizations in the United States?
Percentage of Not-for-profit Organizations in the United States is 8.4%.