Zip Codes with the Highest Percentage of Families with Income Above $100,000 in Indiana
RELATED REPORTS & OPTIONS
Family Income | $100k+
Indiana
Compare Zip Codes
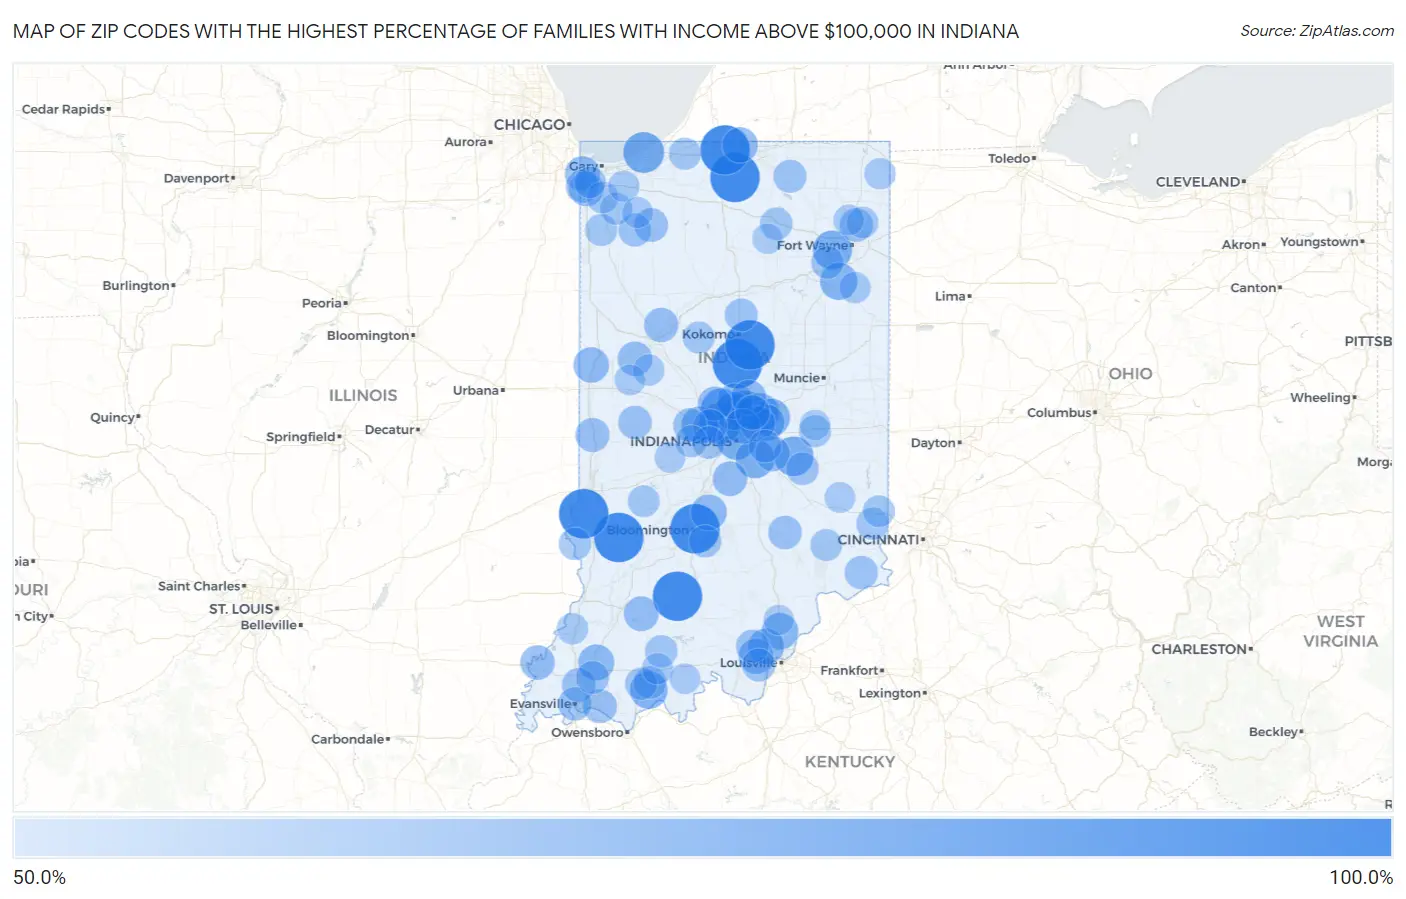
Map of Zip Codes with the Highest Percentage of Families with Income Above $100,000 in Indiana
50.0%
100.0%
Zip Codes with the Highest Percentage of Families with Income Above $100,000 in Indiana
| Zip Code | Families with Income > $100k | vs State | vs National | |
| 1. | 47406 | 100.0% | 40.5%(+59.5)#1 | 46.1%(+53.9)#4 |
| 2. | 46045 | 100.0% | 40.5%(+59.5)#2 | 46.1%(+53.9)#72 |
| 3. | 47445 | 100.0% | 40.5%(+59.5)#3 | 46.1%(+53.9)#147 |
| 4. | 47437 | 100.0% | 40.5%(+59.5)#4 | 46.1%(+53.9)#152 |
| 5. | 46595 | 100.0% | 40.5%(+59.5)#5 | 46.1%(+53.9)#193 |
| 6. | 46624 | 100.0% | 40.5%(+59.5)#6 | 46.1%(+53.9)#198 |
| 7. | 47869 | 100.0% | 40.5%(+59.5)#7 | 46.1%(+53.9)#224 |
| 8. | 46937 | 100.0% | 40.5%(+59.5)#8 | 46.1%(+53.9)#251 |
| 9. | 46278 | 79.5% | 40.5%(+39.0)#9 | 46.1%(+33.4)#1,084 |
| 10. | 46301 | 78.4% | 40.5%(+37.9)#10 | 46.1%(+32.3)#1,227 |
| 11. | 46077 | 77.3% | 40.5%(+36.8)#11 | 46.1%(+31.2)#1,362 |
| 12. | 46144 | 75.2% | 40.5%(+34.7)#12 | 46.1%(+29.1)#1,683 |
| 13. | 46204 | 74.7% | 40.5%(+34.2)#13 | 46.1%(+28.6)#1,752 |
| 14. | 46814 | 74.3% | 40.5%(+33.8)#14 | 46.1%(+28.2)#1,821 |
| 15. | 46033 | 74.0% | 40.5%(+33.5)#15 | 46.1%(+27.9)#1,875 |
| 16. | 46259 | 73.3% | 40.5%(+32.8)#16 | 46.1%(+27.2)#1,985 |
| 17. | 46037 | 72.7% | 40.5%(+32.2)#17 | 46.1%(+26.6)#2,085 |
| 18. | 46032 | 71.8% | 40.5%(+31.3)#18 | 46.1%(+25.7)#2,252 |
| 19. | 47550 | 70.7% | 40.5%(+30.2)#19 | 46.1%(+24.6)#2,472 |
| 20. | 46040 | 70.6% | 40.5%(+30.1)#20 | 46.1%(+24.5)#2,481 |
| 21. | 46791 | 70.1% | 40.5%(+29.6)#21 | 46.1%(+24.0)#2,587 |
| 22. | 46167 | 69.4% | 40.5%(+28.9)#22 | 46.1%(+23.3)#2,741 |
| 23. | 47143 | 68.2% | 40.5%(+27.7)#23 | 46.1%(+22.1)#2,984 |
| 24. | 46055 | 67.8% | 40.5%(+27.3)#24 | 46.1%(+21.7)#3,067 |
| 25. | 47654 | 66.7% | 40.5%(+26.2)#25 | 46.1%(+20.6)#3,332 |
| 26. | 47468 | 66.6% | 40.5%(+26.1)#26 | 46.1%(+20.5)#3,352 |
| 27. | 46074 | 66.3% | 40.5%(+25.8)#27 | 46.1%(+20.2)#3,409 |
| 28. | 47119 | 66.1% | 40.5%(+25.6)#28 | 46.1%(+20.0)#3,469 |
| 29. | 46530 | 65.3% | 40.5%(+24.8)#29 | 46.1%(+19.2)#3,663 |
| 30. | 46236 | 65.3% | 40.5%(+24.8)#30 | 46.1%(+19.2)#3,665 |
| 31. | 47991 | 65.2% | 40.5%(+24.7)#31 | 46.1%(+19.1)#3,707 |
| 32. | 47122 | 64.9% | 40.5%(+24.4)#32 | 46.1%(+18.8)#3,771 |
| 33. | 46062 | 64.5% | 40.5%(+24.0)#33 | 46.1%(+18.4)#3,871 |
| 34. | 46321 | 64.3% | 40.5%(+23.8)#34 | 46.1%(+18.2)#3,918 |
| 35. | 46220 | 64.2% | 40.5%(+23.7)#35 | 46.1%(+18.1)#3,941 |
| 36. | 46130 | 63.8% | 40.5%(+23.3)#36 | 46.1%(+17.7)#4,079 |
| 37. | 47519 | 63.8% | 40.5%(+23.3)#37 | 46.1%(+17.7)#4,081 |
| 38. | 46373 | 63.7% | 40.5%(+23.2)#38 | 46.1%(+17.6)#4,095 |
| 39. | 46038 | 63.2% | 40.5%(+22.7)#39 | 46.1%(+17.1)#4,214 |
| 40. | 46106 | 63.2% | 40.5%(+22.7)#40 | 46.1%(+17.1)#4,230 |
| 41. | 47616 | 62.9% | 40.5%(+22.4)#41 | 46.1%(+16.8)#4,319 |
| 42. | 47992 | 62.8% | 40.5%(+22.3)#42 | 46.1%(+16.7)#4,341 |
| 43. | 46075 | 62.5% | 40.5%(+22.0)#43 | 46.1%(+16.4)#4,422 |
| 44. | 47920 | 62.5% | 40.5%(+22.0)#44 | 46.1%(+16.4)#4,425 |
| 45. | 47854 | 61.8% | 40.5%(+21.3)#45 | 46.1%(+15.7)#4,617 |
| 46. | 46112 | 61.6% | 40.5%(+21.1)#46 | 46.1%(+15.5)#4,660 |
| 47. | 47630 | 61.4% | 40.5%(+20.9)#47 | 46.1%(+15.3)#4,714 |
| 48. | 46374 | 61.2% | 40.5%(+20.7)#48 | 46.1%(+15.1)#4,801 |
| 49. | 47725 | 61.1% | 40.5%(+20.6)#49 | 46.1%(+15.0)#4,818 |
| 50. | 46149 | 60.9% | 40.5%(+20.4)#50 | 46.1%(+14.8)#4,894 |
| 51. | 47236 | 60.7% | 40.5%(+20.2)#51 | 46.1%(+14.6)#4,959 |
| 52. | 47708 | 60.6% | 40.5%(+20.1)#52 | 46.1%(+14.5)#4,986 |
| 53. | 46845 | 60.3% | 40.5%(+19.8)#53 | 46.1%(+14.2)#5,046 |
| 54. | 47989 | 60.3% | 40.5%(+19.8)#54 | 46.1%(+14.2)#5,059 |
| 55. | 46311 | 60.0% | 40.5%(+19.5)#55 | 46.1%(+13.9)#5,117 |
| 56. | 47011 | 60.0% | 40.5%(+19.5)#56 | 46.1%(+13.9)#5,133 |
| 57. | 46392 | 59.6% | 40.5%(+19.1)#57 | 46.1%(+13.5)#5,262 |
| 58. | 47124 | 59.6% | 40.5%(+19.1)#58 | 46.1%(+13.5)#5,265 |
| 59. | 47136 | 59.5% | 40.5%(+19.0)#59 | 46.1%(+13.4)#5,302 |
| 60. | 46543 | 59.4% | 40.5%(+18.9)#60 | 46.1%(+13.3)#5,325 |
| 61. | 46959 | 59.2% | 40.5%(+18.7)#61 | 46.1%(+13.1)#5,404 |
| 62. | 47613 | 59.1% | 40.5%(+18.6)#62 | 46.1%(+13.0)#5,426 |
| 63. | 46123 | 58.6% | 40.5%(+18.1)#63 | 46.1%(+12.5)#5,572 |
| 64. | 46146 | 58.6% | 40.5%(+18.1)#64 | 46.1%(+12.5)#5,600 |
| 65. | 46163 | 58.5% | 40.5%(+18.0)#65 | 46.1%(+12.4)#5,613 |
| 66. | 46783 | 58.2% | 40.5%(+17.7)#66 | 46.1%(+12.1)#5,709 |
| 67. | 47401 | 58.1% | 40.5%(+17.6)#67 | 46.1%(+12.0)#5,725 |
| 68. | 46590 | 58.1% | 40.5%(+17.6)#68 | 46.1%(+12.0)#5,739 |
| 69. | 47579 | 58.0% | 40.5%(+17.5)#69 | 46.1%(+11.9)#5,777 |
| 70. | 47861 | 58.0% | 40.5%(+17.5)#70 | 46.1%(+11.9)#5,784 |
| 71. | 47022 | 57.8% | 40.5%(+17.3)#71 | 46.1%(+11.7)#5,852 |
| 72. | 47552 | 57.5% | 40.5%(+17.0)#72 | 46.1%(+11.4)#5,969 |
| 73. | 47575 | 57.3% | 40.5%(+16.8)#73 | 46.1%(+11.2)#6,016 |
| 74. | 47385 | 57.2% | 40.5%(+16.7)#74 | 46.1%(+11.1)#6,045 |
| 75. | 46381 | 57.1% | 40.5%(+16.6)#75 | 46.1%(+11.0)#6,082 |
| 76. | 46122 | 56.9% | 40.5%(+16.4)#76 | 46.1%(+10.8)#6,134 |
| 77. | 46341 | 56.7% | 40.5%(+16.2)#77 | 46.1%(+10.6)#6,188 |
| 78. | 46307 | 56.5% | 40.5%(+16.0)#78 | 46.1%(+10.4)#6,244 |
| 79. | 46371 | 56.5% | 40.5%(+16.0)#79 | 46.1%(+10.4)#6,259 |
| 80. | 47060 | 56.4% | 40.5%(+15.9)#80 | 46.1%(+10.3)#6,284 |
| 81. | 47833 | 56.4% | 40.5%(+15.9)#81 | 46.1%(+10.3)#6,293 |
| 82. | 47023 | 56.3% | 40.5%(+15.8)#82 | 46.1%(+10.2)#6,333 |
| 83. | 46920 | 56.3% | 40.5%(+15.8)#83 | 46.1%(+10.2)#6,337 |
| 84. | 46765 | 56.0% | 40.5%(+15.5)#84 | 46.1%(+9.90)#6,441 |
| 85. | 46375 | 55.9% | 40.5%(+15.4)#85 | 46.1%(+9.80)#6,470 |
| 86. | 46731 | 55.7% | 40.5%(+15.2)#86 | 46.1%(+9.60)#6,571 |
| 87. | 47981 | 55.3% | 40.5%(+14.8)#87 | 46.1%(+9.20)#6,710 |
| 88. | 47524 | 55.2% | 40.5%(+14.7)#88 | 46.1%(+9.10)#6,749 |
| 89. | 46742 | 55.0% | 40.5%(+14.5)#89 | 46.1%(+8.90)#6,807 |
| 90. | 47532 | 54.9% | 40.5%(+14.4)#90 | 46.1%(+8.80)#6,851 |
| 91. | 46385 | 54.6% | 40.5%(+14.1)#91 | 46.1%(+8.50)#6,934 |
| 92. | 46347 | 54.3% | 40.5%(+13.8)#92 | 46.1%(+8.20)#7,071 |
| 93. | 46748 | 54.0% | 40.5%(+13.5)#93 | 46.1%(+7.90)#7,159 |
| 94. | 47994 | 54.0% | 40.5%(+13.5)#94 | 46.1%(+7.90)#7,175 |
| 95. | 47036 | 53.9% | 40.5%(+13.4)#95 | 46.1%(+7.80)#7,219 |
| 96. | 46128 | 53.5% | 40.5%(+13.0)#96 | 46.1%(+7.40)#7,378 |
| 97. | 47514 | 53.5% | 40.5%(+13.0)#97 | 46.1%(+7.40)#7,381 |
| 98. | 47344 | 53.1% | 40.5%(+12.6)#98 | 46.1%(+7.00)#7,530 |
| 99. | 47126 | 53.0% | 40.5%(+12.5)#99 | 46.1%(+6.90)#7,552 |
| 100. | 46510 | 53.0% | 40.5%(+12.5)#100 | 46.1%(+6.90)#7,554 |
Common Questions
What are the Top 10 Zip Codes with the Highest Percentage of Families with Income Above $100,000 in Indiana?
Top 10 Zip Codes with the Highest Percentage of Families with Income Above $100,000 in Indiana are:
What zip code has the Highest Percentage of Families with Income Above $100,000 in Indiana?
47406 has the Highest Percentage of Families with Income Above $100,000 in Indiana with 100.0%.
What is the Percentage of Families with Income Above $100,000 in the State of Indiana?
Percentage of Families with Income Above $100,000 in Indiana is 40.5%.
What is the Percentage of Families with Income Above $100,000 in the United States?
Percentage of Families with Income Above $100,000 in the United States is 46.1%.