Zip Codes with the Highest Percentage of Guamanian / Chamorro Population in Indiana
RELATED REPORTS & OPTIONS
Guamanian / Chamorro
Indiana
Compare Zip Codes
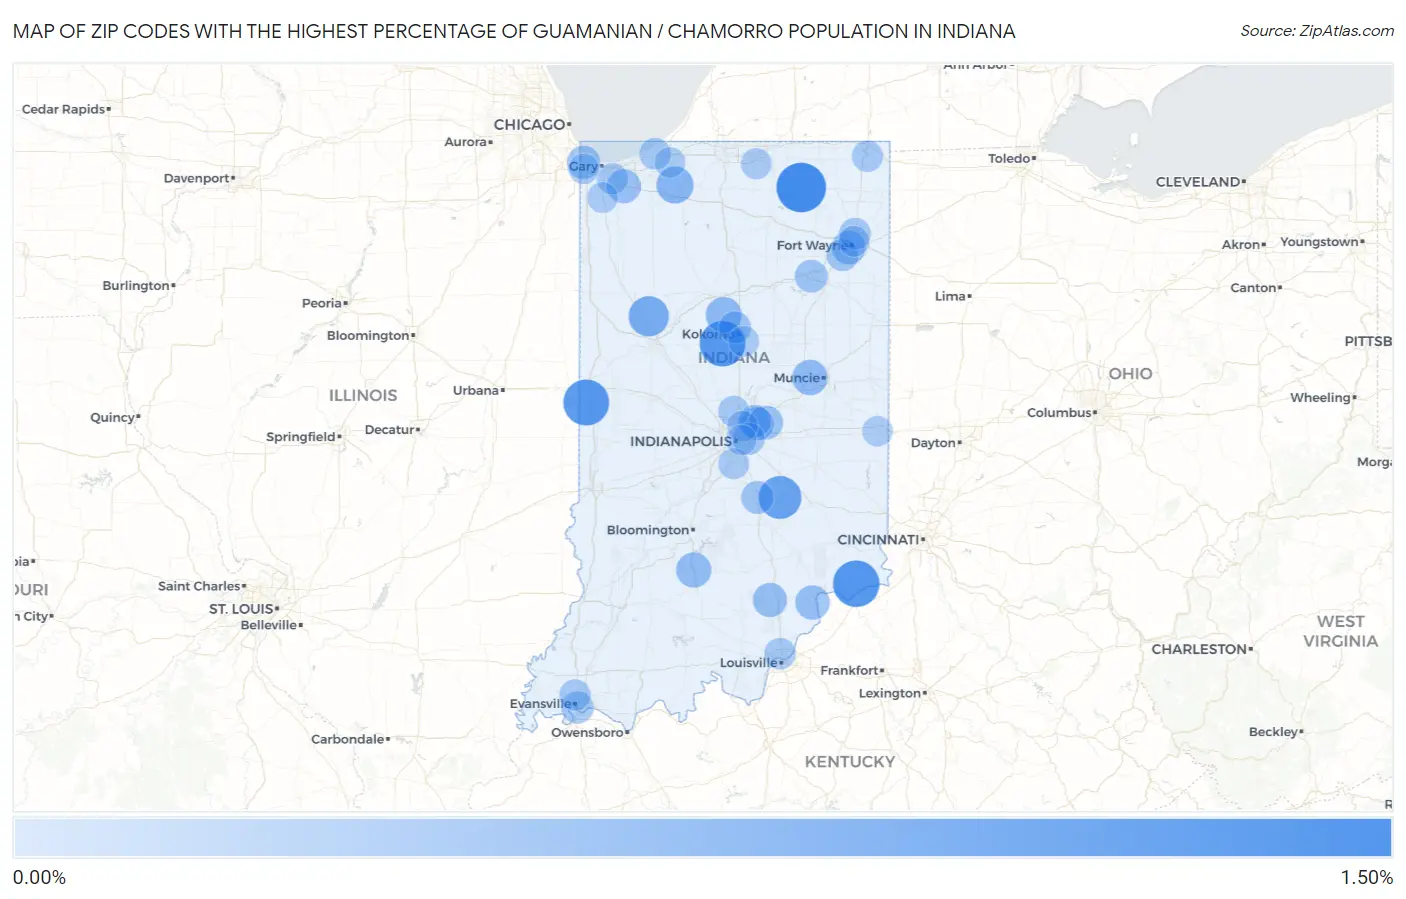
Map of Zip Codes with the Highest Percentage of Guamanian / Chamorro Population in Indiana
0.00%
1.50%
Zip Codes with the Highest Percentage of Guamanian / Chamorro Population in Indiana
| Zip Code | Guamanian / Chamorro | vs State | vs National | |
| 1. | 46767 | 1.05% | 0.012%(+1.04)#1 | 0.047%(+1.01)#149 |
| 2. | 47043 | 0.88% | 0.012%(+0.869)#2 | 0.047%(+0.834)#197 |
| 3. | 47974 | 0.85% | 0.012%(+0.835)#3 | 0.047%(+0.800)#210 |
| 4. | 46979 | 0.83% | 0.012%(+0.821)#4 | 0.047%(+0.787)#215 |
| 5. | 47234 | 0.68% | 0.012%(+0.670)#5 | 0.047%(+0.636)#274 |
| 6. | 47923 | 0.54% | 0.012%(+0.524)#6 | 0.047%(+0.489)#394 |
| 7. | 46346 | 0.36% | 0.012%(+0.347)#7 | 0.047%(+0.313)#585 |
| 8. | 46932 | 0.30% | 0.012%(+0.287)#8 | 0.047%(+0.253)#703 |
| 9. | 47396 | 0.27% | 0.012%(+0.262)#9 | 0.047%(+0.228)#767 |
| 10. | 47451 | 0.26% | 0.012%(+0.250)#10 | 0.047%(+0.215)#813 |
| 11. | 47243 | 0.22% | 0.012%(+0.204)#11 | 0.047%(+0.169)#970 |
| 12. | 47170 | 0.20% | 0.012%(+0.192)#12 | 0.047%(+0.157)#1,014 |
| 13. | 46385 | 0.20% | 0.012%(+0.184)#13 | 0.047%(+0.150)#1,049 |
| 14. | 46802 | 0.19% | 0.012%(+0.177)#14 | 0.047%(+0.142)#1,089 |
| 15. | 46055 | 0.18% | 0.012%(+0.165)#15 | 0.047%(+0.130)#1,159 |
| 16. | 46320 | 0.17% | 0.012%(+0.154)#16 | 0.047%(+0.120)#1,205 |
| 17. | 46236 | 0.15% | 0.012%(+0.136)#17 | 0.047%(+0.102)#1,299 |
| 18. | 46124 | 0.13% | 0.012%(+0.115)#18 | 0.047%(+0.081)#1,438 |
| 19. | 46750 | 0.13% | 0.012%(+0.114)#19 | 0.047%(+0.079)#1,448 |
| 20. | 46256 | 0.12% | 0.012%(+0.104)#20 | 0.047%(+0.070)#1,536 |
| 21. | 47713 | 0.10% | 0.012%(+0.092)#21 | 0.047%(+0.058)#1,637 |
| 22. | 46901 | 0.098% | 0.012%(+0.086)#22 | 0.047%(+0.052)#1,697 |
| 23. | 46219 | 0.093% | 0.012%(+0.081)#23 | 0.047%(+0.047)#1,750 |
| 24. | 46809 | 0.091% | 0.012%(+0.079)#24 | 0.047%(+0.045)#1,763 |
| 25. | 46825 | 0.075% | 0.012%(+0.063)#25 | 0.047%(+0.029)#1,925 |
| 26. | 46360 | 0.064% | 0.012%(+0.052)#26 | 0.047%(+0.017)#2,068 |
| 27. | 47129 | 0.056% | 0.012%(+0.044)#27 | 0.047%(+0.010)#2,162 |
| 28. | 47710 | 0.053% | 0.012%(+0.041)#28 | 0.047%(+0.007)#2,198 |
| 29. | 46342 | 0.044% | 0.012%(+0.032)#29 | 0.047%(-0.003)#2,359 |
| 30. | 46703 | 0.042% | 0.012%(+0.030)#30 | 0.047%(-0.004)#2,375 |
| 31. | 46032 | 0.037% | 0.012%(+0.025)#31 | 0.047%(-0.009)#2,475 |
| 32. | 46805 | 0.027% | 0.012%(+0.015)#32 | 0.047%(-0.020)#2,688 |
| 33. | 46517 | 0.026% | 0.012%(+0.014)#33 | 0.047%(-0.020)#2,709 |
| 34. | 46142 | 0.023% | 0.012%(+0.011)#34 | 0.047%(-0.023)#2,771 |
| 35. | 46220 | 0.022% | 0.012%(+0.009)#35 | 0.047%(-0.025)#2,803 |
| 36. | 46902 | 0.014% | 0.012%(+0.002)#36 | 0.047%(-0.033)#2,962 |
| 37. | 46350 | 0.013% | 0.012%(+0.001)#37 | 0.047%(-0.033)#2,967 |
| 38. | 46307 | 0.013% | 0.012%(+0.001)#38 | 0.047%(-0.034)#2,982 |
| 39. | 47374 | 0.011% | 0.012%(-0.001)#39 | 0.047%(-0.036)#3,016 |
| 40. | 46324 | 0.0046% | 0.012%(-0.007)#40 | 0.047%(-0.042)#3,098 |
| 41. | 46201 | 0.0032% | 0.012%(-0.009)#41 | 0.047%(-0.043)#3,118 |
1
2Common Questions
What are the Top 10 Zip Codes with the Highest Percentage of Guamanian / Chamorro Population in Indiana?
Top 10 Zip Codes with the Highest Percentage of Guamanian / Chamorro Population in Indiana are:
What zip code has the Highest Percentage of Guamanian / Chamorro Population in Indiana?
46767 has the Highest Percentage of Guamanian / Chamorro Population in Indiana with 1.05%.
What is the Percentage of Guamanian / Chamorro Population in the State of Indiana?
Percentage of Guamanian / Chamorro Population in Indiana is 0.012%.
What is the Percentage of Guamanian / Chamorro Population in the United States?
Percentage of Guamanian / Chamorro Population in the United States is 0.047%.