Zip Codes with the Highest Percentage of Population with a Degree in Business in Indiana
RELATED REPORTS & OPTIONS
Business
Indiana
Compare Zip Codes
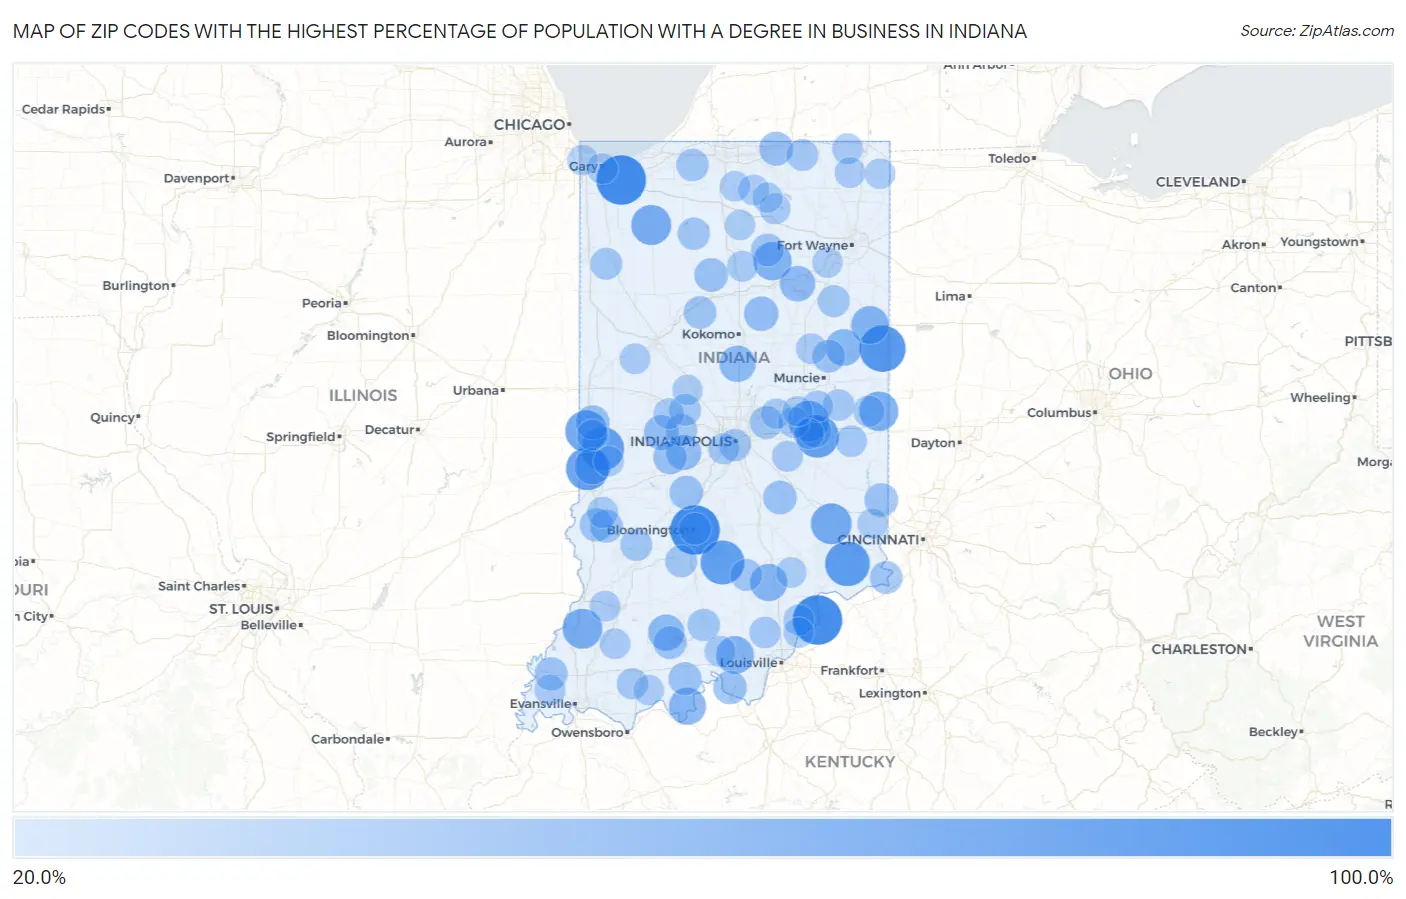
Map of Zip Codes with the Highest Percentage of Population with a Degree in Business in Indiana
20.0%
100.0%
Zip Codes with the Highest Percentage of Population with a Degree in Business in Indiana
| Zip Code | % Graduates | vs State | vs National | |
| 1. | 47405 | 100.0% | 19.9%(+80.1)#1 | 19.5%(+80.5)#7 |
| 2. | 46393 | 100.0% | 19.9%(+80.1)#2 | 19.5%(+80.5)#96 |
| 3. | 47104 | 100.0% | 19.9%(+80.1)#3 | 19.5%(+80.5)#188 |
| 4. | 47381 | 87.5% | 19.9%(+67.6)#4 | 19.5%(+68.0)#199 |
| 5. | 47017 | 81.6% | 19.9%(+61.8)#5 | 19.5%(+62.1)#222 |
| 6. | 47264 | 78.1% | 19.9%(+58.2)#6 | 19.5%(+58.6)#238 |
| 7. | 47860 | 76.5% | 19.9%(+56.6)#7 | 19.5%(+57.0)#249 |
| 8. | 47863 | 75.0% | 19.9%(+55.1)#8 | 19.5%(+55.5)#256 |
| 9. | 47337 | 75.0% | 19.9%(+55.1)#9 | 19.5%(+55.5)#258 |
| 10. | 47847 | 70.5% | 19.9%(+50.6)#10 | 19.5%(+51.0)#291 |
| 11. | 47351 | 67.3% | 19.9%(+47.4)#11 | 19.5%(+47.8)#317 |
| 12. | 47034 | 66.7% | 19.9%(+46.8)#12 | 19.5%(+47.2)#337 |
| 13. | 46374 | 63.6% | 19.9%(+43.8)#13 | 19.5%(+44.1)#376 |
| 14. | 47640 | 63.0% | 19.9%(+43.1)#14 | 19.5%(+43.5)#386 |
| 15. | 47341 | 60.9% | 19.9%(+41.0)#15 | 19.5%(+41.4)#411 |
| 16. | 46943 | 57.1% | 19.9%(+37.3)#16 | 19.5%(+37.6)#480 |
| 17. | 47326 | 55.4% | 19.9%(+35.5)#17 | 19.5%(+35.9)#514 |
| 18. | 47166 | 55.4% | 19.9%(+35.5)#18 | 19.5%(+35.9)#515 |
| 19. | 47229 | 53.4% | 19.9%(+33.5)#19 | 19.5%(+33.9)#549 |
| 20. | 47574 | 52.6% | 19.9%(+32.7)#20 | 19.5%(+33.1)#572 |
| 21. | 47336 | 51.5% | 19.9%(+31.6)#21 | 19.5%(+32.0)#600 |
| 22. | 46045 | 50.0% | 19.9%(+30.1)#22 | 19.5%(+30.5)#681 |
| 23. | 47880 | 50.0% | 19.9%(+30.1)#23 | 19.5%(+30.5)#714 |
| 24. | 47527 | 49.1% | 19.9%(+29.2)#24 | 19.5%(+29.6)#733 |
| 25. | 46702 | 46.7% | 19.9%(+26.8)#25 | 19.5%(+27.2)#813 |
| 26. | 46103 | 45.0% | 19.9%(+25.1)#26 | 19.5%(+25.5)#887 |
| 27. | 46172 | 44.4% | 19.9%(+24.5)#27 | 19.5%(+24.9)#926 |
| 28. | 46911 | 43.0% | 19.9%(+23.2)#28 | 19.5%(+23.5)#992 |
| 29. | 47966 | 42.3% | 19.9%(+22.4)#29 | 19.5%(+22.8)#1,049 |
| 30. | 46507 | 41.1% | 19.9%(+21.2)#30 | 19.5%(+21.6)#1,139 |
| 31. | 47016 | 40.0% | 19.9%(+20.1)#31 | 19.5%(+20.5)#1,213 |
| 32. | 46950 | 40.0% | 19.9%(+20.1)#32 | 19.5%(+20.5)#1,217 |
| 33. | 47234 | 39.8% | 19.9%(+19.9)#33 | 19.5%(+20.3)#1,250 |
| 34. | 47142 | 39.6% | 19.9%(+19.7)#34 | 19.5%(+20.1)#1,260 |
| 35. | 46128 | 39.4% | 19.9%(+19.5)#35 | 19.5%(+19.9)#1,271 |
| 36. | 46166 | 39.3% | 19.9%(+19.4)#36 | 19.5%(+19.8)#1,285 |
| 37. | 47879 | 37.9% | 19.9%(+18.0)#37 | 19.5%(+18.4)#1,390 |
| 38. | 47514 | 37.8% | 19.9%(+17.9)#38 | 19.5%(+18.3)#1,402 |
| 39. | 47521 | 37.7% | 19.9%(+17.8)#39 | 19.5%(+18.2)#1,410 |
| 40. | 47633 | 37.4% | 19.9%(+17.5)#40 | 19.5%(+17.9)#1,445 |
| 41. | 46055 | 37.0% | 19.9%(+17.2)#41 | 19.5%(+17.5)#1,485 |
| 42. | 47855 | 37.0% | 19.9%(+17.2)#42 | 19.5%(+17.5)#1,489 |
| 43. | 47338 | 36.9% | 19.9%(+17.0)#43 | 19.5%(+17.4)#1,503 |
| 44. | 46982 | 36.7% | 19.9%(+16.8)#44 | 19.5%(+17.2)#1,525 |
| 45. | 46917 | 36.6% | 19.9%(+16.7)#45 | 19.5%(+17.1)#1,534 |
| 46. | 47038 | 36.1% | 19.9%(+16.2)#46 | 19.5%(+16.6)#1,585 |
| 47. | 47385 | 36.1% | 19.9%(+16.2)#47 | 19.5%(+16.6)#1,591 |
| 48. | 46365 | 35.8% | 19.9%(+15.9)#48 | 19.5%(+16.3)#1,635 |
| 49. | 47454 | 35.6% | 19.9%(+15.7)#49 | 19.5%(+16.1)#1,665 |
| 50. | 46960 | 35.1% | 19.9%(+15.2)#50 | 19.5%(+15.6)#1,719 |
| 51. | 47406 | 34.4% | 19.9%(+14.5)#51 | 19.5%(+14.9)#1,821 |
| 52. | 46225 | 34.1% | 19.9%(+14.3)#52 | 19.5%(+14.6)#1,858 |
| 53. | 47462 | 34.1% | 19.9%(+14.2)#53 | 19.5%(+14.6)#1,863 |
| 54. | 46165 | 33.9% | 19.9%(+14.1)#54 | 19.5%(+14.4)#1,891 |
| 55. | 47220 | 33.4% | 19.9%(+13.5)#55 | 19.5%(+13.9)#1,962 |
| 56. | 46766 | 33.3% | 19.9%(+13.5)#56 | 19.5%(+13.8)#1,999 |
| 57. | 47465 | 33.3% | 19.9%(+13.5)#57 | 19.5%(+13.8)#2,000 |
| 58. | 47964 | 33.3% | 19.9%(+13.5)#58 | 19.5%(+13.8)#2,034 |
| 59. | 46147 | 33.0% | 19.9%(+13.1)#59 | 19.5%(+13.5)#2,080 |
| 60. | 46565 | 32.8% | 19.9%(+12.9)#60 | 19.5%(+13.3)#2,106 |
| 61. | 47360 | 32.1% | 19.9%(+12.2)#61 | 19.5%(+12.6)#2,250 |
| 62. | 47357 | 31.9% | 19.9%(+12.0)#62 | 19.5%(+12.4)#2,294 |
| 63. | 47388 | 31.6% | 19.9%(+11.7)#63 | 19.5%(+12.1)#2,363 |
| 64. | 47106 | 31.6% | 19.9%(+11.7)#64 | 19.5%(+12.1)#2,384 |
| 65. | 47537 | 31.5% | 19.9%(+11.6)#65 | 19.5%(+12.0)#2,394 |
| 66. | 47393 | 31.2% | 19.9%(+11.4)#66 | 19.5%(+11.8)#2,454 |
| 67. | 46241 | 31.0% | 19.9%(+11.1)#67 | 19.5%(+11.5)#2,529 |
| 68. | 47866 | 30.8% | 19.9%(+10.9)#68 | 19.5%(+11.3)#2,595 |
| 69. | 46186 | 30.7% | 19.9%(+10.8)#69 | 19.5%(+11.2)#2,619 |
| 70. | 47854 | 30.5% | 19.9%(+10.6)#70 | 19.5%(+11.0)#2,664 |
| 71. | 47141 | 30.4% | 19.9%(+10.5)#71 | 19.5%(+10.9)#2,699 |
| 72. | 47145 | 30.3% | 19.9%(+10.4)#72 | 19.5%(+10.8)#2,718 |
| 73. | 46161 | 30.0% | 19.9%(+10.2)#73 | 19.5%(+10.5)#2,812 |
| 74. | 46951 | 29.9% | 19.9%(+10.1)#74 | 19.5%(+10.4)#2,859 |
| 75. | 46538 | 29.9% | 19.9%(+9.97)#75 | 19.5%(+10.4)#2,885 |
| 76. | 47638 | 29.7% | 19.9%(+9.80)#76 | 19.5%(+10.2)#2,945 |
| 77. | 47597 | 29.5% | 19.9%(+9.66)#77 | 19.5%(+10.0)#2,992 |
| 78. | 47968 | 29.5% | 19.9%(+9.64)#78 | 19.5%(+10.0)#2,999 |
| 79. | 46776 | 29.4% | 19.9%(+9.48)#79 | 19.5%(+9.87)#3,067 |
| 80. | 46407 | 29.3% | 19.9%(+9.45)#80 | 19.5%(+9.83)#3,079 |
| 81. | 47992 | 29.1% | 19.9%(+9.19)#81 | 19.5%(+9.57)#3,180 |
| 82. | 46957 | 29.0% | 19.9%(+9.15)#82 | 19.5%(+9.53)#3,193 |
| 83. | 47598 | 29.0% | 19.9%(+9.09)#83 | 19.5%(+9.48)#3,217 |
| 84. | 46747 | 28.9% | 19.9%(+8.97)#84 | 19.5%(+9.35)#3,268 |
| 85. | 47022 | 28.8% | 19.9%(+8.90)#85 | 19.5%(+9.28)#3,302 |
| 86. | 47550 | 28.6% | 19.9%(+8.69)#86 | 19.5%(+9.07)#3,382 |
| 87. | 46550 | 28.5% | 19.9%(+8.63)#87 | 19.5%(+9.01)#3,430 |
| 88. | 46148 | 28.4% | 19.9%(+8.55)#88 | 19.5%(+8.94)#3,457 |
| 89. | 46048 | 28.4% | 19.9%(+8.55)#89 | 19.5%(+8.94)#3,458 |
| 90. | 47227 | 28.4% | 19.9%(+8.48)#90 | 19.5%(+8.86)#3,493 |
| 91. | 47111 | 28.3% | 19.9%(+8.37)#91 | 19.5%(+8.75)#3,540 |
| 92. | 46742 | 28.1% | 19.9%(+8.23)#92 | 19.5%(+8.62)#3,614 |
| 93. | 46506 | 28.1% | 19.9%(+8.23)#93 | 19.5%(+8.61)#3,616 |
| 94. | 46056 | 28.0% | 19.9%(+8.13)#94 | 19.5%(+8.51)#3,673 |
| 95. | 46570 | 28.0% | 19.9%(+8.08)#95 | 19.5%(+8.46)#3,711 |
| 96. | 47874 | 28.0% | 19.9%(+8.07)#96 | 19.5%(+8.45)#3,713 |
| 97. | 46783 | 27.9% | 19.9%(+8.03)#97 | 19.5%(+8.41)#3,728 |
| 98. | 46542 | 27.9% | 19.9%(+8.03)#98 | 19.5%(+8.41)#3,733 |
| 99. | 46327 | 27.9% | 19.9%(+7.99)#99 | 19.5%(+8.38)#3,750 |
| 100. | 46071 | 27.9% | 19.9%(+7.97)#100 | 19.5%(+8.36)#3,754 |
Common Questions
What are the Top 10 Zip Codes with the Highest Percentage of Population with a Degree in Business in Indiana?
Top 10 Zip Codes with the Highest Percentage of Population with a Degree in Business in Indiana are:
What zip code has the Highest Percentage of Population with a Degree in Business in Indiana?
47405 has the Highest Percentage of Population with a Degree in Business in Indiana with 100.0%.
What is the Percentage of Population with a Degree in Business in the State of Indiana?
Percentage of Population with a Degree in Business in Indiana is 19.9%.
What is the Percentage of Population with a Degree in Business in the United States?
Percentage of Population with a Degree in Business in the United States is 19.5%.