Zip Codes with the Highest Percentage of Scotch-Irish Population in Indiana
RELATED REPORTS & OPTIONS
Scotch-Irish
Indiana
Compare Zip Codes
Map of Zip Codes with the Highest Percentage of Scotch-Irish Population in Indiana
0.00%
100.00%
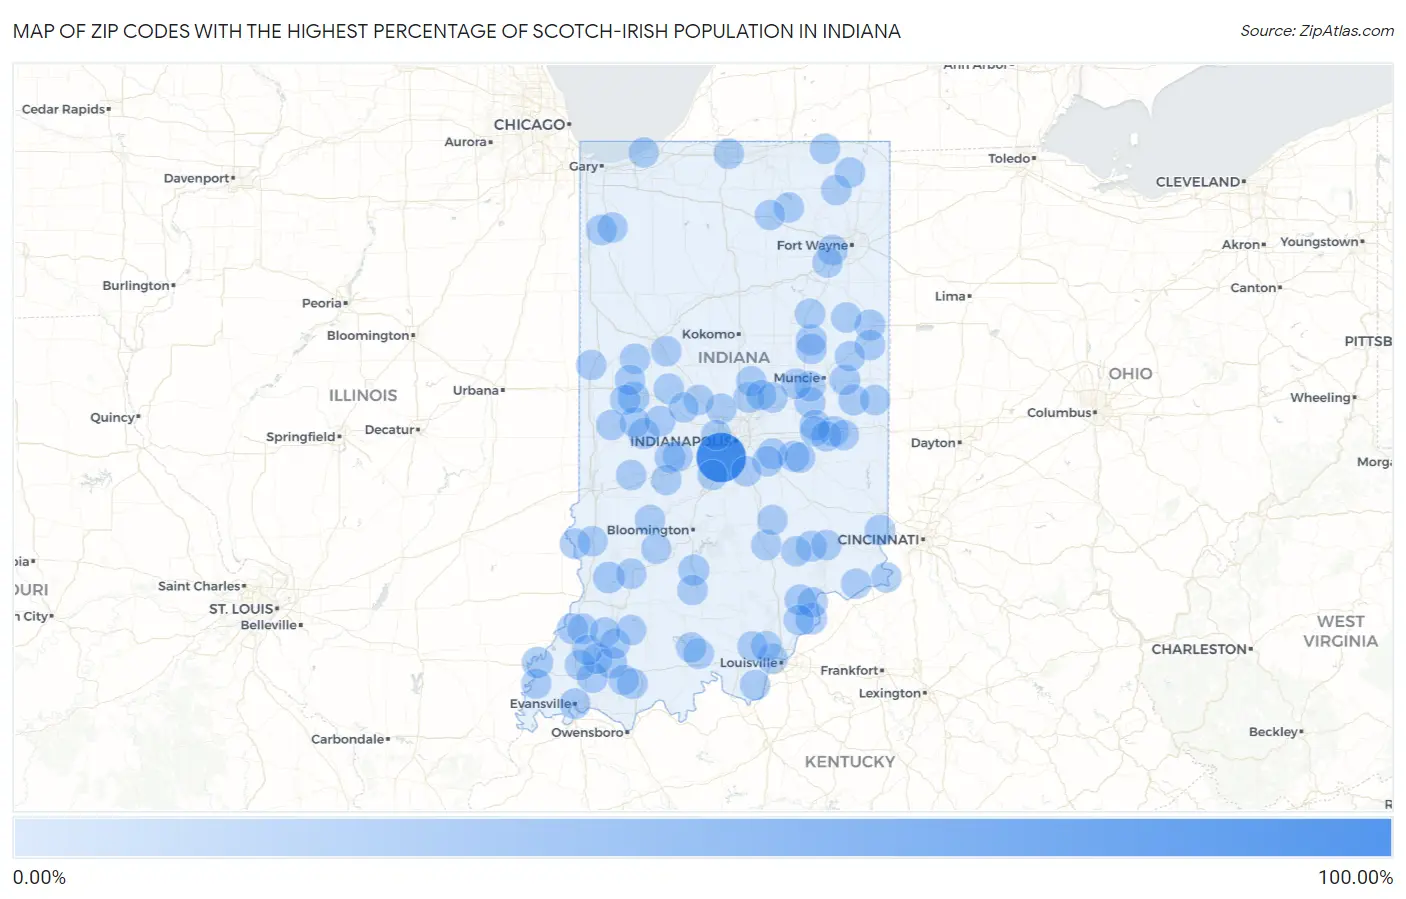
Zip Codes with the Highest Percentage of Scotch-Irish Population in Indiana
| Zip Code | Scotch-Irish | vs State | vs National | |
| 1. | 46183 | 100.00% | 0.73%(+99.3)#1 | 0.82%(+99.2)#2 |
| 2. | 47584 | 8.00% | 0.73%(+7.27)#2 | 0.82%(+7.18)#340 |
| 3. | 47162 | 7.69% | 0.73%(+6.96)#3 | 0.82%(+6.87)#365 |
| 4. | 47528 | 7.34% | 0.73%(+6.61)#4 | 0.82%(+6.53)#397 |
| 5. | 47990 | 7.28% | 0.73%(+6.55)#5 | 0.82%(+6.47)#407 |
| 6. | 47616 | 5.38% | 0.73%(+4.64)#6 | 0.82%(+4.56)#672 |
| 7. | 47138 | 4.59% | 0.73%(+3.85)#7 | 0.82%(+3.77)#888 |
| 8. | 47451 | 4.52% | 0.73%(+3.79)#8 | 0.82%(+3.70)#910 |
| 9. | 46144 | 4.30% | 0.73%(+3.57)#9 | 0.82%(+3.48)#999 |
| 10. | 47613 | 4.10% | 0.73%(+3.36)#10 | 0.82%(+3.28)#1,084 |
| 11. | 46175 | 4.09% | 0.73%(+3.36)#11 | 0.82%(+3.27)#1,086 |
| 12. | 46989 | 3.93% | 0.73%(+3.20)#12 | 0.82%(+3.11)#1,162 |
| 13. | 47326 | 3.88% | 0.73%(+3.15)#13 | 0.82%(+3.07)#1,189 |
| 14. | 47223 | 3.88% | 0.73%(+3.14)#14 | 0.82%(+3.06)#1,195 |
| 15. | 47524 | 3.85% | 0.73%(+3.11)#15 | 0.82%(+3.03)#1,219 |
| 16. | 47358 | 3.52% | 0.73%(+2.79)#16 | 0.82%(+2.70)#1,425 |
| 17. | 46957 | 3.19% | 0.73%(+2.46)#17 | 0.82%(+2.38)#1,734 |
| 18. | 46130 | 3.17% | 0.73%(+2.43)#18 | 0.82%(+2.35)#1,765 |
| 19. | 46381 | 3.09% | 0.73%(+2.36)#19 | 0.82%(+2.27)#1,848 |
| 20. | 47356 | 2.94% | 0.73%(+2.20)#20 | 0.82%(+2.12)#2,032 |
| 21. | 47243 | 2.86% | 0.73%(+2.12)#21 | 0.82%(+2.04)#2,138 |
| 22. | 47954 | 2.85% | 0.73%(+2.11)#22 | 0.82%(+2.03)#2,146 |
| 23. | 47537 | 2.82% | 0.73%(+2.08)#23 | 0.82%(+2.00)#2,178 |
| 24. | 47861 | 2.79% | 0.73%(+2.06)#24 | 0.82%(+1.97)#2,218 |
| 25. | 47683 | 2.70% | 0.73%(+1.97)#25 | 0.82%(+1.88)#2,333 |
| 26. | 47940 | 2.65% | 0.73%(+1.91)#26 | 0.82%(+1.83)#2,407 |
| 27. | 47708 | 2.64% | 0.73%(+1.91)#27 | 0.82%(+1.83)#2,415 |
| 28. | 46128 | 2.55% | 0.73%(+1.81)#28 | 0.82%(+1.73)#2,593 |
| 29. | 47387 | 2.49% | 0.73%(+1.76)#29 | 0.82%(+1.67)#2,688 |
| 30. | 47368 | 2.49% | 0.73%(+1.76)#30 | 0.82%(+1.67)#2,689 |
| 31. | 46104 | 2.45% | 0.73%(+1.71)#31 | 0.82%(+1.63)#2,761 |
| 32. | 47334 | 2.42% | 0.73%(+1.68)#32 | 0.82%(+1.60)#2,815 |
| 33. | 47640 | 2.34% | 0.73%(+1.61)#33 | 0.82%(+1.52)#2,951 |
| 34. | 47371 | 2.32% | 0.73%(+1.59)#34 | 0.82%(+1.50)#2,999 |
| 35. | 47344 | 2.29% | 0.73%(+1.55)#35 | 0.82%(+1.47)#3,065 |
| 36. | 47992 | 2.22% | 0.73%(+1.49)#36 | 0.82%(+1.40)#3,219 |
| 37. | 47853 | 2.19% | 0.73%(+1.46)#37 | 0.82%(+1.37)#3,291 |
| 38. | 47529 | 2.18% | 0.73%(+1.44)#38 | 0.82%(+1.36)#3,326 |
| 39. | 46012 | 2.14% | 0.73%(+1.41)#39 | 0.82%(+1.32)#3,411 |
| 40. | 46555 | 2.13% | 0.73%(+1.40)#40 | 0.82%(+1.32)#3,426 |
| 41. | 47352 | 2.10% | 0.73%(+1.36)#41 | 0.82%(+1.28)#3,535 |
| 42. | 46814 | 2.09% | 0.73%(+1.36)#42 | 0.82%(+1.28)#3,539 |
| 43. | 47023 | 2.09% | 0.73%(+1.35)#43 | 0.82%(+1.27)#3,556 |
| 44. | 47118 | 2.07% | 0.73%(+1.34)#44 | 0.82%(+1.26)#3,587 |
| 45. | 46746 | 2.07% | 0.73%(+1.33)#45 | 0.82%(+1.25)#3,605 |
| 46. | 47648 | 2.05% | 0.73%(+1.31)#46 | 0.82%(+1.23)#3,672 |
| 47. | 46759 | 2.04% | 0.73%(+1.31)#47 | 0.82%(+1.22)#3,692 |
| 48. | 47247 | 2.04% | 0.73%(+1.31)#48 | 0.82%(+1.22)#3,695 |
| 49. | 46126 | 2.02% | 0.73%(+1.29)#49 | 0.82%(+1.20)#3,741 |
| 50. | 46991 | 2.02% | 0.73%(+1.29)#50 | 0.82%(+1.20)#3,742 |
| 51. | 47637 | 2.02% | 0.73%(+1.29)#51 | 0.82%(+1.20)#3,746 |
| 52. | 47335 | 2.00% | 0.73%(+1.27)#52 | 0.82%(+1.18)#3,826 |
| 53. | 47994 | 2.00% | 0.73%(+1.27)#53 | 0.82%(+1.18)#3,828 |
| 54. | 47431 | 1.95% | 0.73%(+1.22)#54 | 0.82%(+1.14)#3,990 |
| 55. | 47649 | 1.95% | 0.73%(+1.22)#55 | 0.82%(+1.14)#3,993 |
| 56. | 47989 | 1.95% | 0.73%(+1.21)#56 | 0.82%(+1.13)#4,006 |
| 57. | 47373 | 1.92% | 0.73%(+1.19)#57 | 0.82%(+1.10)#4,100 |
| 58. | 46615 | 1.88% | 0.73%(+1.15)#58 | 0.82%(+1.07)#4,220 |
| 59. | 46121 | 1.86% | 0.73%(+1.13)#59 | 0.82%(+1.04)#4,293 |
| 60. | 46062 | 1.85% | 0.73%(+1.12)#60 | 0.82%(+1.03)#4,336 |
| 61. | 46077 | 1.83% | 0.73%(+1.10)#61 | 0.82%(+1.01)#4,401 |
| 62. | 46030 | 1.83% | 0.73%(+1.09)#62 | 0.82%(+1.01)#4,418 |
| 63. | 47941 | 1.82% | 0.73%(+1.09)#63 | 0.82%(+1.01)#4,424 |
| 64. | 46120 | 1.80% | 0.73%(+1.07)#64 | 0.82%(+0.985)#4,495 |
| 65. | 47038 | 1.80% | 0.73%(+1.06)#65 | 0.82%(+0.979)#4,517 |
| 66. | 47043 | 1.76% | 0.73%(+1.03)#66 | 0.82%(+0.944)#4,655 |
| 67. | 47446 | 1.73% | 0.73%(+1.00)#67 | 0.82%(+0.917)#4,764 |
| 68. | 47949 | 1.71% | 0.73%(+0.973)#68 | 0.82%(+0.888)#4,884 |
| 69. | 46052 | 1.70% | 0.73%(+0.969)#69 | 0.82%(+0.884)#4,895 |
| 70. | 46184 | 1.69% | 0.73%(+0.958)#70 | 0.82%(+0.873)#4,950 |
| 71. | 46051 | 1.67% | 0.73%(+0.940)#71 | 0.82%(+0.855)#5,036 |
| 72. | 46582 | 1.65% | 0.73%(+0.917)#72 | 0.82%(+0.832)#5,140 |
| 73. | 46310 | 1.64% | 0.73%(+0.903)#73 | 0.82%(+0.818)#5,209 |
| 74. | 46783 | 1.62% | 0.73%(+0.891)#74 | 0.82%(+0.806)#5,254 |
| 75. | 47991 | 1.62% | 0.73%(+0.889)#75 | 0.82%(+0.804)#5,263 |
| 76. | 46747 | 1.62% | 0.73%(+0.884)#76 | 0.82%(+0.799)#5,289 |
| 77. | 47882 | 1.62% | 0.73%(+0.883)#77 | 0.82%(+0.798)#5,298 |
| 78. | 47150 | 1.61% | 0.73%(+0.876)#78 | 0.82%(+0.791)#5,320 |
| 79. | 46755 | 1.60% | 0.73%(+0.869)#79 | 0.82%(+0.784)#5,356 |
| 80. | 47598 | 1.59% | 0.73%(+0.858)#80 | 0.82%(+0.773)#5,408 |
| 81. | 47355 | 1.58% | 0.73%(+0.848)#81 | 0.82%(+0.763)#5,469 |
| 82. | 46111 | 1.58% | 0.73%(+0.847)#82 | 0.82%(+0.762)#5,474 |
| 83. | 46301 | 1.56% | 0.73%(+0.824)#83 | 0.82%(+0.739)#5,614 |
| 84. | 46234 | 1.56% | 0.73%(+0.823)#84 | 0.82%(+0.738)#5,624 |
| 85. | 47119 | 1.56% | 0.73%(+0.822)#85 | 0.82%(+0.737)#5,626 |
| 86. | 47025 | 1.55% | 0.73%(+0.821)#86 | 0.82%(+0.736)#5,636 |
| 87. | 47265 | 1.55% | 0.73%(+0.814)#87 | 0.82%(+0.730)#5,671 |
| 88. | 47832 | 1.54% | 0.73%(+0.807)#88 | 0.82%(+0.722)#5,698 |
| 89. | 47564 | 1.54% | 0.73%(+0.803)#89 | 0.82%(+0.719)#5,715 |
| 90. | 46060 | 1.52% | 0.73%(+0.790)#90 | 0.82%(+0.705)#5,801 |
| 91. | 47175 | 1.52% | 0.73%(+0.787)#91 | 0.82%(+0.703)#5,818 |
| 92. | 47124 | 1.51% | 0.73%(+0.776)#92 | 0.82%(+0.691)#5,873 |
| 93. | 47117 | 1.49% | 0.73%(+0.759)#93 | 0.82%(+0.674)#5,979 |
| 94. | 47385 | 1.49% | 0.73%(+0.754)#94 | 0.82%(+0.669)#6,009 |
| 95. | 47631 | 1.48% | 0.73%(+0.745)#95 | 0.82%(+0.660)#6,055 |
| 96. | 47567 | 1.47% | 0.73%(+0.733)#96 | 0.82%(+0.648)#6,126 |
| 97. | 46102 | 1.46% | 0.73%(+0.723)#97 | 0.82%(+0.638)#6,180 |
| 98. | 47203 | 1.45% | 0.73%(+0.713)#98 | 0.82%(+0.628)#6,237 |
| 99. | 47141 | 1.44% | 0.73%(+0.710)#99 | 0.82%(+0.625)#6,250 |
| 100. | 47424 | 1.44% | 0.73%(+0.705)#100 | 0.82%(+0.620)#6,278 |
Common Questions
What are the Top 10 Zip Codes with the Highest Percentage of Scotch-Irish Population in Indiana?
Top 10 Zip Codes with the Highest Percentage of Scotch-Irish Population in Indiana are:
What zip code has the Highest Percentage of Scotch-Irish Population in Indiana?
46183 has the Highest Percentage of Scotch-Irish Population in Indiana with 100.00%.
What is the Percentage of Scotch-Irish Population in the State of Indiana?
Percentage of Scotch-Irish Population in Indiana is 0.73%.
What is the Percentage of Scotch-Irish Population in the United States?
Percentage of Scotch-Irish Population in the United States is 0.82%.