Zip Codes with the Highest Percentage of Population Employed in Health Care & Social Assistance in Indiana
RELATED REPORTS & OPTIONS
Health Care & Social Assistance
Indiana
Compare Zip Codes
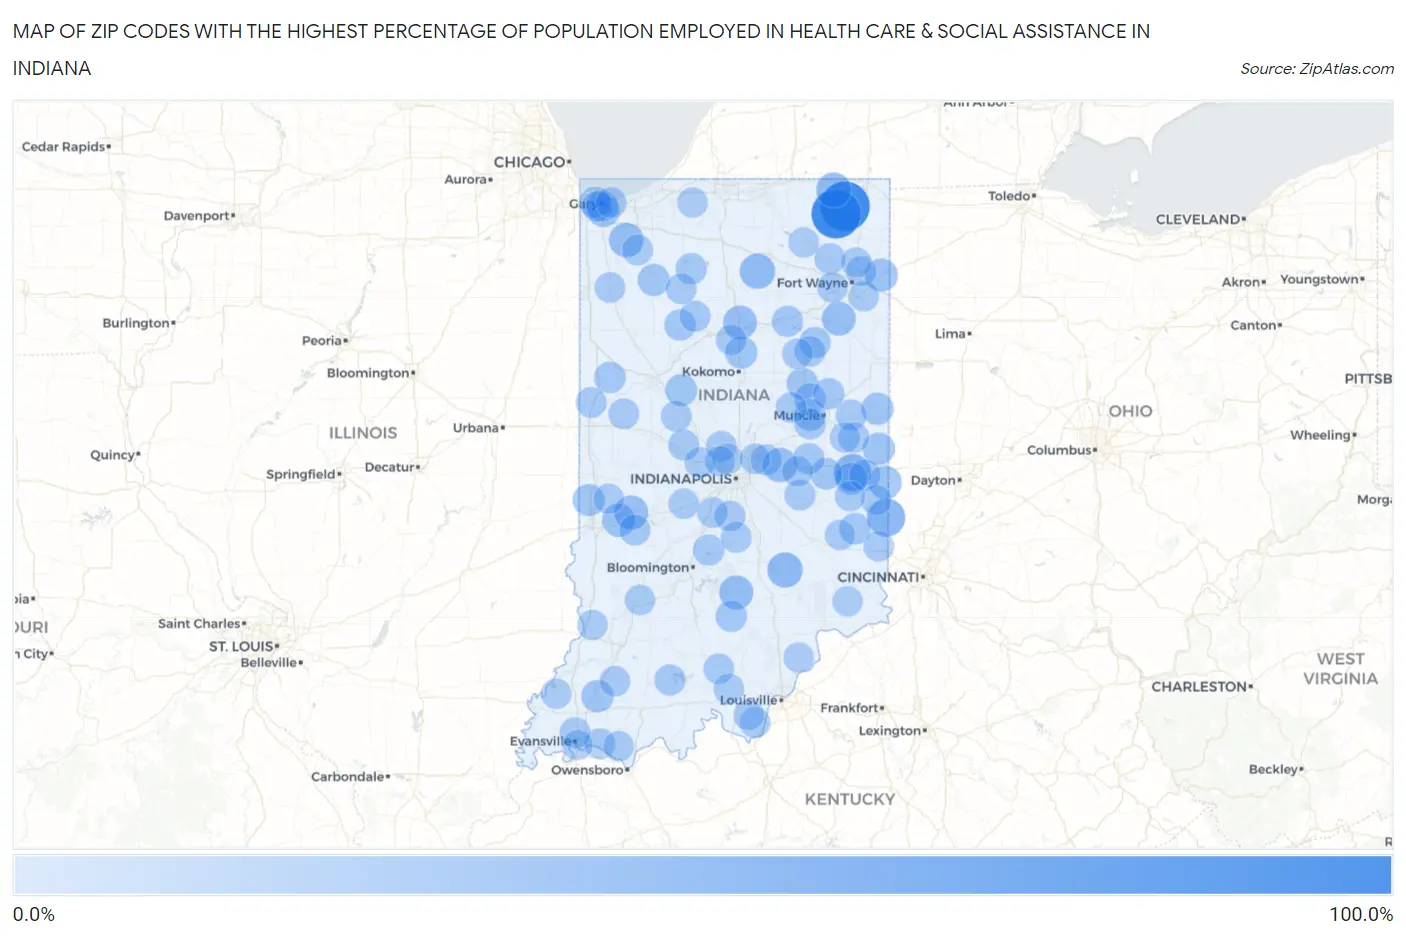
Map of Zip Codes with the Highest Percentage of Population Employed in Health Care & Social Assistance in Indiana
0.0%
100.0%
Zip Codes with the Highest Percentage of Population Employed in Health Care & Social Assistance in Indiana
| Zip Code | % Employed | vs State | vs National | |
| 1. | 46789 | 100.0% | 14.1%(+85.9)#1 | 13.9%(+86.1)#9 |
| 2. | 46786 | 100.0% | 14.1%(+85.9)#2 | 13.9%(+86.1)#46 |
| 3. | 47010 | 50.0% | 14.1%(+35.9)#3 | 13.9%(+36.1)#217 |
| 4. | 47370 | 47.1% | 14.1%(+33.1)#4 | 13.9%(+33.2)#260 |
| 5. | 47236 | 39.2% | 14.1%(+25.1)#5 | 13.9%(+25.3)#420 |
| 6. | 46508 | 39.0% | 14.1%(+24.9)#6 | 13.9%(+25.0)#423 |
| 7. | 46771 | 38.0% | 14.1%(+23.9)#7 | 13.9%(+24.0)#461 |
| 8. | 46302 | 35.7% | 14.1%(+21.6)#8 | 13.9%(+21.8)#559 |
| 9. | 46154 | 35.5% | 14.1%(+21.4)#9 | 13.9%(+21.6)#571 |
| 10. | 47235 | 34.1% | 14.1%(+20.0)#10 | 13.9%(+20.2)#647 |
| 11. | 47853 | 33.8% | 14.1%(+19.7)#11 | 13.9%(+19.9)#664 |
| 12. | 46958 | 33.3% | 14.1%(+19.2)#12 | 13.9%(+19.4)#683 |
| 13. | 46791 | 33.2% | 14.1%(+19.1)#13 | 13.9%(+19.3)#707 |
| 14. | 47324 | 30.8% | 14.1%(+16.7)#14 | 13.9%(+16.8)#872 |
| 15. | 47881 | 30.6% | 14.1%(+16.5)#15 | 13.9%(+16.6)#897 |
| 16. | 46797 | 29.7% | 14.1%(+15.6)#16 | 13.9%(+15.7)#971 |
| 17. | 47382 | 27.0% | 14.1%(+12.9)#17 | 13.9%(+13.0)#1,342 |
| 18. | 47683 | 26.9% | 14.1%(+12.8)#18 | 13.9%(+13.0)#1,359 |
| 19. | 46959 | 26.9% | 14.1%(+12.8)#19 | 13.9%(+12.9)#1,371 |
| 20. | 47341 | 26.1% | 14.1%(+12.0)#20 | 13.9%(+12.1)#1,508 |
| 21. | 47357 | 26.0% | 14.1%(+11.9)#21 | 13.9%(+12.1)#1,516 |
| 22. | 47957 | 26.0% | 14.1%(+11.9)#22 | 13.9%(+12.0)#1,525 |
| 23. | 47884 | 26.0% | 14.1%(+11.9)#23 | 13.9%(+12.0)#1,528 |
| 24. | 46409 | 25.2% | 14.1%(+11.1)#24 | 13.9%(+11.3)#1,684 |
| 25. | 46058 | 25.0% | 14.1%(+10.9)#25 | 13.9%(+11.1)#1,713 |
| 26. | 46930 | 24.7% | 14.1%(+10.6)#26 | 13.9%(+10.8)#1,802 |
| 27. | 47352 | 24.5% | 14.1%(+10.4)#27 | 13.9%(+10.6)#1,857 |
| 28. | 47396 | 24.5% | 14.1%(+10.4)#28 | 13.9%(+10.6)#1,860 |
| 29. | 47975 | 23.8% | 14.1%(+9.67)#29 | 13.9%(+9.83)#2,059 |
| 30. | 46407 | 23.4% | 14.1%(+9.35)#30 | 13.9%(+9.50)#2,166 |
| 31. | 47030 | 23.4% | 14.1%(+9.33)#31 | 13.9%(+9.49)#2,172 |
| 32. | 47342 | 23.2% | 14.1%(+9.14)#32 | 13.9%(+9.29)#2,263 |
| 33. | 46406 | 23.2% | 14.1%(+9.12)#33 | 13.9%(+9.28)#2,271 |
| 34. | 47338 | 23.2% | 14.1%(+9.06)#34 | 13.9%(+9.21)#2,297 |
| 35. | 46792 | 23.0% | 14.1%(+8.88)#35 | 13.9%(+9.04)#2,357 |
| 36. | 47260 | 22.9% | 14.1%(+8.77)#36 | 13.9%(+8.92)#2,392 |
| 37. | 47351 | 22.8% | 14.1%(+8.68)#37 | 13.9%(+8.83)#2,424 |
| 38. | 47950 | 22.8% | 14.1%(+8.67)#38 | 13.9%(+8.82)#2,432 |
| 39. | 46941 | 22.7% | 14.1%(+8.62)#39 | 13.9%(+8.78)#2,466 |
| 40. | 47334 | 22.6% | 14.1%(+8.50)#40 | 13.9%(+8.66)#2,520 |
| 41. | 46968 | 22.5% | 14.1%(+8.41)#41 | 13.9%(+8.56)#2,568 |
| 42. | 47468 | 22.4% | 14.1%(+8.28)#42 | 13.9%(+8.44)#2,615 |
| 43. | 47330 | 22.4% | 14.1%(+8.27)#43 | 13.9%(+8.43)#2,618 |
| 44. | 47521 | 21.8% | 14.1%(+7.75)#44 | 13.9%(+7.91)#2,882 |
| 45. | 46055 | 21.5% | 14.1%(+7.40)#45 | 13.9%(+7.55)#3,067 |
| 46. | 46102 | 21.4% | 14.1%(+7.31)#46 | 13.9%(+7.46)#3,113 |
| 47. | 47840 | 21.3% | 14.1%(+7.18)#47 | 13.9%(+7.34)#3,183 |
| 48. | 46723 | 21.2% | 14.1%(+7.09)#48 | 13.9%(+7.24)#3,254 |
| 49. | 46978 | 21.2% | 14.1%(+7.08)#49 | 13.9%(+7.23)#3,260 |
| 50. | 46104 | 21.0% | 14.1%(+6.94)#50 | 13.9%(+7.09)#3,356 |
| 51. | 47117 | 21.0% | 14.1%(+6.92)#51 | 13.9%(+7.08)#3,365 |
| 52. | 46035 | 21.0% | 14.1%(+6.89)#52 | 13.9%(+7.05)#3,387 |
| 53. | 47340 | 20.8% | 14.1%(+6.76)#53 | 13.9%(+6.91)#3,463 |
| 54. | 47358 | 20.8% | 14.1%(+6.71)#54 | 13.9%(+6.86)#3,510 |
| 55. | 47630 | 20.7% | 14.1%(+6.64)#55 | 13.9%(+6.80)#3,559 |
| 56. | 47969 | 20.7% | 14.1%(+6.63)#56 | 13.9%(+6.79)#3,567 |
| 57. | 46181 | 20.6% | 14.1%(+6.52)#57 | 13.9%(+6.68)#3,642 |
| 58. | 46347 | 20.6% | 14.1%(+6.47)#58 | 13.9%(+6.63)#3,666 |
| 59. | 47991 | 20.5% | 14.1%(+6.45)#59 | 13.9%(+6.61)#3,681 |
| 60. | 46404 | 20.5% | 14.1%(+6.43)#60 | 13.9%(+6.59)#3,702 |
| 61. | 46167 | 20.4% | 14.1%(+6.30)#61 | 13.9%(+6.46)#3,791 |
| 62. | 46403 | 20.3% | 14.1%(+6.26)#62 | 13.9%(+6.41)#3,826 |
| 63. | 46001 | 20.3% | 14.1%(+6.21)#63 | 13.9%(+6.37)#3,858 |
| 64. | 46996 | 20.3% | 14.1%(+6.19)#64 | 13.9%(+6.34)#3,875 |
| 65. | 46117 | 20.2% | 14.1%(+6.14)#65 | 13.9%(+6.29)#3,911 |
| 66. | 46106 | 20.1% | 14.1%(+6.06)#66 | 13.9%(+6.21)#3,966 |
| 67. | 47710 | 20.1% | 14.1%(+6.00)#67 | 13.9%(+6.15)#4,016 |
| 68. | 46111 | 20.1% | 14.1%(+6.00)#68 | 13.9%(+6.15)#4,019 |
| 69. | 46967 | 20.0% | 14.1%(+5.91)#69 | 13.9%(+6.06)#4,095 |
| 70. | 46991 | 20.0% | 14.1%(+5.89)#70 | 13.9%(+6.04)#4,118 |
| 71. | 46952 | 19.9% | 14.1%(+5.78)#71 | 13.9%(+5.94)#4,175 |
| 72. | 46814 | 19.7% | 14.1%(+5.58)#72 | 13.9%(+5.74)#4,333 |
| 73. | 46180 | 19.6% | 14.1%(+5.55)#73 | 13.9%(+5.71)#4,362 |
| 74. | 47598 | 19.6% | 14.1%(+5.54)#74 | 13.9%(+5.70)#4,381 |
| 75. | 47943 | 19.6% | 14.1%(+5.50)#75 | 13.9%(+5.66)#4,404 |
| 76. | 47125 | 19.5% | 14.1%(+5.45)#76 | 13.9%(+5.61)#4,461 |
| 77. | 46077 | 19.5% | 14.1%(+5.39)#77 | 13.9%(+5.54)#4,522 |
| 78. | 47634 | 19.5% | 14.1%(+5.38)#78 | 13.9%(+5.54)#4,532 |
| 79. | 47160 | 19.4% | 14.1%(+5.35)#79 | 13.9%(+5.51)#4,567 |
| 80. | 46816 | 19.4% | 14.1%(+5.35)#80 | 13.9%(+5.50)#4,572 |
| 81. | 47665 | 19.4% | 14.1%(+5.33)#81 | 13.9%(+5.49)#4,587 |
| 82. | 46835 | 19.3% | 14.1%(+5.20)#82 | 13.9%(+5.36)#4,708 |
| 83. | 46365 | 19.2% | 14.1%(+5.16)#83 | 13.9%(+5.31)#4,753 |
| 84. | 47353 | 19.2% | 14.1%(+5.13)#84 | 13.9%(+5.29)#4,778 |
| 85. | 47115 | 19.1% | 14.1%(+5.00)#85 | 13.9%(+5.15)#4,897 |
| 86. | 47141 | 19.1% | 14.1%(+4.98)#86 | 13.9%(+5.13)#4,922 |
| 87. | 47017 | 19.1% | 14.1%(+4.97)#87 | 13.9%(+5.13)#4,923 |
| 88. | 47449 | 19.0% | 14.1%(+4.96)#88 | 13.9%(+5.11)#4,940 |
| 89. | 47035 | 19.0% | 14.1%(+4.96)#89 | 13.9%(+5.11)#4,943 |
| 90. | 47036 | 19.0% | 14.1%(+4.90)#90 | 13.9%(+5.05)#5,003 |
| 91. | 46760 | 18.9% | 14.1%(+4.84)#91 | 13.9%(+4.99)#5,056 |
| 92. | 46268 | 18.9% | 14.1%(+4.82)#92 | 13.9%(+4.97)#5,094 |
| 93. | 47516 | 18.9% | 14.1%(+4.77)#93 | 13.9%(+4.92)#5,128 |
| 94. | 46278 | 18.8% | 14.1%(+4.71)#94 | 13.9%(+4.87)#5,206 |
| 95. | 47354 | 18.7% | 14.1%(+4.61)#95 | 13.9%(+4.76)#5,315 |
| 96. | 46256 | 18.7% | 14.1%(+4.60)#96 | 13.9%(+4.76)#5,317 |
| 97. | 47874 | 18.7% | 14.1%(+4.60)#97 | 13.9%(+4.75)#5,326 |
| 98. | 47331 | 18.7% | 14.1%(+4.59)#98 | 13.9%(+4.75)#5,339 |
| 99. | 47713 | 18.7% | 14.1%(+4.59)#99 | 13.9%(+4.74)#5,343 |
| 100. | 46845 | 18.6% | 14.1%(+4.54)#100 | 13.9%(+4.69)#5,389 |
Common Questions
What are the Top 10 Zip Codes with the Highest Percentage of Population Employed in Health Care & Social Assistance in Indiana?
Top 10 Zip Codes with the Highest Percentage of Population Employed in Health Care & Social Assistance in Indiana are:
What zip code has the Highest Percentage of Population Employed in Health Care & Social Assistance in Indiana?
46789 has the Highest Percentage of Population Employed in Health Care & Social Assistance in Indiana with 100.0%.
What is the Percentage of Population Employed in Health Care & Social Assistance in the State of Indiana?
Percentage of Population Employed in Health Care & Social Assistance in Indiana is 14.1%.
What is the Percentage of Population Employed in Health Care & Social Assistance in the United States?
Percentage of Population Employed in Health Care & Social Assistance in the United States is 13.9%.