Zip Codes with the Highest Percentage of Population Employed in Firefighting & Prevention in Indiana
RELATED REPORTS & OPTIONS
Firefighting & Prevention
Indiana
Compare Zip Codes
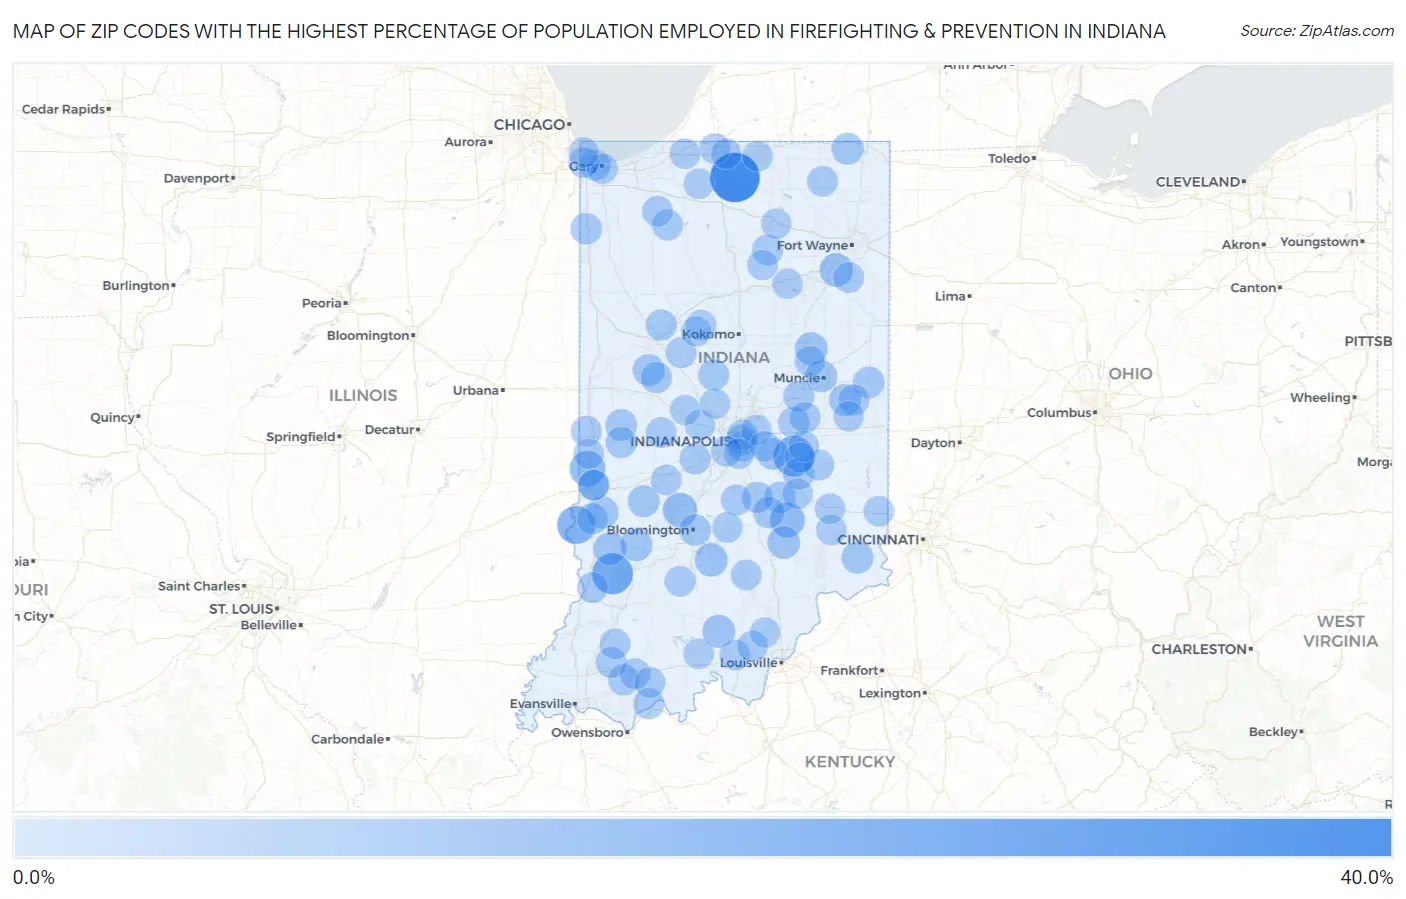
Map of Zip Codes with the Highest Percentage of Population Employed in Firefighting & Prevention in Indiana
0.0%
40.0%
Zip Codes with the Highest Percentage of Population Employed in Firefighting & Prevention in Indiana
| Zip Code | % Employed | vs State | vs National | |
| 1. | 46595 | 31.6% | 0.91%(+30.7)#1 | 1.2%(+30.4)#41 |
| 2. | 47596 | 17.9% | 0.91%(+17.0)#2 | 1.2%(+16.8)#117 |
| 3. | 46144 | 17.5% | 0.91%(+16.6)#3 | 1.2%(+16.3)#124 |
| 4. | 47849 | 13.5% | 0.91%(+12.6)#4 | 1.2%(+12.4)#188 |
| 5. | 47863 | 10.0% | 0.91%(+9.09)#5 | 1.2%(+8.81)#303 |
| 6. | 47244 | 8.6% | 0.91%(+7.65)#6 | 1.2%(+7.37)#366 |
| 7. | 47464 | 8.0% | 0.91%(+7.09)#7 | 1.2%(+6.81)#411 |
| 8. | 46799 | 6.3% | 0.91%(+5.37)#8 | 1.2%(+5.09)#630 |
| 9. | 47436 | 5.9% | 0.91%(+5.02)#9 | 1.2%(+4.74)#688 |
| 10. | 47848 | 5.7% | 0.91%(+4.76)#10 | 1.2%(+4.48)#734 |
| 11. | 46957 | 5.5% | 0.91%(+4.59)#11 | 1.2%(+4.31)#767 |
| 12. | 47125 | 5.5% | 0.91%(+4.59)#12 | 1.2%(+4.31)#768 |
| 13. | 47273 | 5.4% | 0.91%(+4.49)#13 | 1.2%(+4.21)#787 |
| 14. | 47465 | 4.9% | 0.91%(+3.98)#14 | 1.2%(+3.70)#952 |
| 15. | 47866 | 4.3% | 0.91%(+3.43)#15 | 1.2%(+3.15)#1,190 |
| 16. | 47306 | 4.3% | 0.91%(+3.40)#16 | 1.2%(+3.12)#1,198 |
| 17. | 47018 | 4.3% | 0.91%(+3.38)#17 | 1.2%(+3.10)#1,211 |
| 18. | 47981 | 4.2% | 0.91%(+3.30)#18 | 1.2%(+3.02)#1,260 |
| 19. | 46776 | 4.1% | 0.91%(+3.21)#19 | 1.2%(+2.93)#1,292 |
| 20. | 47833 | 4.0% | 0.91%(+3.12)#20 | 1.2%(+2.84)#1,340 |
| 21. | 47354 | 4.0% | 0.91%(+3.09)#21 | 1.2%(+2.81)#1,365 |
| 22. | 47234 | 3.8% | 0.91%(+2.85)#22 | 1.2%(+2.57)#1,501 |
| 23. | 46130 | 3.7% | 0.91%(+2.84)#23 | 1.2%(+2.56)#1,513 |
| 24. | 47859 | 3.7% | 0.91%(+2.83)#24 | 1.2%(+2.55)#1,520 |
| 25. | 46376 | 3.7% | 0.91%(+2.80)#25 | 1.2%(+2.52)#1,560 |
| 26. | 47394 | 3.6% | 0.91%(+2.69)#26 | 1.2%(+2.41)#1,641 |
| 27. | 47405 | 3.5% | 0.91%(+2.62)#27 | 1.2%(+2.34)#1,697 |
| 28. | 47226 | 3.5% | 0.91%(+2.57)#28 | 1.2%(+2.29)#1,745 |
| 29. | 47955 | 3.4% | 0.91%(+2.54)#29 | 1.2%(+2.26)#1,769 |
| 30. | 46186 | 3.2% | 0.91%(+2.32)#30 | 1.2%(+2.04)#1,982 |
| 31. | 47809 | 3.2% | 0.91%(+2.32)#31 | 1.2%(+2.04)#1,984 |
| 32. | 46124 | 3.2% | 0.91%(+2.27)#32 | 1.2%(+1.99)#2,045 |
| 33. | 46150 | 3.0% | 0.91%(+2.12)#33 | 1.2%(+1.84)#2,201 |
| 34. | 46118 | 3.0% | 0.91%(+2.08)#34 | 1.2%(+1.80)#2,269 |
| 35. | 47872 | 3.0% | 0.91%(+2.07)#35 | 1.2%(+1.79)#2,284 |
| 36. | 47920 | 3.0% | 0.91%(+2.07)#36 | 1.2%(+1.79)#2,285 |
| 37. | 47850 | 2.9% | 0.91%(+1.98)#37 | 1.2%(+1.70)#2,406 |
| 38. | 46017 | 2.9% | 0.91%(+1.97)#38 | 1.2%(+1.69)#2,422 |
| 39. | 47358 | 2.9% | 0.91%(+1.97)#39 | 1.2%(+1.69)#2,425 |
| 40. | 46050 | 2.8% | 0.91%(+1.86)#40 | 1.2%(+1.58)#2,617 |
| 41. | 47637 | 2.8% | 0.91%(+1.85)#41 | 1.2%(+1.57)#2,639 |
| 42. | 46366 | 2.7% | 0.91%(+1.81)#42 | 1.2%(+1.53)#2,695 |
| 43. | 47584 | 2.7% | 0.91%(+1.80)#43 | 1.2%(+1.52)#2,725 |
| 44. | 47384 | 2.7% | 0.91%(+1.79)#44 | 1.2%(+1.51)#2,731 |
| 45. | 47615 | 2.7% | 0.91%(+1.79)#45 | 1.2%(+1.51)#2,732 |
| 46. | 46406 | 2.7% | 0.91%(+1.77)#46 | 1.2%(+1.49)#2,769 |
| 47. | 47523 | 2.6% | 0.91%(+1.70)#47 | 1.2%(+1.42)#2,892 |
| 48. | 46348 | 2.6% | 0.91%(+1.69)#48 | 1.2%(+1.41)#2,897 |
| 49. | 46181 | 2.6% | 0.91%(+1.67)#49 | 1.2%(+1.39)#2,950 |
| 50. | 47579 | 2.5% | 0.91%(+1.61)#50 | 1.2%(+1.33)#3,062 |
| 51. | 46058 | 2.5% | 0.91%(+1.58)#51 | 1.2%(+1.30)#3,137 |
| 52. | 47166 | 2.5% | 0.91%(+1.56)#52 | 1.2%(+1.28)#3,176 |
| 53. | 47124 | 2.4% | 0.91%(+1.52)#53 | 1.2%(+1.24)#3,260 |
| 54. | 46201 | 2.4% | 0.91%(+1.52)#54 | 1.2%(+1.24)#3,275 |
| 55. | 46173 | 2.4% | 0.91%(+1.51)#55 | 1.2%(+1.23)#3,290 |
| 56. | 46982 | 2.4% | 0.91%(+1.50)#56 | 1.2%(+1.22)#3,326 |
| 57. | 46784 | 2.4% | 0.91%(+1.50)#57 | 1.2%(+1.22)#3,330 |
| 58. | 46203 | 2.4% | 0.91%(+1.46)#58 | 1.2%(+1.18)#3,414 |
| 59. | 46628 | 2.4% | 0.91%(+1.46)#59 | 1.2%(+1.18)#3,432 |
| 60. | 47470 | 2.3% | 0.91%(+1.43)#60 | 1.2%(+1.15)#3,471 |
| 61. | 46777 | 2.3% | 0.91%(+1.42)#61 | 1.2%(+1.14)#3,510 |
| 62. | 47847 | 2.3% | 0.91%(+1.40)#62 | 1.2%(+1.12)#3,560 |
| 63. | 46218 | 2.3% | 0.91%(+1.39)#63 | 1.2%(+1.11)#3,588 |
| 64. | 47220 | 2.3% | 0.91%(+1.38)#64 | 1.2%(+1.10)#3,592 |
| 65. | 46320 | 2.3% | 0.91%(+1.37)#65 | 1.2%(+1.09)#3,638 |
| 66. | 46172 | 2.3% | 0.91%(+1.35)#66 | 1.2%(+1.07)#3,685 |
| 67. | 47516 | 2.2% | 0.91%(+1.34)#67 | 1.2%(+1.06)#3,711 |
| 68. | 47598 | 2.2% | 0.91%(+1.26)#68 | 1.2%(+0.978)#3,976 |
| 69. | 46371 | 2.2% | 0.91%(+1.26)#69 | 1.2%(+0.977)#3,977 |
| 70. | 47342 | 2.1% | 0.91%(+1.22)#70 | 1.2%(+0.942)#4,072 |
| 71. | 46407 | 2.1% | 0.91%(+1.21)#71 | 1.2%(+0.935)#4,095 |
| 72. | 47060 | 2.1% | 0.91%(+1.21)#72 | 1.2%(+0.929)#4,118 |
| 73. | 46235 | 2.1% | 0.91%(+1.20)#73 | 1.2%(+0.923)#4,129 |
| 74. | 46120 | 2.1% | 0.91%(+1.19)#74 | 1.2%(+0.910)#4,162 |
| 75. | 46617 | 2.1% | 0.91%(+1.17)#75 | 1.2%(+0.887)#4,239 |
| 76. | 46974 | 2.0% | 0.91%(+1.14)#76 | 1.2%(+0.860)#4,350 |
| 77. | 46167 | 2.0% | 0.91%(+1.13)#77 | 1.2%(+0.853)#4,375 |
| 78. | 47448 | 2.0% | 0.91%(+1.12)#78 | 1.2%(+0.838)#4,422 |
| 79. | 47842 | 2.0% | 0.91%(+1.10)#79 | 1.2%(+0.817)#4,499 |
| 80. | 46516 | 2.0% | 0.91%(+1.09)#80 | 1.2%(+0.812)#4,515 |
| 81. | 47346 | 2.0% | 0.91%(+1.08)#81 | 1.2%(+0.795)#4,581 |
| 82. | 46115 | 2.0% | 0.91%(+1.07)#82 | 1.2%(+0.794)#4,590 |
| 83. | 46221 | 2.0% | 0.91%(+1.06)#83 | 1.2%(+0.778)#4,653 |
| 84. | 47118 | 2.0% | 0.91%(+1.06)#84 | 1.2%(+0.777)#4,655 |
| 85. | 46104 | 2.0% | 0.91%(+1.05)#85 | 1.2%(+0.770)#4,676 |
| 86. | 46394 | 2.0% | 0.91%(+1.05)#86 | 1.2%(+0.768)#4,688 |
| 87. | 46075 | 1.9% | 0.91%(+1.04)#87 | 1.2%(+0.758)#4,722 |
| 88. | 46941 | 1.9% | 0.91%(+1.03)#88 | 1.2%(+0.753)#4,750 |
| 89. | 46929 | 1.9% | 0.91%(+1.02)#89 | 1.2%(+0.736)#4,823 |
| 90. | 47807 | 1.9% | 0.91%(+0.997)#90 | 1.2%(+0.717)#4,911 |
| 91. | 47272 | 1.9% | 0.91%(+0.949)#91 | 1.2%(+0.669)#5,120 |
| 92. | 46574 | 1.9% | 0.91%(+0.948)#92 | 1.2%(+0.668)#5,123 |
| 93. | 46590 | 1.8% | 0.91%(+0.923)#93 | 1.2%(+0.643)#5,220 |
| 94. | 46227 | 1.8% | 0.91%(+0.922)#94 | 1.2%(+0.642)#5,223 |
| 95. | 46913 | 1.8% | 0.91%(+0.906)#95 | 1.2%(+0.626)#5,297 |
| 96. | 47037 | 1.8% | 0.91%(+0.904)#96 | 1.2%(+0.624)#5,300 |
| 97. | 46163 | 1.8% | 0.91%(+0.902)#97 | 1.2%(+0.622)#5,318 |
| 98. | 47263 | 1.8% | 0.91%(+0.896)#98 | 1.2%(+0.616)#5,354 |
| 99. | 47106 | 1.8% | 0.91%(+0.890)#99 | 1.2%(+0.610)#5,373 |
| 100. | 46147 | 1.8% | 0.91%(+0.890)#100 | 1.2%(+0.610)#5,375 |
Common Questions
What are the Top 10 Zip Codes with the Highest Percentage of Population Employed in Firefighting & Prevention in Indiana?
Top 10 Zip Codes with the Highest Percentage of Population Employed in Firefighting & Prevention in Indiana are:
What zip code has the Highest Percentage of Population Employed in Firefighting & Prevention in Indiana?
46595 has the Highest Percentage of Population Employed in Firefighting & Prevention in Indiana with 31.6%.
What is the Percentage of Population Employed in Firefighting & Prevention in the State of Indiana?
Percentage of Population Employed in Firefighting & Prevention in Indiana is 0.91%.
What is the Percentage of Population Employed in Firefighting & Prevention in the United States?
Percentage of Population Employed in Firefighting & Prevention in the United States is 1.2%.