Swiss vs Immigrants from Europe Disability Age 5 to 17
COMPARE
Swiss
Immigrants from Europe
Disability Age 5 to 17
Disability Age 5 to 17 Comparison
Swiss
Immigrants from Europe
5.8%
DISABILITY AGE 5 TO 17
5.1/ 100
METRIC RATING
227th/ 347
METRIC RANK
5.3%
DISABILITY AGE 5 TO 17
99.0/ 100
METRIC RATING
97th/ 347
METRIC RANK
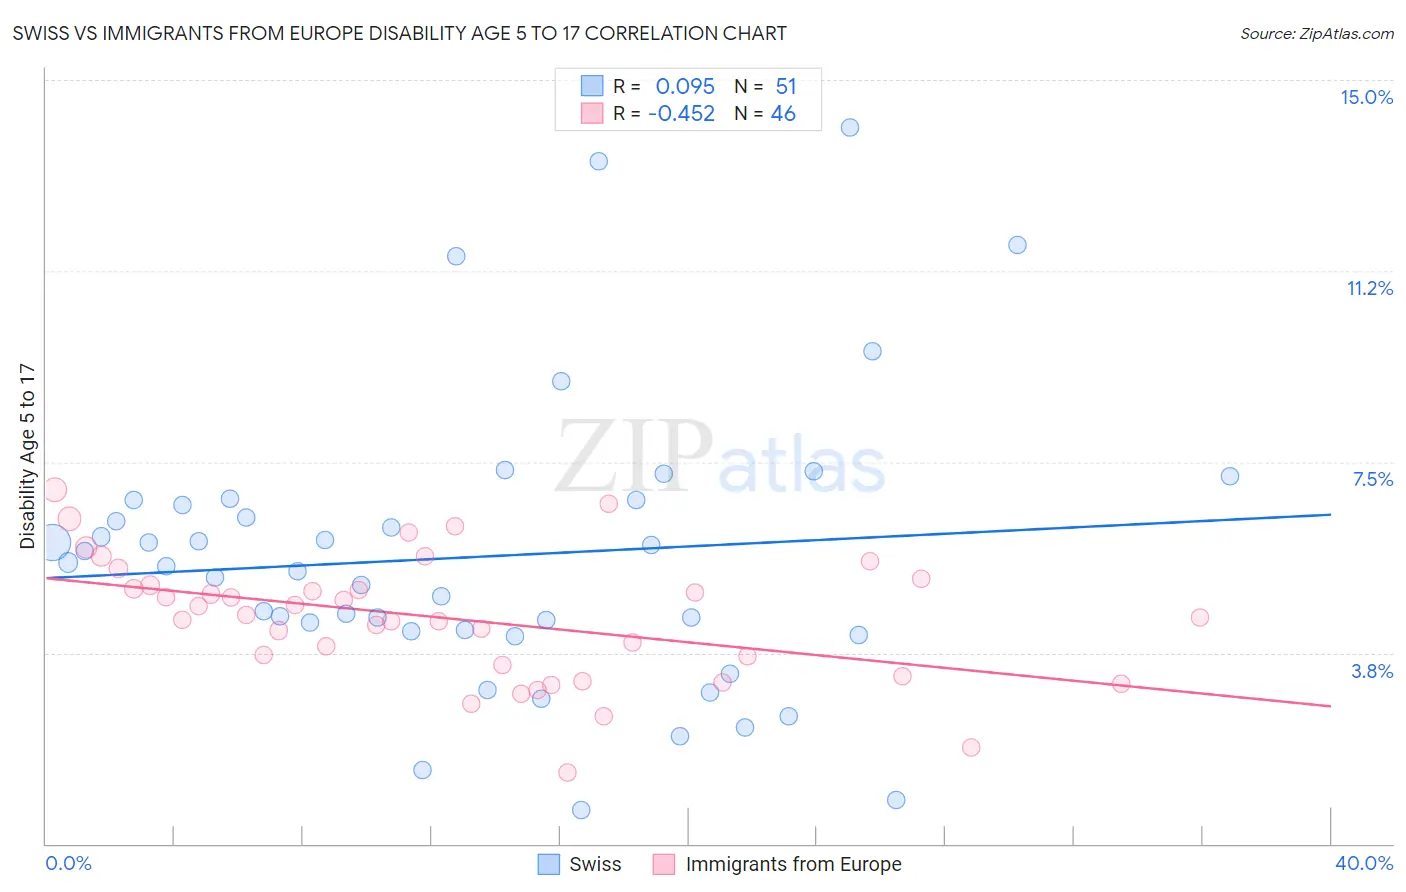
Swiss vs Immigrants from Europe Disability Age 5 to 17 Correlation Chart
The statistical analysis conducted on geographies consisting of 458,460,312 people shows a slight positive correlation between the proportion of Swiss and percentage of population with a disability between the ages 5 and 17 in the United States with a correlation coefficient (R) of 0.095 and weighted average of 5.8%. Similarly, the statistical analysis conducted on geographies consisting of 537,005,958 people shows a moderate negative correlation between the proportion of Immigrants from Europe and percentage of population with a disability between the ages 5 and 17 in the United States with a correlation coefficient (R) of -0.452 and weighted average of 5.3%, a difference of 9.8%.
Disability Age 5 to 17 Correlation Summary
| Measurement | Swiss | Immigrants from Europe |
| Minimum | 0.66% | 1.4% |
| Maximum | 14.1% | 6.9% |
| Range | 13.4% | 5.5% |
| Mean | 5.6% | 4.4% |
| Median | 5.4% | 4.5% |
| Interquartile 25% (IQ1) | 4.2% | 3.5% |
| Interquartile 75% (IQ3) | 6.7% | 5.1% |
| Interquartile Range (IQR) | 2.6% | 1.6% |
| Standard Deviation (Sample) | 2.8% | 1.2% |
| Standard Deviation (Population) | 2.8% | 1.2% |
Similar Demographics by Disability Age 5 to 17
Demographics Similar to Swiss by Disability Age 5 to 17
In terms of disability age 5 to 17, the demographic groups most similar to Swiss are British West Indian (5.8%, a difference of 0.080%), Haitian (5.8%, a difference of 0.080%), Bangladeshi (5.8%, a difference of 0.090%), Ghanaian (5.8%, a difference of 0.10%), and Guamanian/Chamorro (5.8%, a difference of 0.12%).
| Demographics | Rating | Rank | Disability Age 5 to 17 |
| Belgians | 6.9 /100 | #220 | Tragic 5.8% |
| Lithuanians | 6.7 /100 | #221 | Tragic 5.8% |
| Immigrants | Sudan | 6.7 /100 | #222 | Tragic 5.8% |
| Alsatians | 6.0 /100 | #223 | Tragic 5.8% |
| Mexicans | 5.7 /100 | #224 | Tragic 5.8% |
| Guamanians/Chamorros | 5.6 /100 | #225 | Tragic 5.8% |
| British West Indians | 5.4 /100 | #226 | Tragic 5.8% |
| Swiss | 5.1 /100 | #227 | Tragic 5.8% |
| Haitians | 4.8 /100 | #228 | Tragic 5.8% |
| Bangladeshis | 4.8 /100 | #229 | Tragic 5.8% |
| Ghanaians | 4.7 /100 | #230 | Tragic 5.8% |
| Europeans | 4.5 /100 | #231 | Tragic 5.8% |
| Immigrants | Laos | 3.8 /100 | #232 | Tragic 5.8% |
| Immigrants | West Indies | 3.5 /100 | #233 | Tragic 5.8% |
| Immigrants | Kenya | 3.4 /100 | #234 | Tragic 5.8% |
Demographics Similar to Immigrants from Europe by Disability Age 5 to 17
In terms of disability age 5 to 17, the demographic groups most similar to Immigrants from Europe are Immigrants from El Salvador (5.3%, a difference of 0.0%), Immigrants from Austria (5.3%, a difference of 0.050%), Cambodian (5.3%, a difference of 0.15%), Immigrants from Grenada (5.3%, a difference of 0.16%), and Immigrants from Jordan (5.3%, a difference of 0.18%).
| Demographics | Rating | Rank | Disability Age 5 to 17 |
| Immigrants | Kuwait | 99.4 /100 | #90 | Exceptional 5.3% |
| Mongolians | 99.2 /100 | #91 | Exceptional 5.3% |
| Luxembourgers | 99.2 /100 | #92 | Exceptional 5.3% |
| Immigrants | Peru | 99.1 /100 | #93 | Exceptional 5.3% |
| Immigrants | Jordan | 99.1 /100 | #94 | Exceptional 5.3% |
| Immigrants | Grenada | 99.1 /100 | #95 | Exceptional 5.3% |
| Immigrants | El Salvador | 99.0 /100 | #96 | Exceptional 5.3% |
| Immigrants | Europe | 99.0 /100 | #97 | Exceptional 5.3% |
| Immigrants | Austria | 98.9 /100 | #98 | Exceptional 5.3% |
| Cambodians | 98.8 /100 | #99 | Exceptional 5.3% |
| Nepalese | 98.7 /100 | #100 | Exceptional 5.3% |
| Menominee | 98.7 /100 | #101 | Exceptional 5.3% |
| Nicaraguans | 98.6 /100 | #102 | Exceptional 5.3% |
| Salvadorans | 98.6 /100 | #103 | Exceptional 5.3% |
| Peruvians | 98.5 /100 | #104 | Exceptional 5.3% |