Samoan vs Immigrants from Zimbabwe Disability Age 5 to 17
COMPARE
Samoan
Immigrants from Zimbabwe
Disability Age 5 to 17
Disability Age 5 to 17 Comparison
Samoans
Immigrants from Zimbabwe
5.5%
DISABILITY AGE 5 TO 17
81.9/ 100
METRIC RATING
148th/ 347
METRIC RANK
5.5%
DISABILITY AGE 5 TO 17
75.3/ 100
METRIC RATING
159th/ 347
METRIC RANK
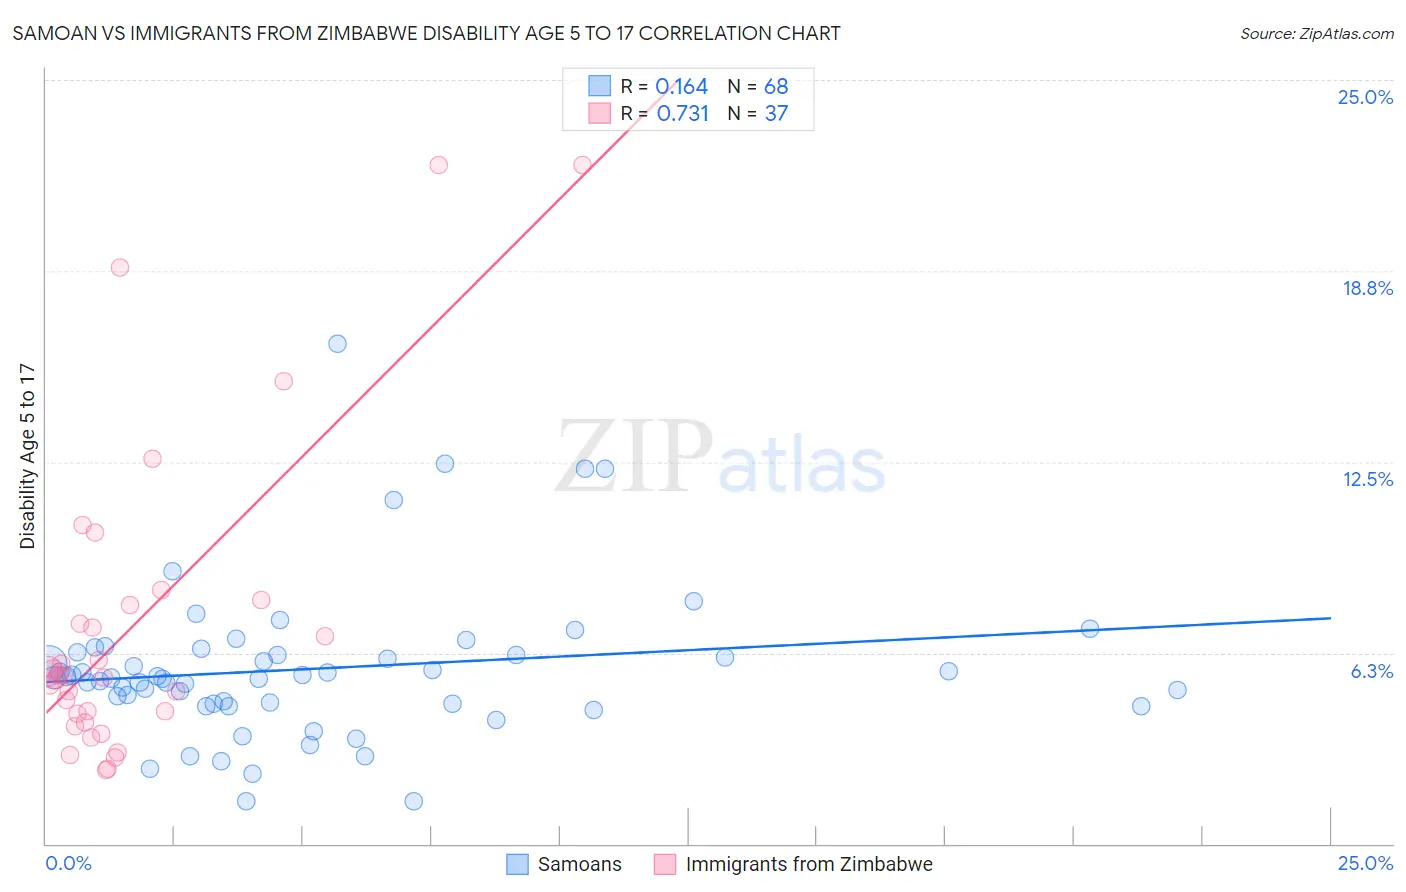
Samoan vs Immigrants from Zimbabwe Disability Age 5 to 17 Correlation Chart
The statistical analysis conducted on geographies consisting of 224,375,903 people shows a poor positive correlation between the proportion of Samoans and percentage of population with a disability between the ages 5 and 17 in the United States with a correlation coefficient (R) of 0.164 and weighted average of 5.5%. Similarly, the statistical analysis conducted on geographies consisting of 117,554,818 people shows a strong positive correlation between the proportion of Immigrants from Zimbabwe and percentage of population with a disability between the ages 5 and 17 in the United States with a correlation coefficient (R) of 0.731 and weighted average of 5.5%, a difference of 0.50%.
Disability Age 5 to 17 Correlation Summary
| Measurement | Samoan | Immigrants from Zimbabwe |
| Minimum | 1.4% | 2.4% |
| Maximum | 16.4% | 22.2% |
| Range | 15.0% | 19.8% |
| Mean | 5.7% | 7.1% |
| Median | 5.4% | 5.5% |
| Interquartile 25% (IQ1) | 4.6% | 4.1% |
| Interquartile 75% (IQ3) | 6.2% | 7.9% |
| Interquartile Range (IQR) | 1.6% | 3.8% |
| Standard Deviation (Sample) | 2.5% | 5.0% |
| Standard Deviation (Population) | 2.5% | 5.0% |
Demographics Similar to Samoans and Immigrants from Zimbabwe by Disability Age 5 to 17
In terms of disability age 5 to 17, the demographic groups most similar to Samoans are Central American (5.5%, a difference of 0.030%), Guatemalan (5.5%, a difference of 0.030%), Immigrants from Albania (5.5%, a difference of 0.10%), Estonian (5.5%, a difference of 0.10%), and Ute (5.5%, a difference of 0.11%). Similarly, the demographic groups most similar to Immigrants from Zimbabwe are Immigrants from Nepal (5.5%, a difference of 0.13%), South African (5.5%, a difference of 0.13%), Immigrants from Costa Rica (5.5%, a difference of 0.18%), Hawaiian (5.5%, a difference of 0.19%), and Immigrants from Ecuador (5.5%, a difference of 0.21%).
| Demographics | Rating | Rank | Disability Age 5 to 17 |
| Immigrants | Hungary | 87.9 /100 | #143 | Excellent 5.5% |
| Pakistanis | 87.3 /100 | #144 | Excellent 5.5% |
| Immigrants | Guatemala | 86.6 /100 | #145 | Excellent 5.5% |
| Albanians | 83.7 /100 | #146 | Excellent 5.5% |
| Immigrants | Albania | 83.1 /100 | #147 | Excellent 5.5% |
| Samoans | 81.9 /100 | #148 | Excellent 5.5% |
| Central Americans | 81.6 /100 | #149 | Excellent 5.5% |
| Guatemalans | 81.5 /100 | #150 | Excellent 5.5% |
| Estonians | 80.8 /100 | #151 | Excellent 5.5% |
| Ute | 80.6 /100 | #152 | Excellent 5.5% |
| Ecuadorians | 79.7 /100 | #153 | Good 5.5% |
| Australians | 78.8 /100 | #154 | Good 5.5% |
| Immigrants | Ecuador | 78.3 /100 | #155 | Good 5.5% |
| Hawaiians | 78.0 /100 | #156 | Good 5.5% |
| Immigrants | Costa Rica | 77.9 /100 | #157 | Good 5.5% |
| Immigrants | Nepal | 77.1 /100 | #158 | Good 5.5% |
| Immigrants | Zimbabwe | 75.3 /100 | #159 | Good 5.5% |
| South Africans | 73.3 /100 | #160 | Good 5.5% |
| Immigrants | Saudi Arabia | 69.1 /100 | #161 | Good 5.5% |
| Zimbabweans | 67.2 /100 | #162 | Good 5.5% |
| Immigrants | Southern Europe | 64.0 /100 | #163 | Good 5.6% |