Samoan vs Yakama Disability Age 5 to 17
COMPARE
Samoan
Yakama
Disability Age 5 to 17
Disability Age 5 to 17 Comparison
Samoans
Yakama
5.5%
DISABILITY AGE 5 TO 17
81.9/ 100
METRIC RATING
148th/ 347
METRIC RANK
6.3%
DISABILITY AGE 5 TO 17
0.0/ 100
METRIC RATING
303rd/ 347
METRIC RANK
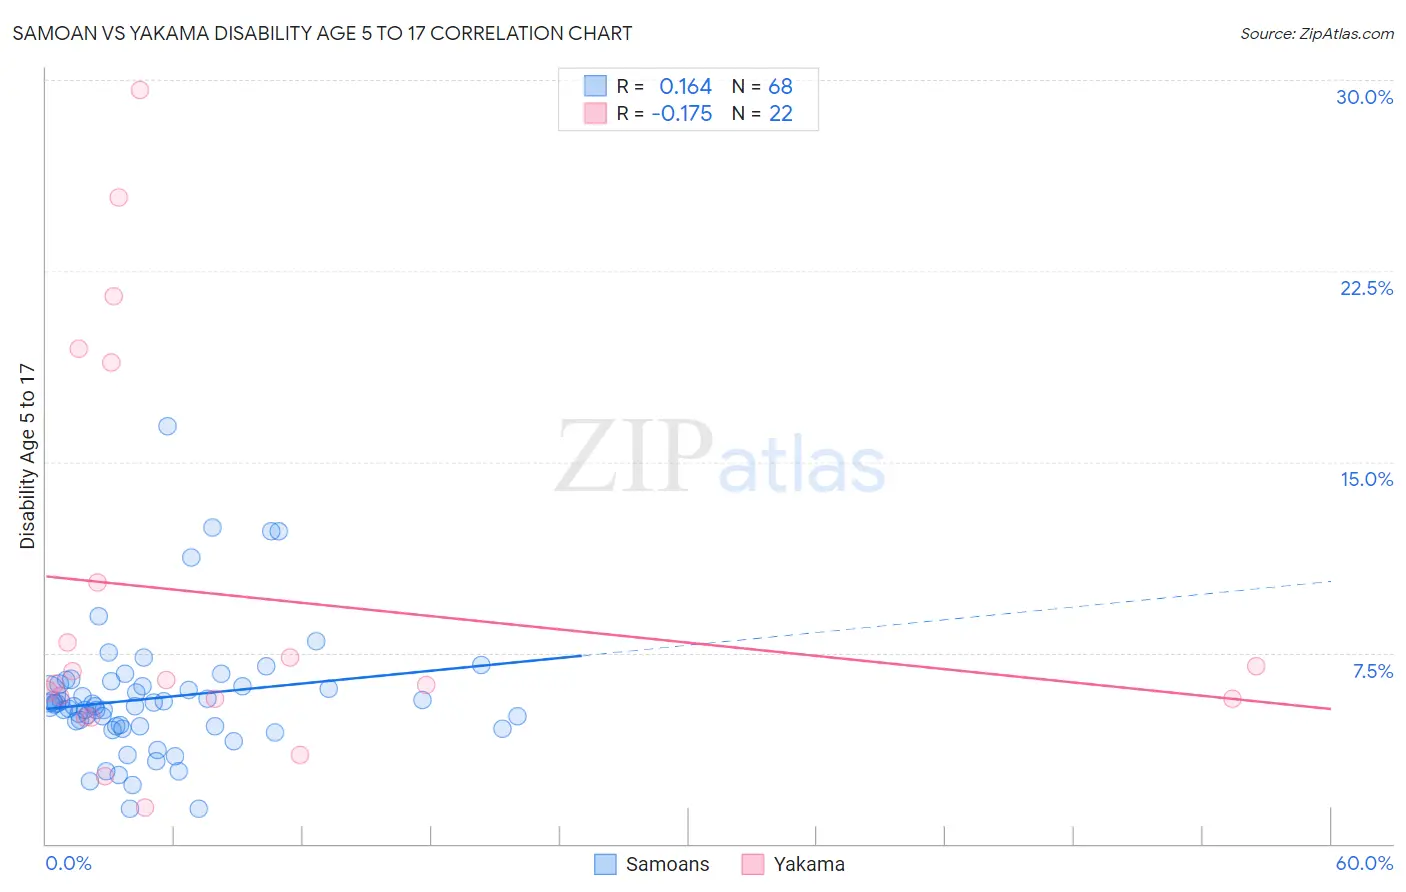
Samoan vs Yakama Disability Age 5 to 17 Correlation Chart
The statistical analysis conducted on geographies consisting of 224,375,903 people shows a poor positive correlation between the proportion of Samoans and percentage of population with a disability between the ages 5 and 17 in the United States with a correlation coefficient (R) of 0.164 and weighted average of 5.5%. Similarly, the statistical analysis conducted on geographies consisting of 19,874,624 people shows a poor negative correlation between the proportion of Yakama and percentage of population with a disability between the ages 5 and 17 in the United States with a correlation coefficient (R) of -0.175 and weighted average of 6.3%, a difference of 14.5%.
Disability Age 5 to 17 Correlation Summary
| Measurement | Samoan | Yakama |
| Minimum | 1.4% | 1.4% |
| Maximum | 16.4% | 29.6% |
| Range | 15.0% | 28.2% |
| Mean | 5.7% | 9.7% |
| Median | 5.4% | 6.4% |
| Interquartile 25% (IQ1) | 4.6% | 5.7% |
| Interquartile 75% (IQ3) | 6.2% | 10.3% |
| Interquartile Range (IQR) | 1.6% | 4.6% |
| Standard Deviation (Sample) | 2.5% | 7.8% |
| Standard Deviation (Population) | 2.5% | 7.6% |
Similar Demographics by Disability Age 5 to 17
Demographics Similar to Samoans by Disability Age 5 to 17
In terms of disability age 5 to 17, the demographic groups most similar to Samoans are Central American (5.5%, a difference of 0.030%), Guatemalan (5.5%, a difference of 0.030%), Immigrants from Albania (5.5%, a difference of 0.10%), Estonian (5.5%, a difference of 0.10%), and Ute (5.5%, a difference of 0.11%).
| Demographics | Rating | Rank | Disability Age 5 to 17 |
| South American Indians | 89.3 /100 | #141 | Excellent 5.5% |
| Colombians | 88.0 /100 | #142 | Excellent 5.5% |
| Immigrants | Hungary | 87.9 /100 | #143 | Excellent 5.5% |
| Pakistanis | 87.3 /100 | #144 | Excellent 5.5% |
| Immigrants | Guatemala | 86.6 /100 | #145 | Excellent 5.5% |
| Albanians | 83.7 /100 | #146 | Excellent 5.5% |
| Immigrants | Albania | 83.1 /100 | #147 | Excellent 5.5% |
| Samoans | 81.9 /100 | #148 | Excellent 5.5% |
| Central Americans | 81.6 /100 | #149 | Excellent 5.5% |
| Guatemalans | 81.5 /100 | #150 | Excellent 5.5% |
| Estonians | 80.8 /100 | #151 | Excellent 5.5% |
| Ute | 80.6 /100 | #152 | Excellent 5.5% |
| Ecuadorians | 79.7 /100 | #153 | Good 5.5% |
| Australians | 78.8 /100 | #154 | Good 5.5% |
| Immigrants | Ecuador | 78.3 /100 | #155 | Good 5.5% |
Demographics Similar to Yakama by Disability Age 5 to 17
In terms of disability age 5 to 17, the demographic groups most similar to Yakama are Senegalese (6.3%, a difference of 0.080%), Celtic (6.3%, a difference of 0.10%), Native/Alaskan (6.3%, a difference of 0.22%), Nonimmigrants (6.3%, a difference of 0.32%), and U.S. Virgin Islander (6.3%, a difference of 0.43%).
| Demographics | Rating | Rank | Disability Age 5 to 17 |
| Spanish Americans | 0.0 /100 | #296 | Tragic 6.2% |
| Immigrants | Bahamas | 0.0 /100 | #297 | Tragic 6.2% |
| Lumbee | 0.0 /100 | #298 | Tragic 6.2% |
| Welsh | 0.0 /100 | #299 | Tragic 6.3% |
| Carpatho Rusyns | 0.0 /100 | #300 | Tragic 6.3% |
| U.S. Virgin Islanders | 0.0 /100 | #301 | Tragic 6.3% |
| Celtics | 0.0 /100 | #302 | Tragic 6.3% |
| Yakama | 0.0 /100 | #303 | Tragic 6.3% |
| Senegalese | 0.0 /100 | #304 | Tragic 6.3% |
| Natives/Alaskans | 0.0 /100 | #305 | Tragic 6.3% |
| Immigrants | Nonimmigrants | 0.0 /100 | #306 | Tragic 6.3% |
| Bahamians | 0.0 /100 | #307 | Tragic 6.3% |
| Scotch-Irish | 0.0 /100 | #308 | Tragic 6.3% |
| Hmong | 0.0 /100 | #309 | Tragic 6.3% |
| Alaskan Athabascans | 0.0 /100 | #310 | Tragic 6.3% |