Samoan vs Hispanic or Latino Disability Age 5 to 17
COMPARE
Samoan
Hispanic or Latino
Disability Age 5 to 17
Disability Age 5 to 17 Comparison
Samoans
Hispanics or Latinos
5.5%
DISABILITY AGE 5 TO 17
81.9/ 100
METRIC RATING
148th/ 347
METRIC RANK
5.9%
DISABILITY AGE 5 TO 17
1.0/ 100
METRIC RATING
257th/ 347
METRIC RANK
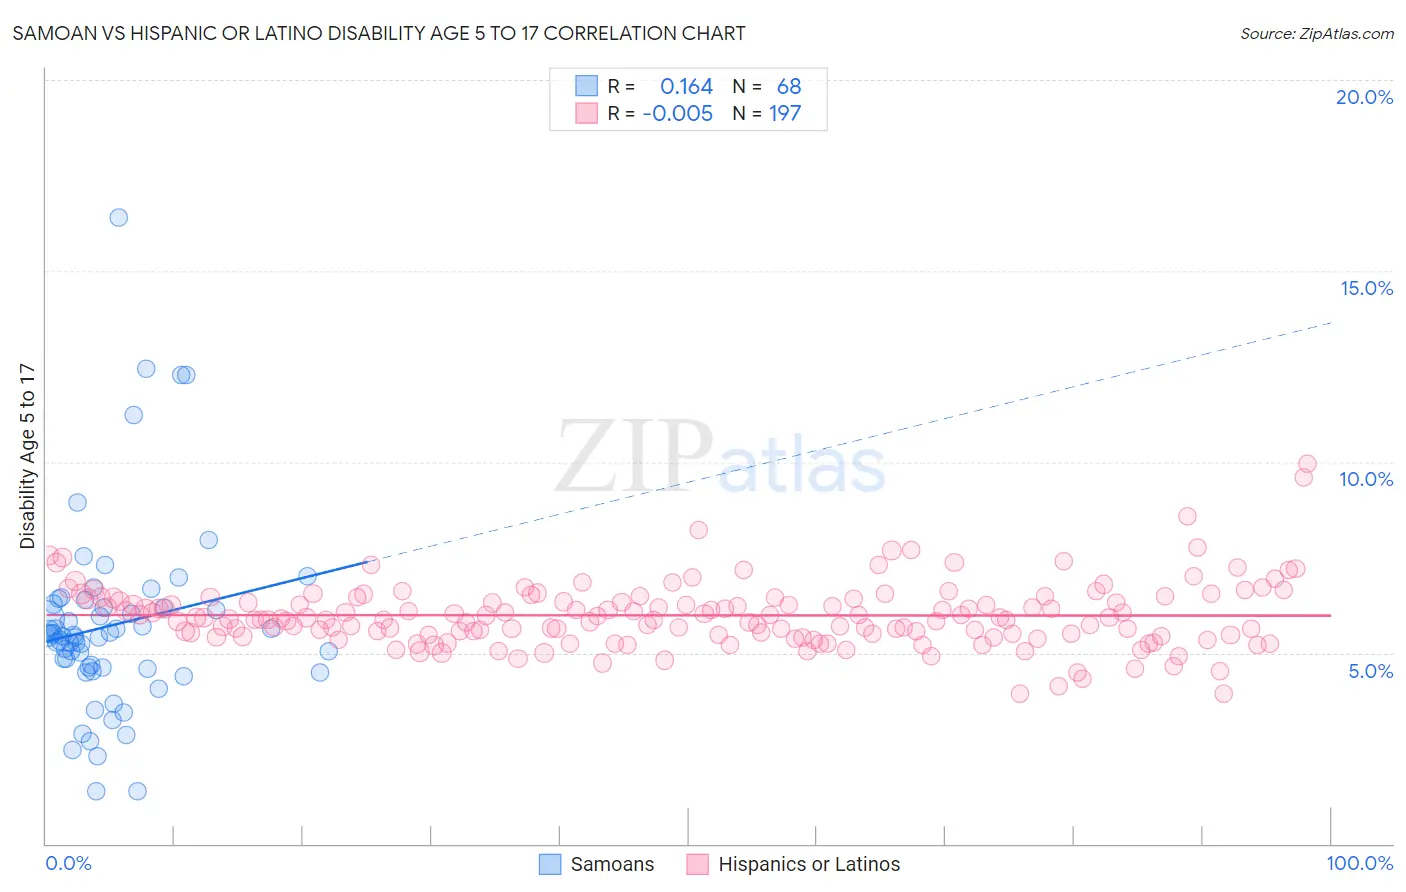
Samoan vs Hispanic or Latino Disability Age 5 to 17 Correlation Chart
The statistical analysis conducted on geographies consisting of 224,375,903 people shows a poor positive correlation between the proportion of Samoans and percentage of population with a disability between the ages 5 and 17 in the United States with a correlation coefficient (R) of 0.164 and weighted average of 5.5%. Similarly, the statistical analysis conducted on geographies consisting of 559,956,499 people shows no correlation between the proportion of Hispanics or Latinos and percentage of population with a disability between the ages 5 and 17 in the United States with a correlation coefficient (R) of -0.005 and weighted average of 5.9%, a difference of 7.7%.
Disability Age 5 to 17 Correlation Summary
| Measurement | Samoan | Hispanic or Latino |
| Minimum | 1.4% | 3.9% |
| Maximum | 16.4% | 9.9% |
| Range | 15.0% | 6.0% |
| Mean | 5.7% | 6.0% |
| Median | 5.4% | 5.9% |
| Interquartile 25% (IQ1) | 4.6% | 5.5% |
| Interquartile 75% (IQ3) | 6.2% | 6.4% |
| Interquartile Range (IQR) | 1.6% | 0.96% |
| Standard Deviation (Sample) | 2.5% | 0.85% |
| Standard Deviation (Population) | 2.5% | 0.84% |
Similar Demographics by Disability Age 5 to 17
Demographics Similar to Samoans by Disability Age 5 to 17
In terms of disability age 5 to 17, the demographic groups most similar to Samoans are Central American (5.5%, a difference of 0.030%), Guatemalan (5.5%, a difference of 0.030%), Immigrants from Albania (5.5%, a difference of 0.10%), Estonian (5.5%, a difference of 0.10%), and Ute (5.5%, a difference of 0.11%).
| Demographics | Rating | Rank | Disability Age 5 to 17 |
| South American Indians | 89.3 /100 | #141 | Excellent 5.5% |
| Colombians | 88.0 /100 | #142 | Excellent 5.5% |
| Immigrants | Hungary | 87.9 /100 | #143 | Excellent 5.5% |
| Pakistanis | 87.3 /100 | #144 | Excellent 5.5% |
| Immigrants | Guatemala | 86.6 /100 | #145 | Excellent 5.5% |
| Albanians | 83.7 /100 | #146 | Excellent 5.5% |
| Immigrants | Albania | 83.1 /100 | #147 | Excellent 5.5% |
| Samoans | 81.9 /100 | #148 | Excellent 5.5% |
| Central Americans | 81.6 /100 | #149 | Excellent 5.5% |
| Guatemalans | 81.5 /100 | #150 | Excellent 5.5% |
| Estonians | 80.8 /100 | #151 | Excellent 5.5% |
| Ute | 80.6 /100 | #152 | Excellent 5.5% |
| Ecuadorians | 79.7 /100 | #153 | Good 5.5% |
| Australians | 78.8 /100 | #154 | Good 5.5% |
| Immigrants | Ecuador | 78.3 /100 | #155 | Good 5.5% |
Demographics Similar to Hispanics or Latinos by Disability Age 5 to 17
In terms of disability age 5 to 17, the demographic groups most similar to Hispanics or Latinos are Brazilian (5.9%, a difference of 0.040%), Hopi (5.9%, a difference of 0.090%), Slavic (5.9%, a difference of 0.090%), Somali (5.9%, a difference of 0.22%), and Italian (5.9%, a difference of 0.28%).
| Demographics | Rating | Rank | Disability Age 5 to 17 |
| Poles | 1.5 /100 | #250 | Tragic 5.9% |
| Immigrants | Cambodia | 1.5 /100 | #251 | Tragic 5.9% |
| Hondurans | 1.5 /100 | #252 | Tragic 5.9% |
| Scandinavians | 1.4 /100 | #253 | Tragic 5.9% |
| Barbadians | 1.3 /100 | #254 | Tragic 5.9% |
| Italians | 1.2 /100 | #255 | Tragic 5.9% |
| Hopi | 1.0 /100 | #256 | Tragic 5.9% |
| Hispanics or Latinos | 1.0 /100 | #257 | Tragic 5.9% |
| Brazilians | 0.9 /100 | #258 | Tragic 5.9% |
| Slavs | 0.9 /100 | #259 | Tragic 5.9% |
| Somalis | 0.8 /100 | #260 | Tragic 5.9% |
| Immigrants | Middle Africa | 0.7 /100 | #261 | Tragic 5.9% |
| Immigrants | Western Africa | 0.7 /100 | #262 | Tragic 5.9% |
| Czechoslovakians | 0.7 /100 | #263 | Tragic 5.9% |
| Canadians | 0.6 /100 | #264 | Tragic 6.0% |