Samoan vs Assyrian/Chaldean/Syriac Disability Age 5 to 17
COMPARE
Samoan
Assyrian/Chaldean/Syriac
Disability Age 5 to 17
Disability Age 5 to 17 Comparison
Samoans
Assyrians/Chaldeans/Syriacs
5.5%
DISABILITY AGE 5 TO 17
81.9/ 100
METRIC RATING
148th/ 347
METRIC RANK
5.0%
DISABILITY AGE 5 TO 17
100.0/ 100
METRIC RATING
46th/ 347
METRIC RANK
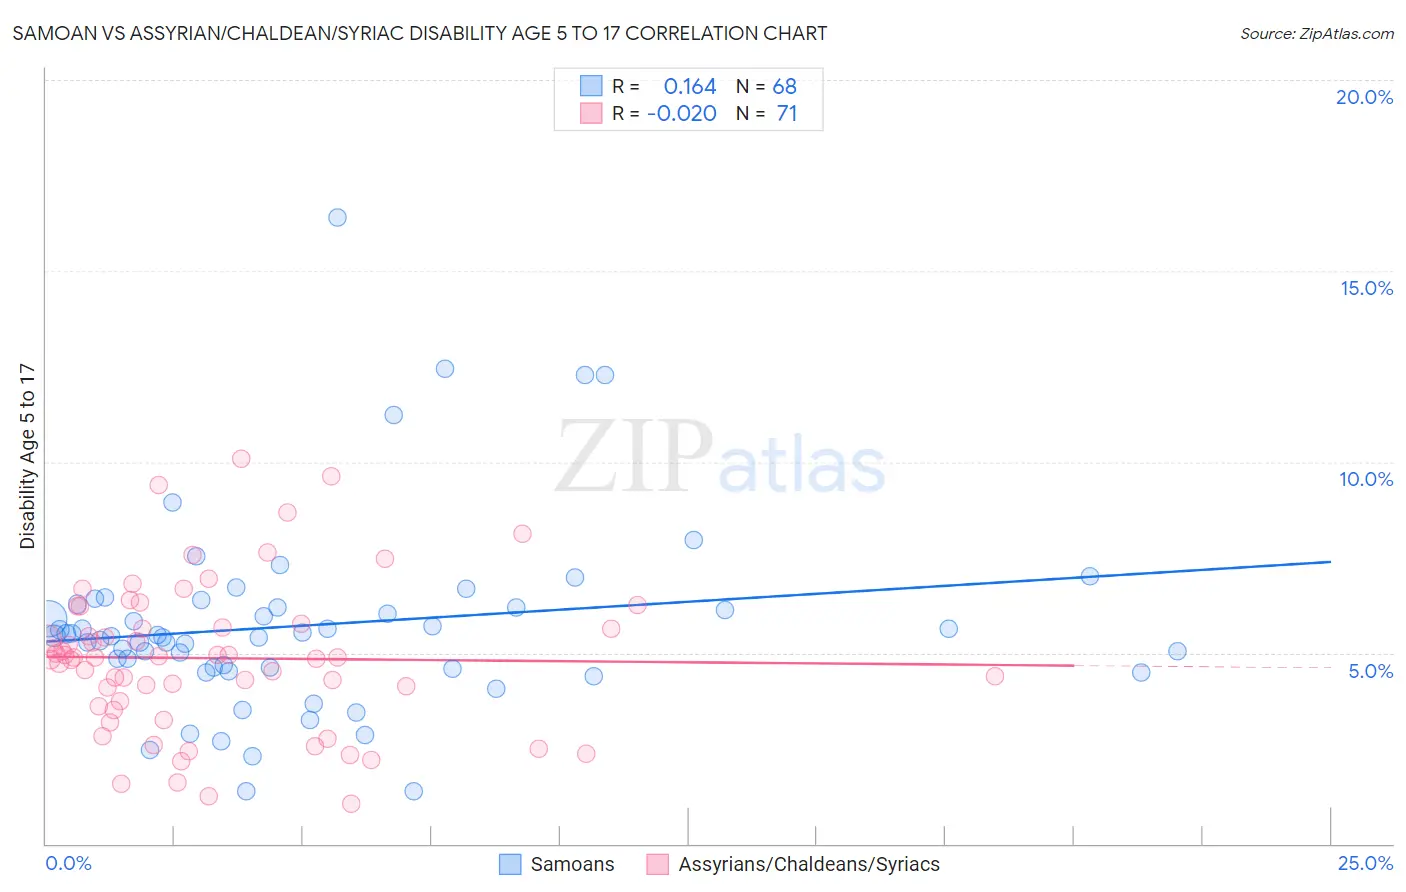
Samoan vs Assyrian/Chaldean/Syriac Disability Age 5 to 17 Correlation Chart
The statistical analysis conducted on geographies consisting of 224,375,903 people shows a poor positive correlation between the proportion of Samoans and percentage of population with a disability between the ages 5 and 17 in the United States with a correlation coefficient (R) of 0.164 and weighted average of 5.5%. Similarly, the statistical analysis conducted on geographies consisting of 110,004,122 people shows no correlation between the proportion of Assyrians/Chaldeans/Syriacs and percentage of population with a disability between the ages 5 and 17 in the United States with a correlation coefficient (R) of -0.020 and weighted average of 5.0%, a difference of 8.9%.
Disability Age 5 to 17 Correlation Summary
| Measurement | Samoan | Assyrian/Chaldean/Syriac |
| Minimum | 1.4% | 1.0% |
| Maximum | 16.4% | 10.1% |
| Range | 15.0% | 9.0% |
| Mean | 5.7% | 4.9% |
| Median | 5.4% | 4.9% |
| Interquartile 25% (IQ1) | 4.6% | 3.6% |
| Interquartile 75% (IQ3) | 6.2% | 5.8% |
| Interquartile Range (IQR) | 1.6% | 2.2% |
| Standard Deviation (Sample) | 2.5% | 2.0% |
| Standard Deviation (Population) | 2.5% | 1.9% |
Similar Demographics by Disability Age 5 to 17
Demographics Similar to Samoans by Disability Age 5 to 17
In terms of disability age 5 to 17, the demographic groups most similar to Samoans are Central American (5.5%, a difference of 0.030%), Guatemalan (5.5%, a difference of 0.030%), Immigrants from Albania (5.5%, a difference of 0.10%), Estonian (5.5%, a difference of 0.10%), and Ute (5.5%, a difference of 0.11%).
| Demographics | Rating | Rank | Disability Age 5 to 17 |
| South American Indians | 89.3 /100 | #141 | Excellent 5.5% |
| Colombians | 88.0 /100 | #142 | Excellent 5.5% |
| Immigrants | Hungary | 87.9 /100 | #143 | Excellent 5.5% |
| Pakistanis | 87.3 /100 | #144 | Excellent 5.5% |
| Immigrants | Guatemala | 86.6 /100 | #145 | Excellent 5.5% |
| Albanians | 83.7 /100 | #146 | Excellent 5.5% |
| Immigrants | Albania | 83.1 /100 | #147 | Excellent 5.5% |
| Samoans | 81.9 /100 | #148 | Excellent 5.5% |
| Central Americans | 81.6 /100 | #149 | Excellent 5.5% |
| Guatemalans | 81.5 /100 | #150 | Excellent 5.5% |
| Estonians | 80.8 /100 | #151 | Excellent 5.5% |
| Ute | 80.6 /100 | #152 | Excellent 5.5% |
| Ecuadorians | 79.7 /100 | #153 | Good 5.5% |
| Australians | 78.8 /100 | #154 | Good 5.5% |
| Immigrants | Ecuador | 78.3 /100 | #155 | Good 5.5% |
Demographics Similar to Assyrians/Chaldeans/Syriacs by Disability Age 5 to 17
In terms of disability age 5 to 17, the demographic groups most similar to Assyrians/Chaldeans/Syriacs are Tongan (5.0%, a difference of 0.070%), Vietnamese (5.1%, a difference of 0.13%), Egyptian (5.0%, a difference of 0.14%), Immigrants from Russia (5.0%, a difference of 0.18%), and Korean (5.1%, a difference of 0.31%).
| Demographics | Rating | Rank | Disability Age 5 to 17 |
| Immigrants | Argentina | 100.0 /100 | #39 | Exceptional 5.0% |
| Okinawans | 100.0 /100 | #40 | Exceptional 5.0% |
| Immigrants | Australia | 100.0 /100 | #41 | Exceptional 5.0% |
| Immigrants | Sri Lanka | 100.0 /100 | #42 | Exceptional 5.0% |
| Immigrants | Russia | 100.0 /100 | #43 | Exceptional 5.0% |
| Egyptians | 100.0 /100 | #44 | Exceptional 5.0% |
| Tongans | 100.0 /100 | #45 | Exceptional 5.0% |
| Assyrians/Chaldeans/Syriacs | 100.0 /100 | #46 | Exceptional 5.0% |
| Vietnamese | 100.0 /100 | #47 | Exceptional 5.1% |
| Koreans | 100.0 /100 | #48 | Exceptional 5.1% |
| Immigrants | Western Asia | 100.0 /100 | #49 | Exceptional 5.1% |
| Argentineans | 99.9 /100 | #50 | Exceptional 5.1% |
| Turks | 99.9 /100 | #51 | Exceptional 5.1% |
| Immigrants | Fiji | 99.9 /100 | #52 | Exceptional 5.1% |
| Immigrants | Lithuania | 99.9 /100 | #53 | Exceptional 5.1% |