Romanian 4 or more Vehicles in Household
COMPARE
Romanian
Select to Compare
4 or more Vehicles in Household
Romanian 4 or more Vehicles in Household
6.2%
4+ VEHICLES AVAILABLE
30.7/ 100
METRIC RATING
192nd/ 347
METRIC RANK
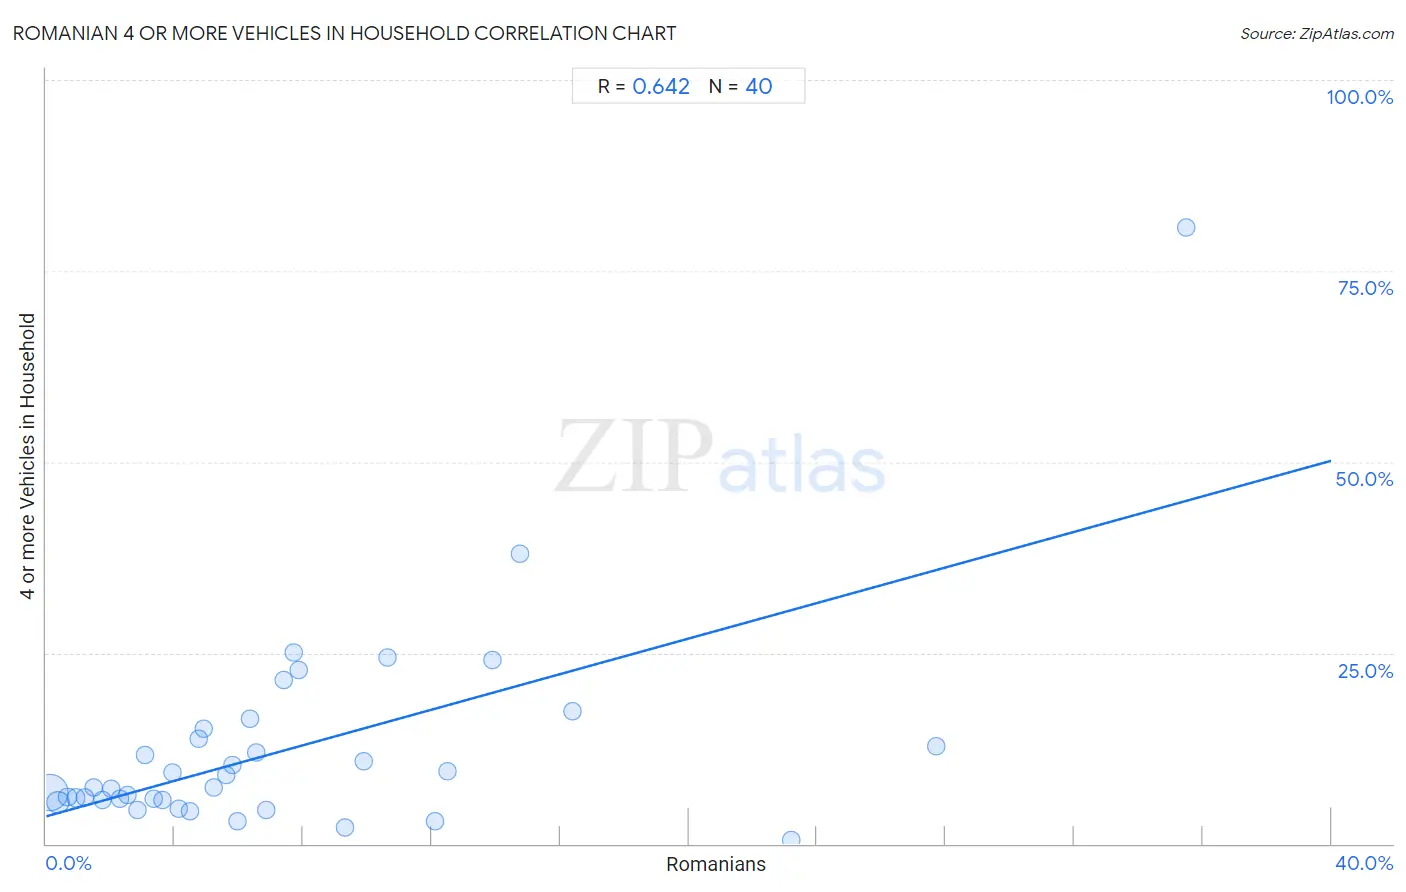
Romanian 4 or more Vehicles in Household Correlation Chart
The statistical analysis conducted on geographies consisting of 376,299,179 people shows a significant positive correlation between the proportion of Romanians and percentage of households with 4 or more vehicles available in the United States with a correlation coefficient (R) of 0.642 and weighted average of 6.2%. On average, for every 1% (one percent) increase in Romanians within a typical geography, there is an increase of 1.2% in percentage of households with 4 or more vehicles available.
It is essential to understand that the correlation between the percentage of Romanians and percentage of households with 4 or more vehicles available does not imply a direct cause-and-effect relationship. It remains uncertain whether the presence of Romanians influences an upward or downward trend in the level of percentage of households with 4 or more vehicles available within an area, or if Romanians simply ended up residing in those areas with higher or lower levels of percentage of households with 4 or more vehicles available due to other factors.
Demographics Similar to Romanians by 4 or more Vehicles in Household
In terms of 4 or more vehicles in household, the demographic groups most similar to Romanians are Inupiat (6.2%, a difference of 0.010%), South African (6.2%, a difference of 0.19%), Immigrants from Eastern Asia (6.2%, a difference of 0.31%), Immigrants from Kuwait (6.2%, a difference of 0.34%), and Immigrants from Sweden (6.2%, a difference of 0.47%).
| Demographics | Rating | Rank | 4 or more Vehicles in Household |
| Thais | 36.9 /100 | #185 | Fair 6.2% |
| Immigrants from Northern Europe | 36.8 /100 | #186 | Fair 6.2% |
| Immigrants from South Africa | 35.4 /100 | #187 | Fair 6.2% |
| Kiowa | 34.7 /100 | #188 | Fair 6.2% |
| Immigrants from Eastern Asia | 33.3 /100 | #189 | Fair 6.2% |
| South Africans | 32.2 /100 | #190 | Fair 6.2% |
| Inupiat | 30.7 /100 | #191 | Fair 6.2% |
| Romanians | 30.7 /100 | #192 | Fair 6.2% |
| Immigrants from Kuwait | 28.0 /100 | #193 | Fair 6.2% |
| Immigrants from Sweden | 27.0 /100 | #194 | Fair 6.2% |
| Argentineans | 27.0 /100 | #195 | Fair 6.2% |
| Tsimshian | 26.4 /100 | #196 | Fair 6.2% |
| Immigrants from Sri Lanka | 23.7 /100 | #197 | Fair 6.1% |
| Immigrants from Portugal | 22.3 /100 | #198 | Fair 6.1% |
| Immigrants from Norway | 21.8 /100 | #199 | Fair 6.1% |
Romanian 4 or more Vehicles in Household Correlation Summary
| Measurement | Romanian Data | 4 or more Vehicles in Household Data |
| Minimum | 0.10% | 0.45% |
| Maximum | 35.5% | 80.8% |
| Range | 35.4% | 80.3% |
| Mean | 7.5% | 12.3% |
| Median | 5.4% | 7.4% |
| Interquartile 25% (IQ1) | 2.7% | 5.8% |
| Interquartile 75% (IQ3) | 9.6% | 14.4% |
| Interquartile Range (IQR) | 6.9% | 8.6% |
| Standard Deviation (Sample) | 7.5% | 13.6% |
| Standard Deviation (Population) | 7.4% | 13.4% |
Correlation Details
| Romanian Percentile | Sample Size | 4 or more Vehicles in Household |
[ 0.0% - 0.5% ] 0.10% | 283,945,412 | 6.7% |
[ 0.0% - 0.5% ] 0.36% | 62,376,127 | 5.5% |
[ 0.5% - 1.0% ] 0.66% | 15,362,589 | 6.1% |
[ 0.5% - 1.0% ] 0.93% | 7,206,098 | 6.0% |
[ 1.0% - 1.5% ] 1.19% | 3,332,105 | 6.0% |
[ 1.0% - 1.5% ] 1.46% | 1,389,373 | 7.4% |
[ 1.5% - 2.0% ] 1.75% | 921,374 | 5.8% |
[ 2.0% - 2.5% ] 2.02% | 567,993 | 7.2% |
[ 2.0% - 2.5% ] 2.28% | 337,052 | 5.9% |
[ 2.5% - 3.0% ] 2.53% | 241,820 | 6.4% |
[ 2.5% - 3.0% ] 2.83% | 207,389 | 4.4% |
[ 3.0% - 3.5% ] 3.09% | 38,761 | 11.6% |
[ 3.0% - 3.5% ] 3.35% | 120,665 | 5.9% |
[ 3.5% - 4.0% ] 3.63% | 84,859 | 5.8% |
[ 3.5% - 4.0% ] 3.92% | 37,358 | 9.3% |
[ 4.0% - 4.5% ] 4.13% | 65,676 | 4.6% |
[ 4.0% - 4.5% ] 4.48% | 7,359 | 4.3% |
[ 4.5% - 5.0% ] 4.75% | 1,915 | 13.7% |
[ 4.5% - 5.0% ] 4.91% | 3,546 | 15.1% |
[ 5.0% - 5.5% ] 5.23% | 6,344 | 7.4% |
[ 5.5% - 6.0% ] 5.62% | 2,884 | 9.0% |
[ 5.5% - 6.0% ] 5.78% | 18,136 | 10.3% |
[ 5.5% - 6.0% ] 5.97% | 4,205 | 2.9% |
[ 6.0% - 6.5% ] 6.33% | 411 | 16.3% |
[ 6.5% - 7.0% ] 6.55% | 4,212 | 11.9% |
[ 6.5% - 7.0% ] 6.84% | 3,858 | 4.4% |
[ 7.0% - 7.5% ] 7.41% | 378 | 21.4% |
[ 7.5% - 8.0% ] 7.69% | 13 | 25.0% |
[ 7.5% - 8.0% ] 7.84% | 51 | 22.7% |
[ 9.0% - 9.5% ] 9.30% | 1,990 | 2.0% |
[ 9.5% - 10.0% ] 9.90% | 3,586 | 10.8% |
[ 10.5% - 11.0% ] 10.64% | 141 | 24.4% |
[ 12.0% - 12.5% ] 12.10% | 1,885 | 2.9% |
[ 12.0% - 12.5% ] 12.50% | 40 | 9.5% |
[ 13.5% - 14.0% ] 13.88% | 353 | 24.0% |
[ 14.5% - 15.0% ] 14.75% | 278 | 38.0% |
[ 16.0% - 16.5% ] 16.36% | 220 | 17.4% |
[ 23.0% - 23.5% ] 23.18% | 962 | 0.45% |
[ 27.5% - 28.0% ] 27.70% | 1,668 | 12.8% |
[ 35.0% - 35.5% ] 35.48% | 93 | 80.8% |