Romanian Receiving Food Stamps
COMPARE
Romanian
Select to Compare
Receiving Food Stamps
Romanian Receiving Food Stamps
10.4%
PUBLIC INCOME | FOOD STAMPS
95.8/ 100
METRIC RATING
111th/ 347
METRIC RANK
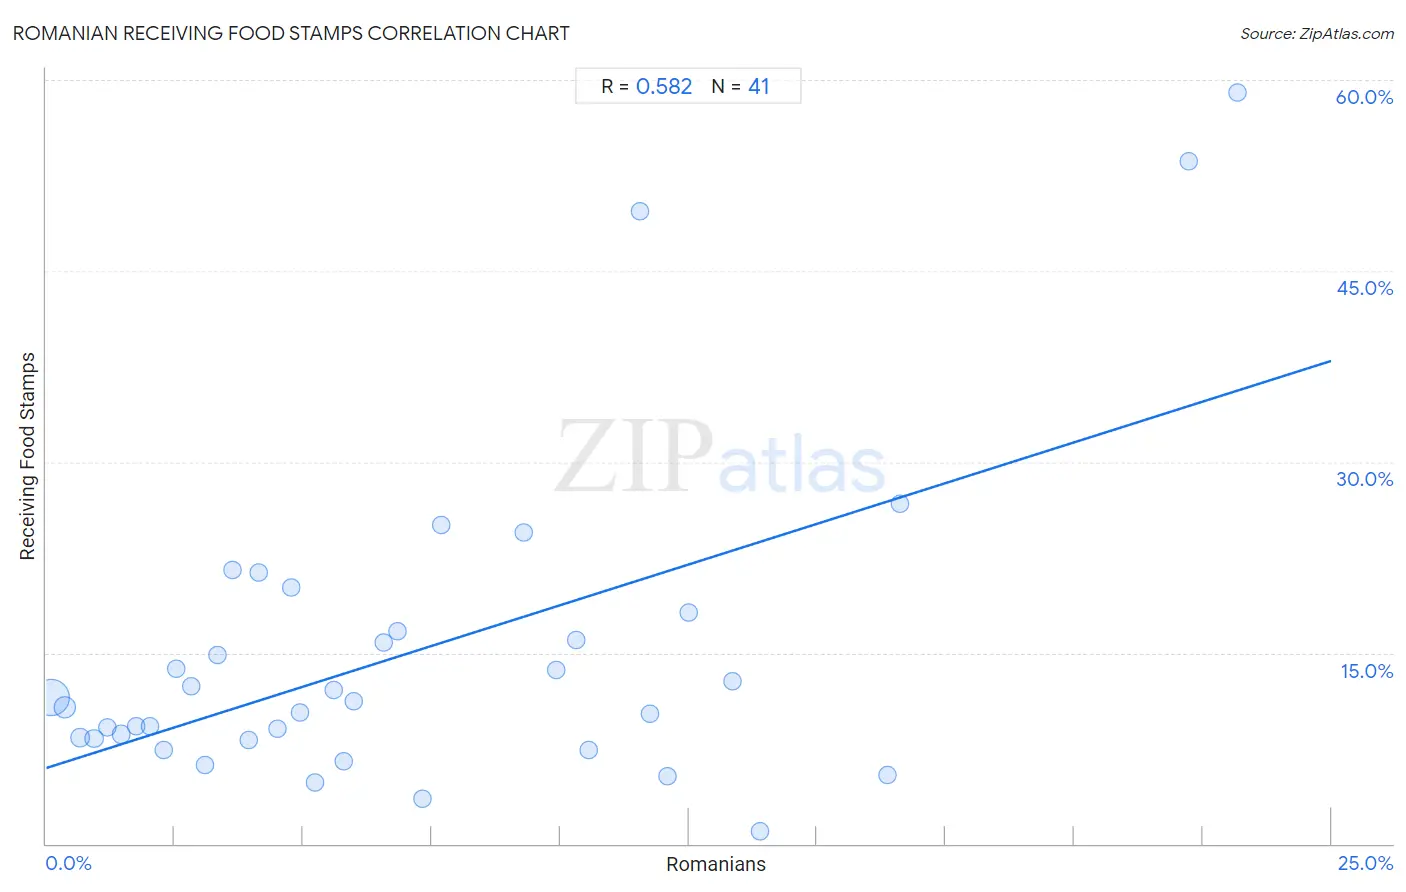
Romanian Receiving Food Stamps Correlation Chart
The statistical analysis conducted on geographies consisting of 376,766,958 people shows a substantial positive correlation between the proportion of Romanians and percentage of population receiving government assistance and/or food stamps in the United States with a correlation coefficient (R) of 0.582 and weighted average of 10.4%. On average, for every 1% (one percent) increase in Romanians within a typical geography, there is an increase of 1.3% in percentage of population receiving government assistance and/or food stamps.
It is essential to understand that the correlation between the percentage of Romanians and percentage of population receiving government assistance and/or food stamps does not imply a direct cause-and-effect relationship. It remains uncertain whether the presence of Romanians influences an upward or downward trend in the level of percentage of population receiving government assistance and/or food stamps within an area, or if Romanians simply ended up residing in those areas with higher or lower levels of percentage of population receiving government assistance and/or food stamps due to other factors.
Demographics Similar to Romanians by Receiving Food Stamps
In terms of receiving food stamps, the demographic groups most similar to Romanians are Mongolian (10.5%, a difference of 0.010%), Pakistani (10.4%, a difference of 0.10%), Immigrants from Pakistan (10.4%, a difference of 0.38%), Icelander (10.5%, a difference of 0.39%), and Carpatho Rusyn (10.4%, a difference of 0.43%).
| Demographics | Rating | Rank | Receiving Food Stamps |
| Immigrants from Hungary | 96.7 /100 | #104 | Exceptional 10.3% |
| Immigrants from Malaysia | 96.5 /100 | #105 | Exceptional 10.4% |
| Immigrants from Italy | 96.4 /100 | #106 | Exceptional 10.4% |
| Koreans | 96.3 /100 | #107 | Exceptional 10.4% |
| Carpatho Rusyns | 96.2 /100 | #108 | Exceptional 10.4% |
| Immigrants from Pakistan | 96.2 /100 | #109 | Exceptional 10.4% |
| Pakistanis | 95.9 /100 | #110 | Exceptional 10.4% |
| Romanians | 95.8 /100 | #111 | Exceptional 10.4% |
| Mongolians | 95.8 /100 | #112 | Exceptional 10.5% |
| Icelanders | 95.4 /100 | #113 | Exceptional 10.5% |
| Scotch-Irish | 95.1 /100 | #114 | Exceptional 10.5% |
| Immigrants from Saudi Arabia | 94.9 /100 | #115 | Exceptional 10.5% |
| Canadians | 94.8 /100 | #116 | Exceptional 10.5% |
| Immigrants from Nepal | 94.6 /100 | #117 | Exceptional 10.6% |
| Assyrians/Chaldeans/Syriacs | 94.1 /100 | #118 | Exceptional 10.6% |
Romanian Receiving Food Stamps Correlation Summary
| Measurement | Romanian Data | Receiving Food Stamps Data |
| Minimum | 0.10% | 1.0% |
| Maximum | 23.2% | 59.0% |
| Range | 23.1% | 58.0% |
| Mean | 7.1% | 15.1% |
| Median | 5.6% | 11.1% |
| Interquartile 25% (IQ1) | 2.7% | 8.2% |
| Interquartile 75% (IQ3) | 11.1% | 17.4% |
| Interquartile Range (IQR) | 8.4% | 9.2% |
| Standard Deviation (Sample) | 5.8% | 12.6% |
| Standard Deviation (Population) | 5.7% | 12.5% |
Correlation Details
| Romanian Percentile | Sample Size | Receiving Food Stamps |
[ 0.0% - 0.5% ] 0.10% | 284,030,097 | 11.5% |
[ 0.0% - 0.5% ] 0.36% | 62,418,017 | 10.7% |
[ 0.5% - 1.0% ] 0.66% | 15,445,882 | 8.3% |
[ 0.5% - 1.0% ] 0.93% | 7,409,621 | 8.3% |
[ 1.0% - 1.5% ] 1.19% | 3,276,097 | 9.1% |
[ 1.0% - 1.5% ] 1.46% | 1,426,560 | 8.6% |
[ 1.5% - 2.0% ] 1.75% | 914,926 | 9.2% |
[ 2.0% - 2.5% ] 2.02% | 575,524 | 9.3% |
[ 2.0% - 2.5% ] 2.29% | 333,527 | 7.4% |
[ 2.5% - 3.0% ] 2.53% | 296,984 | 13.8% |
[ 2.5% - 3.0% ] 2.82% | 214,805 | 12.4% |
[ 3.0% - 3.5% ] 3.09% | 36,957 | 6.1% |
[ 3.0% - 3.5% ] 3.34% | 114,048 | 14.8% |
[ 3.5% - 4.0% ] 3.63% | 85,468 | 21.5% |
[ 3.5% - 4.0% ] 3.94% | 61,434 | 8.2% |
[ 4.0% - 4.5% ] 4.14% | 58,642 | 21.3% |
[ 4.0% - 4.5% ] 4.50% | 6,249 | 9.0% |
[ 4.5% - 5.0% ] 4.75% | 1,998 | 20.1% |
[ 4.5% - 5.0% ] 4.93% | 3,898 | 10.3% |
[ 5.0% - 5.5% ] 5.22% | 5,592 | 4.8% |
[ 5.5% - 6.0% ] 5.58% | 2,991 | 12.1% |
[ 5.5% - 6.0% ] 5.78% | 18,136 | 6.5% |
[ 5.5% - 6.0% ] 5.97% | 4,839 | 11.1% |
[ 6.5% - 7.0% ] 6.56% | 3,536 | 15.8% |
[ 6.5% - 7.0% ] 6.84% | 3,858 | 16.7% |
[ 7.0% - 7.5% ] 7.32% | 164 | 3.5% |
[ 7.5% - 8.0% ] 7.69% | 13 | 25.0% |
[ 9.0% - 9.5% ] 9.30% | 1,990 | 24.5% |
[ 9.5% - 10.0% ] 9.92% | 3,053 | 13.7% |
[ 10.0% - 10.5% ] 10.32% | 659 | 16.0% |
[ 10.5% - 11.0% ] 10.55% | 673 | 7.4% |
[ 11.5% - 12.0% ] 11.56% | 5,501 | 49.7% |
[ 11.5% - 12.0% ] 11.74% | 426 | 10.2% |
[ 12.0% - 12.5% ] 12.10% | 1,885 | 5.3% |
[ 12.0% - 12.5% ] 12.50% | 24 | 18.2% |
[ 13.0% - 13.5% ] 13.36% | 247 | 12.8% |
[ 13.5% - 14.0% ] 13.88% | 353 | 1.0% |
[ 16.0% - 16.5% ] 16.36% | 220 | 5.4% |
[ 16.5% - 17.0% ] 16.61% | 319 | 26.7% |
[ 22.0% - 22.5% ] 22.22% | 783 | 53.6% |
[ 23.0% - 23.5% ] 23.18% | 962 | 59.0% |