Romanian vs Immigrants from Germany Disability Age 5 to 17
COMPARE
Romanian
Immigrants from Germany
Disability Age 5 to 17
Disability Age 5 to 17 Comparison
Romanians
Immigrants from Germany
5.4%
DISABILITY AGE 5 TO 17
94.1/ 100
METRIC RATING
129th/ 347
METRIC RANK
5.9%
DISABILITY AGE 5 TO 17
1.9/ 100
METRIC RATING
244th/ 347
METRIC RANK
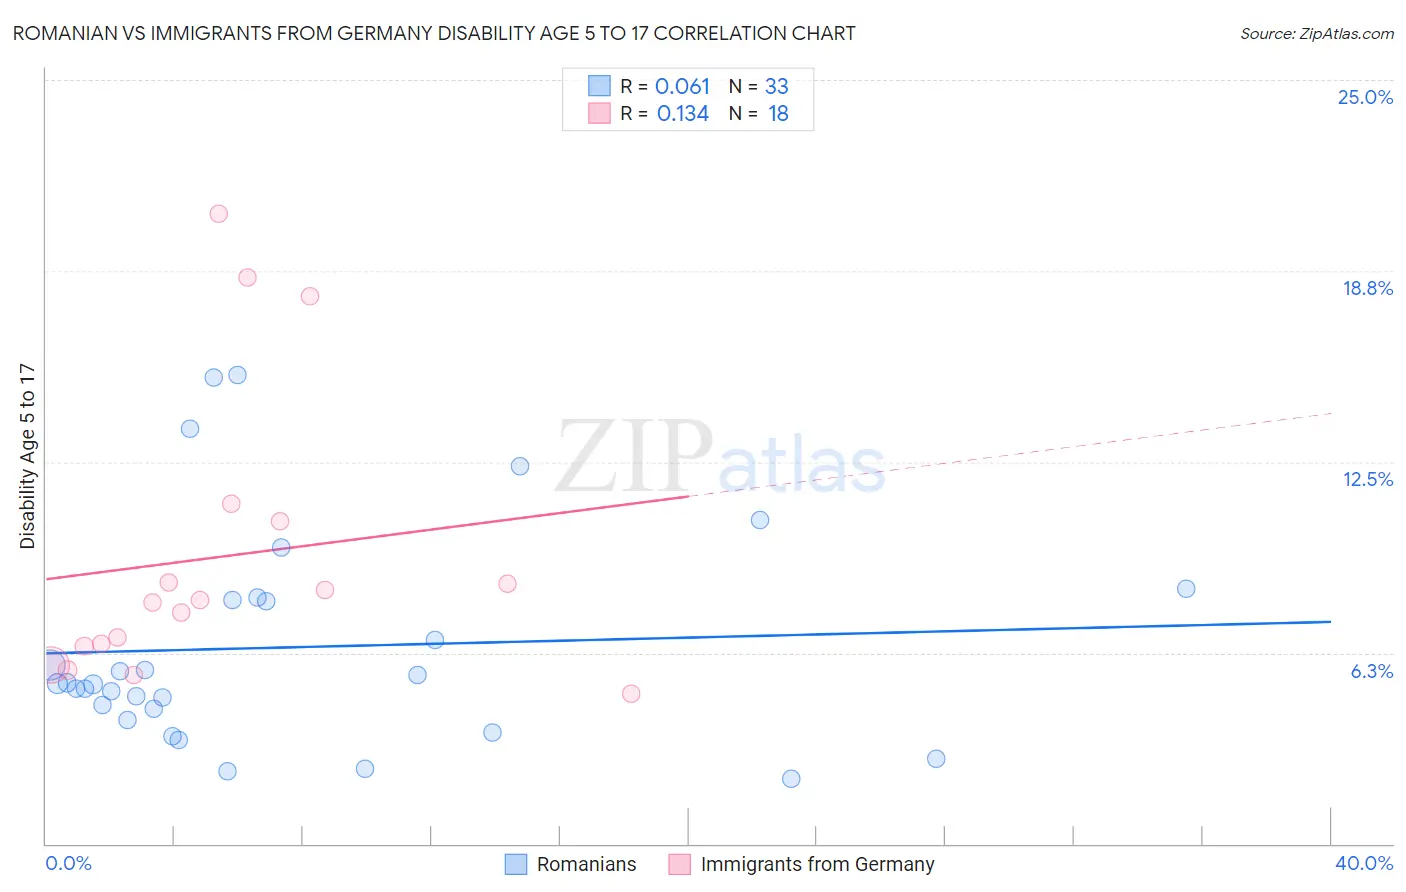
Romanian vs Immigrants from Germany Disability Age 5 to 17 Correlation Chart
The statistical analysis conducted on geographies consisting of 374,482,125 people shows a slight positive correlation between the proportion of Romanians and percentage of population with a disability between the ages 5 and 17 in the United States with a correlation coefficient (R) of 0.061 and weighted average of 5.4%. Similarly, the statistical analysis conducted on geographies consisting of 458,518,539 people shows a poor positive correlation between the proportion of Immigrants from Germany and percentage of population with a disability between the ages 5 and 17 in the United States with a correlation coefficient (R) of 0.134 and weighted average of 5.9%, a difference of 8.6%.
Disability Age 5 to 17 Correlation Summary
| Measurement | Romanian | Immigrants from Germany |
| Minimum | 2.1% | 4.9% |
| Maximum | 15.3% | 20.6% |
| Range | 13.2% | 15.7% |
| Mean | 6.4% | 9.4% |
| Median | 5.2% | 7.9% |
| Interquartile 25% (IQ1) | 4.2% | 6.5% |
| Interquartile 75% (IQ3) | 8.0% | 10.5% |
| Interquartile Range (IQR) | 3.8% | 4.1% |
| Standard Deviation (Sample) | 3.5% | 4.7% |
| Standard Deviation (Population) | 3.5% | 4.6% |
Similar Demographics by Disability Age 5 to 17
Demographics Similar to Romanians by Disability Age 5 to 17
In terms of disability age 5 to 17, the demographic groups most similar to Romanians are Immigrants from Bulgaria (5.4%, a difference of 0.020%), Immigrants from Venezuela (5.4%, a difference of 0.090%), Latvian (5.4%, a difference of 0.20%), New Zealander (5.4%, a difference of 0.21%), and Immigrants from Chile (5.4%, a difference of 0.22%).
| Demographics | Rating | Rank | Disability Age 5 to 17 |
| Chileans | 95.8 /100 | #122 | Exceptional 5.4% |
| Immigrants | Ethiopia | 95.5 /100 | #123 | Exceptional 5.4% |
| Crow | 95.0 /100 | #124 | Exceptional 5.4% |
| Immigrants | Chile | 95.0 /100 | #125 | Exceptional 5.4% |
| New Zealanders | 95.0 /100 | #126 | Exceptional 5.4% |
| Latvians | 95.0 /100 | #127 | Exceptional 5.4% |
| Immigrants | Venezuela | 94.5 /100 | #128 | Exceptional 5.4% |
| Romanians | 94.1 /100 | #129 | Exceptional 5.4% |
| Immigrants | Bulgaria | 94.0 /100 | #130 | Exceptional 5.4% |
| Arabs | 92.9 /100 | #131 | Exceptional 5.4% |
| Immigrants | Colombia | 92.9 /100 | #132 | Exceptional 5.4% |
| Venezuelans | 92.7 /100 | #133 | Exceptional 5.4% |
| Yuman | 92.3 /100 | #134 | Exceptional 5.4% |
| Immigrants | Belize | 91.7 /100 | #135 | Exceptional 5.4% |
| Immigrants | Denmark | 91.4 /100 | #136 | Exceptional 5.4% |
Demographics Similar to Immigrants from Germany by Disability Age 5 to 17
In terms of disability age 5 to 17, the demographic groups most similar to Immigrants from Germany are Immigrants from Micronesia (5.9%, a difference of 0.0%), Tlingit-Haida (5.9%, a difference of 0.0%), Immigrants from Honduras (5.9%, a difference of 0.030%), Indonesian (5.9%, a difference of 0.060%), and Spaniard (5.9%, a difference of 0.070%).
| Demographics | Rating | Rank | Disability Age 5 to 17 |
| Sudanese | 2.9 /100 | #237 | Tragic 5.8% |
| Hungarians | 2.6 /100 | #238 | Tragic 5.8% |
| German Russians | 2.4 /100 | #239 | Tragic 5.9% |
| West Indians | 2.4 /100 | #240 | Tragic 5.9% |
| Immigrants | Caribbean | 2.1 /100 | #241 | Tragic 5.9% |
| Spaniards | 2.0 /100 | #242 | Tragic 5.9% |
| Indonesians | 2.0 /100 | #243 | Tragic 5.9% |
| Immigrants | Germany | 1.9 /100 | #244 | Tragic 5.9% |
| Immigrants | Micronesia | 1.9 /100 | #245 | Tragic 5.9% |
| Tlingit-Haida | 1.9 /100 | #246 | Tragic 5.9% |
| Immigrants | Honduras | 1.8 /100 | #247 | Tragic 5.9% |
| British | 1.7 /100 | #248 | Tragic 5.9% |
| Immigrants | Ghana | 1.7 /100 | #249 | Tragic 5.9% |
| Poles | 1.5 /100 | #250 | Tragic 5.9% |
| Immigrants | Cambodia | 1.5 /100 | #251 | Tragic 5.9% |