Romanian College, 1 year or more
COMPARE
Romanian
Select to Compare
College, 1 year or more
Romanian College, 1 year or more
62.4%
COLLEGE, 1 YEAR OR MORE
97.7/ 100
METRIC RATING
93rd/ 347
METRIC RANK
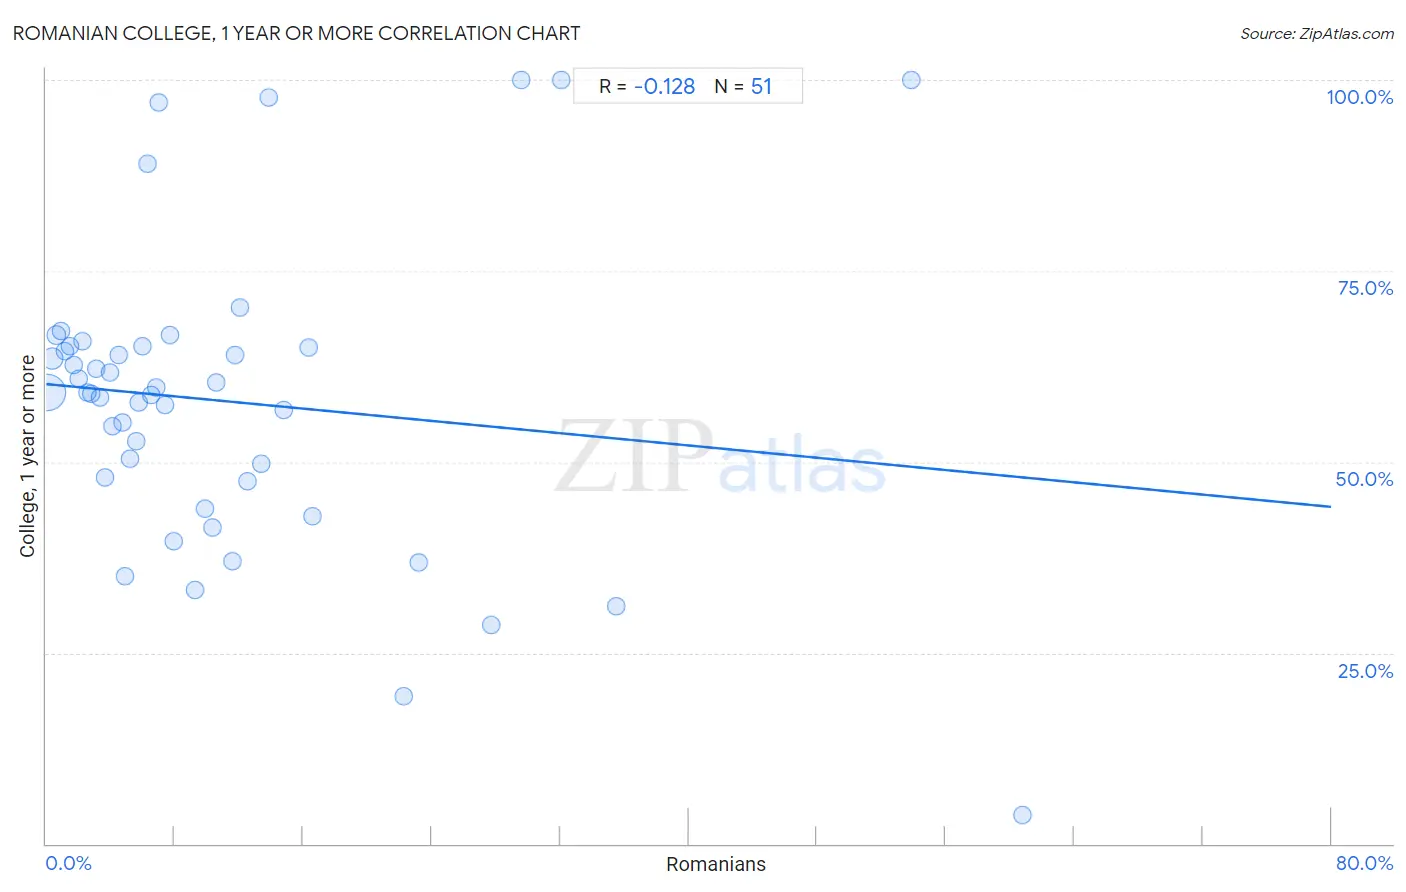
Romanian College, 1 year or more Correlation Chart
The statistical analysis conducted on geographies consisting of 377,903,335 people shows a poor negative correlation between the proportion of Romanians and percentage of population with at least college, 1 year or more education in the United States with a correlation coefficient (R) of -0.128 and weighted average of 62.4%. On average, for every 1% (one percent) increase in Romanians within a typical geography, there is a decrease of 0.20% in percentage of population with at least college, 1 year or more education.
It is essential to understand that the correlation between the percentage of Romanians and percentage of population with at least college, 1 year or more education does not imply a direct cause-and-effect relationship. It remains uncertain whether the presence of Romanians influences an upward or downward trend in the level of percentage of population with at least college, 1 year or more education within an area, or if Romanians simply ended up residing in those areas with higher or lower levels of percentage of population with at least college, 1 year or more education due to other factors.
Demographics Similar to Romanians by College, 1 year or more
In terms of college, 1 year or more, the demographic groups most similar to Romanians are Immigrants from Egypt (62.4%, a difference of 0.030%), Immigrants from Eastern Europe (62.4%, a difference of 0.040%), Immigrants from Croatia (62.3%, a difference of 0.060%), Immigrants from Western Asia (62.5%, a difference of 0.14%), and British (62.3%, a difference of 0.16%).
| Demographics | Rating | Rank | College, 1 year or more |
| Immigrants from Western Europe | 98.6 /100 | #86 | Exceptional 62.7% |
| Immigrants from Hungary | 98.6 /100 | #87 | Exceptional 62.7% |
| Greeks | 98.3 /100 | #88 | Exceptional 62.6% |
| Immigrants from Ethiopia | 98.2 /100 | #89 | Exceptional 62.6% |
| Immigrants from Western Asia | 97.9 /100 | #90 | Exceptional 62.5% |
| Immigrants from Eastern Europe | 97.8 /100 | #91 | Exceptional 62.4% |
| Immigrants from Egypt | 97.8 /100 | #92 | Exceptional 62.4% |
| Romanians | 97.7 /100 | #93 | Exceptional 62.4% |
| Immigrants from Croatia | 97.6 /100 | #94 | Exceptional 62.3% |
| British | 97.4 /100 | #95 | Exceptional 62.3% |
| Chinese | 97.2 /100 | #96 | Exceptional 62.2% |
| Jordanians | 97.2 /100 | #97 | Exceptional 62.2% |
| Carpatho Rusyns | 97.2 /100 | #98 | Exceptional 62.2% |
| Croatians | 97.1 /100 | #99 | Exceptional 62.2% |
| Icelanders | 96.8 /100 | #100 | Exceptional 62.1% |
Romanian College, 1 year or more Correlation Summary
| Measurement | Romanian Data | College, 1 year or more Data |
| Minimum | 0.10% | 3.8% |
| Maximum | 60.8% | 100.0% |
| Range | 60.7% | 96.2% |
| Mean | 11.1% | 58.0% |
| Median | 6.8% | 59.0% |
| Interquartile 25% (IQ1) | 3.3% | 47.5% |
| Interquartile 75% (IQ3) | 13.4% | 65.1% |
| Interquartile Range (IQR) | 10.0% | 17.6% |
| Standard Deviation (Sample) | 12.6% | 19.8% |
| Standard Deviation (Population) | 12.5% | 19.6% |
Correlation Details
| Romanian Percentile | Sample Size | College, 1 year or more |
[ 0.0% - 0.5% ] 0.10% | 284,561,644 | 59.1% |
[ 0.0% - 0.5% ] 0.36% | 62,684,057 | 63.5% |
[ 0.5% - 1.0% ] 0.66% | 15,570,258 | 66.6% |
[ 0.5% - 1.0% ] 0.93% | 7,469,226 | 67.1% |
[ 1.0% - 1.5% ] 1.19% | 3,349,201 | 64.5% |
[ 1.0% - 1.5% ] 1.46% | 1,442,105 | 65.1% |
[ 1.5% - 2.0% ] 1.75% | 927,791 | 62.7% |
[ 2.0% - 2.5% ] 2.02% | 583,257 | 60.9% |
[ 2.0% - 2.5% ] 2.28% | 341,508 | 65.8% |
[ 2.5% - 3.0% ] 2.53% | 298,414 | 59.0% |
[ 2.5% - 3.0% ] 2.83% | 217,720 | 59.0% |
[ 3.0% - 3.5% ] 3.09% | 39,247 | 62.2% |
[ 3.0% - 3.5% ] 3.35% | 122,503 | 58.4% |
[ 3.5% - 4.0% ] 3.63% | 85,739 | 47.9% |
[ 3.5% - 4.0% ] 3.94% | 64,919 | 61.6% |
[ 4.0% - 4.5% ] 4.13% | 65,774 | 54.7% |
[ 4.0% - 4.5% ] 4.49% | 7,825 | 63.9% |
[ 4.5% - 5.0% ] 4.78% | 3,368 | 55.2% |
[ 4.5% - 5.0% ] 4.93% | 4,057 | 35.0% |
[ 5.0% - 5.5% ] 5.22% | 7,065 | 50.4% |
[ 5.5% - 6.0% ] 5.58% | 3,603 | 52.7% |
[ 5.5% - 6.0% ] 5.79% | 18,526 | 57.7% |
[ 5.5% - 6.0% ] 5.97% | 4,839 | 65.2% |
[ 6.0% - 6.5% ] 6.30% | 540 | 89.0% |
[ 6.5% - 7.0% ] 6.57% | 4,903 | 58.8% |
[ 6.5% - 7.0% ] 6.84% | 3,858 | 59.7% |
[ 7.0% - 7.5% ] 7.01% | 214 | 97.0% |
[ 7.0% - 7.5% ] 7.41% | 378 | 57.4% |
[ 7.5% - 8.0% ] 7.69% | 13 | 66.7% |
[ 7.5% - 8.0% ] 7.96% | 377 | 39.5% |
[ 9.0% - 9.5% ] 9.30% | 1,990 | 33.2% |
[ 9.5% - 10.0% ] 9.90% | 3,586 | 43.8% |
[ 10.0% - 10.5% ] 10.32% | 659 | 41.5% |
[ 10.5% - 11.0% ] 10.55% | 919 | 60.5% |
[ 11.5% - 12.0% ] 11.56% | 5,501 | 37.0% |
[ 11.5% - 12.0% ] 11.74% | 426 | 64.0% |
[ 12.0% - 12.5% ] 12.10% | 1,885 | 70.2% |
[ 12.0% - 12.5% ] 12.50% | 40 | 47.5% |
[ 13.0% - 13.5% ] 13.36% | 247 | 49.7% |
[ 13.5% - 14.0% ] 13.88% | 353 | 97.7% |
[ 14.5% - 15.0% ] 14.75% | 278 | 56.8% |
[ 16.0% - 16.5% ] 16.36% | 220 | 65.0% |
[ 16.5% - 17.0% ] 16.61% | 319 | 42.9% |
[ 22.0% - 22.5% ] 22.22% | 783 | 19.3% |
[ 23.0% - 23.5% ] 23.18% | 962 | 36.9% |
[ 27.5% - 28.0% ] 27.70% | 1,668 | 28.6% |
[ 29.5% - 30.0% ] 29.59% | 98 | 100.0% |
[ 32.0% - 32.5% ] 32.05% | 78 | 100.0% |
[ 35.0% - 35.5% ] 35.48% | 93 | 31.0% |
[ 53.5% - 54.0% ] 53.85% | 13 | 100.0% |
[ 60.5% - 61.0% ] 60.76% | 288 | 3.8% |