Romanian Married-couple Households
COMPARE
Romanian
Select to Compare
Married-couple Households
Romanian Married-couple Households
48.4%
MARRIED-COUPLE HOUSEHOLDS
98.9/ 100
METRIC RATING
67th/ 347
METRIC RANK
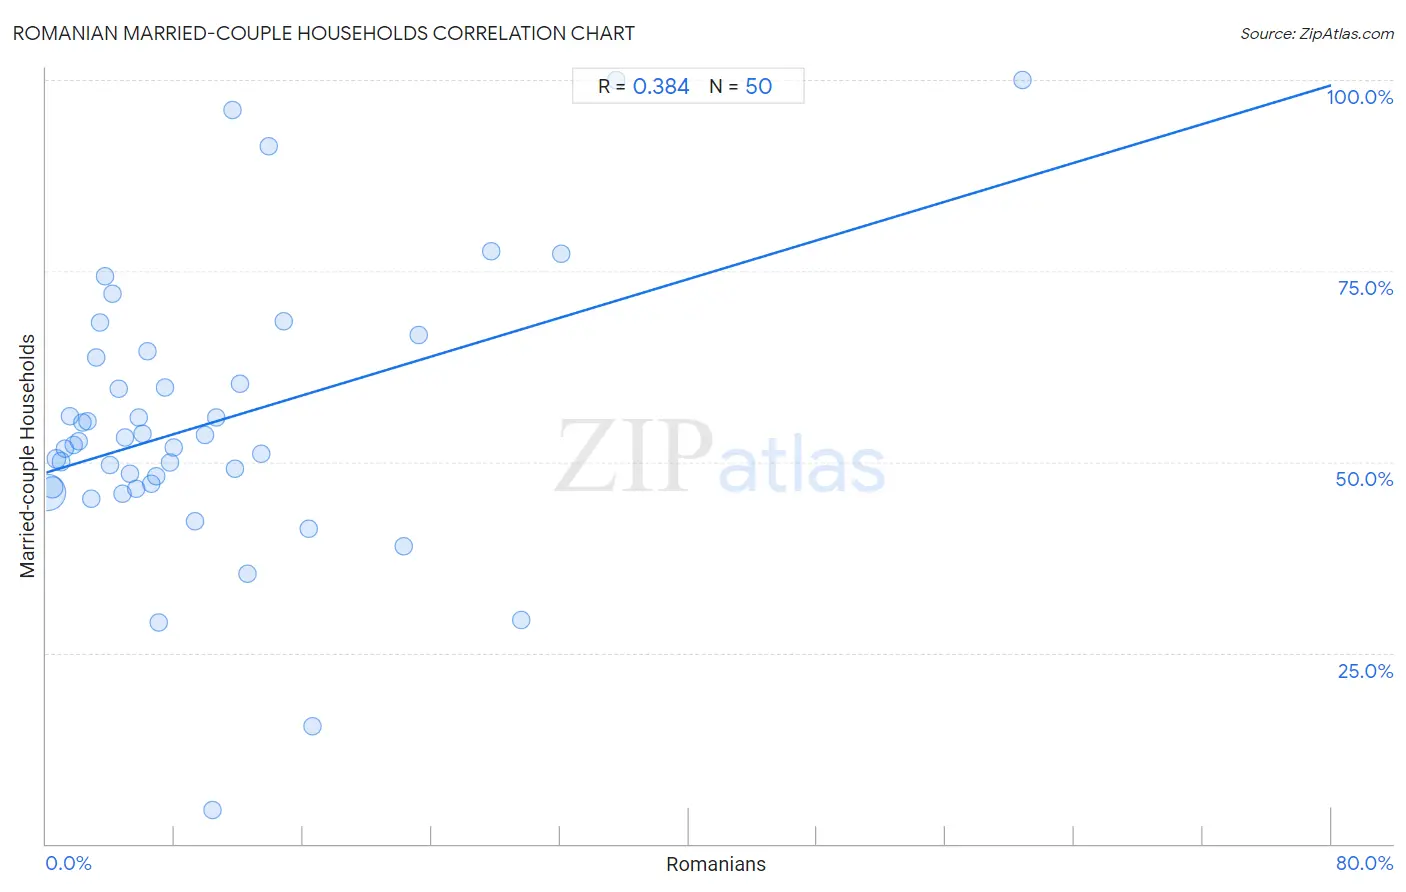
Romanian Married-couple Households Correlation Chart
The statistical analysis conducted on geographies consisting of 377,697,282 people shows a mild positive correlation between the proportion of Romanians and percentage of married-couple family households in the United States with a correlation coefficient (R) of 0.384 and weighted average of 48.4%. On average, for every 1% (one percent) increase in Romanians within a typical geography, there is an increase of 0.63% in percentage of married-couple family households.
It is essential to understand that the correlation between the percentage of Romanians and percentage of married-couple family households does not imply a direct cause-and-effect relationship. It remains uncertain whether the presence of Romanians influences an upward or downward trend in the level of percentage of married-couple family households within an area, or if Romanians simply ended up residing in those areas with higher or lower levels of percentage of married-couple family households due to other factors.
Demographics Similar to Romanians by Married-couple Households
In terms of married-couple households, the demographic groups most similar to Romanians are Jordanian (48.4%, a difference of 0.0%), Immigrants from South Eastern Asia (48.4%, a difference of 0.010%), Immigrants from China (48.4%, a difference of 0.010%), Immigrants from Canada (48.4%, a difference of 0.030%), and Northern European (48.4%, a difference of 0.050%).
| Demographics | Rating | Rank | Married-couple Households |
| Croatians | 99.1 /100 | #60 | Exceptional 48.5% |
| Bulgarians | 99.1 /100 | #61 | Exceptional 48.5% |
| Luxembourgers | 99.1 /100 | #62 | Exceptional 48.5% |
| Basques | 99.0 /100 | #63 | Exceptional 48.4% |
| Northern Europeans | 99.0 /100 | #64 | Exceptional 48.4% |
| Immigrants from Canada | 99.0 /100 | #65 | Exceptional 48.4% |
| Jordanians | 98.9 /100 | #66 | Exceptional 48.4% |
| Romanians | 98.9 /100 | #67 | Exceptional 48.4% |
| Immigrants from South Eastern Asia | 98.9 /100 | #68 | Exceptional 48.4% |
| Immigrants from China | 98.9 /100 | #69 | Exceptional 48.4% |
| Immigrants from North America | 98.9 /100 | #70 | Exceptional 48.4% |
| Laotians | 98.8 /100 | #71 | Exceptional 48.4% |
| Scotch-Irish | 98.6 /100 | #72 | Exceptional 48.3% |
| Immigrants from Singapore | 98.6 /100 | #73 | Exceptional 48.3% |
| Immigrants from Romania | 98.6 /100 | #74 | Exceptional 48.3% |
Romanian Married-couple Households Correlation Summary
| Measurement | Romanian Data | Married-couple Households Data |
| Minimum | 0.10% | 4.5% |
| Maximum | 60.8% | 100.0% |
| Range | 60.7% | 95.5% |
| Mean | 10.3% | 55.1% |
| Median | 6.7% | 52.5% |
| Interquartile 25% (IQ1) | 3.3% | 46.7% |
| Interquartile 75% (IQ3) | 12.5% | 63.6% |
| Interquartile Range (IQR) | 9.2% | 17.0% |
| Standard Deviation (Sample) | 11.2% | 18.4% |
| Standard Deviation (Population) | 11.1% | 18.3% |
Correlation Details
| Romanian Percentile | Sample Size | Married-couple Households |
[ 0.0% - 0.5% ] 0.10% | 284,448,436 | 45.9% |
[ 0.0% - 0.5% ] 0.36% | 62,611,144 | 46.7% |
[ 0.5% - 1.0% ] 0.66% | 15,565,177 | 50.5% |
[ 0.5% - 1.0% ] 0.93% | 7,457,201 | 50.0% |
[ 1.0% - 1.5% ] 1.19% | 3,348,721 | 51.8% |
[ 1.0% - 1.5% ] 1.46% | 1,442,105 | 56.0% |
[ 1.5% - 2.0% ] 1.75% | 926,423 | 52.2% |
[ 2.0% - 2.5% ] 2.02% | 583,257 | 52.7% |
[ 2.0% - 2.5% ] 2.28% | 341,508 | 55.1% |
[ 2.5% - 3.0% ] 2.53% | 297,832 | 55.3% |
[ 2.5% - 3.0% ] 2.83% | 217,720 | 45.1% |
[ 3.0% - 3.5% ] 3.09% | 39,247 | 63.6% |
[ 3.0% - 3.5% ] 3.35% | 122,323 | 68.2% |
[ 3.5% - 4.0% ] 3.63% | 85,739 | 74.2% |
[ 3.5% - 4.0% ] 3.94% | 64,919 | 49.5% |
[ 4.0% - 4.5% ] 4.13% | 65,774 | 72.0% |
[ 4.0% - 4.5% ] 4.49% | 7,825 | 59.6% |
[ 4.5% - 5.0% ] 4.78% | 3,368 | 45.8% |
[ 4.5% - 5.0% ] 4.93% | 4,057 | 53.2% |
[ 5.0% - 5.5% ] 5.22% | 7,065 | 48.5% |
[ 5.5% - 6.0% ] 5.58% | 3,603 | 46.5% |
[ 5.5% - 6.0% ] 5.79% | 18,323 | 55.8% |
[ 5.5% - 6.0% ] 5.97% | 4,839 | 53.6% |
[ 6.0% - 6.5% ] 6.30% | 540 | 64.5% |
[ 6.5% - 7.0% ] 6.57% | 4,903 | 47.1% |
[ 6.5% - 7.0% ] 6.84% | 3,858 | 48.1% |
[ 7.0% - 7.5% ] 7.01% | 214 | 28.9% |
[ 7.0% - 7.5% ] 7.41% | 378 | 59.8% |
[ 7.5% - 8.0% ] 7.69% | 13 | 50.0% |
[ 7.5% - 8.0% ] 7.96% | 377 | 51.9% |
[ 9.0% - 9.5% ] 9.30% | 1,990 | 42.2% |
[ 9.5% - 10.0% ] 9.90% | 3,586 | 53.5% |
[ 10.0% - 10.5% ] 10.32% | 659 | 4.5% |
[ 10.5% - 11.0% ] 10.55% | 919 | 55.9% |
[ 11.5% - 12.0% ] 11.56% | 5,501 | 96.0% |
[ 11.5% - 12.0% ] 11.74% | 426 | 49.2% |
[ 12.0% - 12.5% ] 12.10% | 1,885 | 60.2% |
[ 12.0% - 12.5% ] 12.50% | 40 | 35.3% |
[ 13.0% - 13.5% ] 13.36% | 247 | 51.1% |
[ 13.5% - 14.0% ] 13.88% | 353 | 91.3% |
[ 14.5% - 15.0% ] 14.75% | 278 | 68.5% |
[ 16.0% - 16.5% ] 16.36% | 220 | 41.3% |
[ 16.5% - 17.0% ] 16.61% | 319 | 15.3% |
[ 22.0% - 22.5% ] 22.22% | 783 | 39.0% |
[ 23.0% - 23.5% ] 23.18% | 962 | 66.7% |
[ 27.5% - 28.0% ] 27.70% | 1,668 | 77.6% |
[ 29.5% - 30.0% ] 29.59% | 98 | 29.2% |
[ 32.0% - 32.5% ] 32.05% | 78 | 77.3% |
[ 35.0% - 35.5% ] 35.48% | 93 | 100.0% |
[ 60.5% - 61.0% ] 60.76% | 288 | 100.0% |