Pueblo Disability Age Under 5
COMPARE
Pueblo
Select to Compare
Disability Age Under 5
Pueblo Disability Age Under 5
1.3%
DISABILITY | AGE UNDER 5
3.8/ 100
METRIC RATING
234th/ 347
METRIC RANK
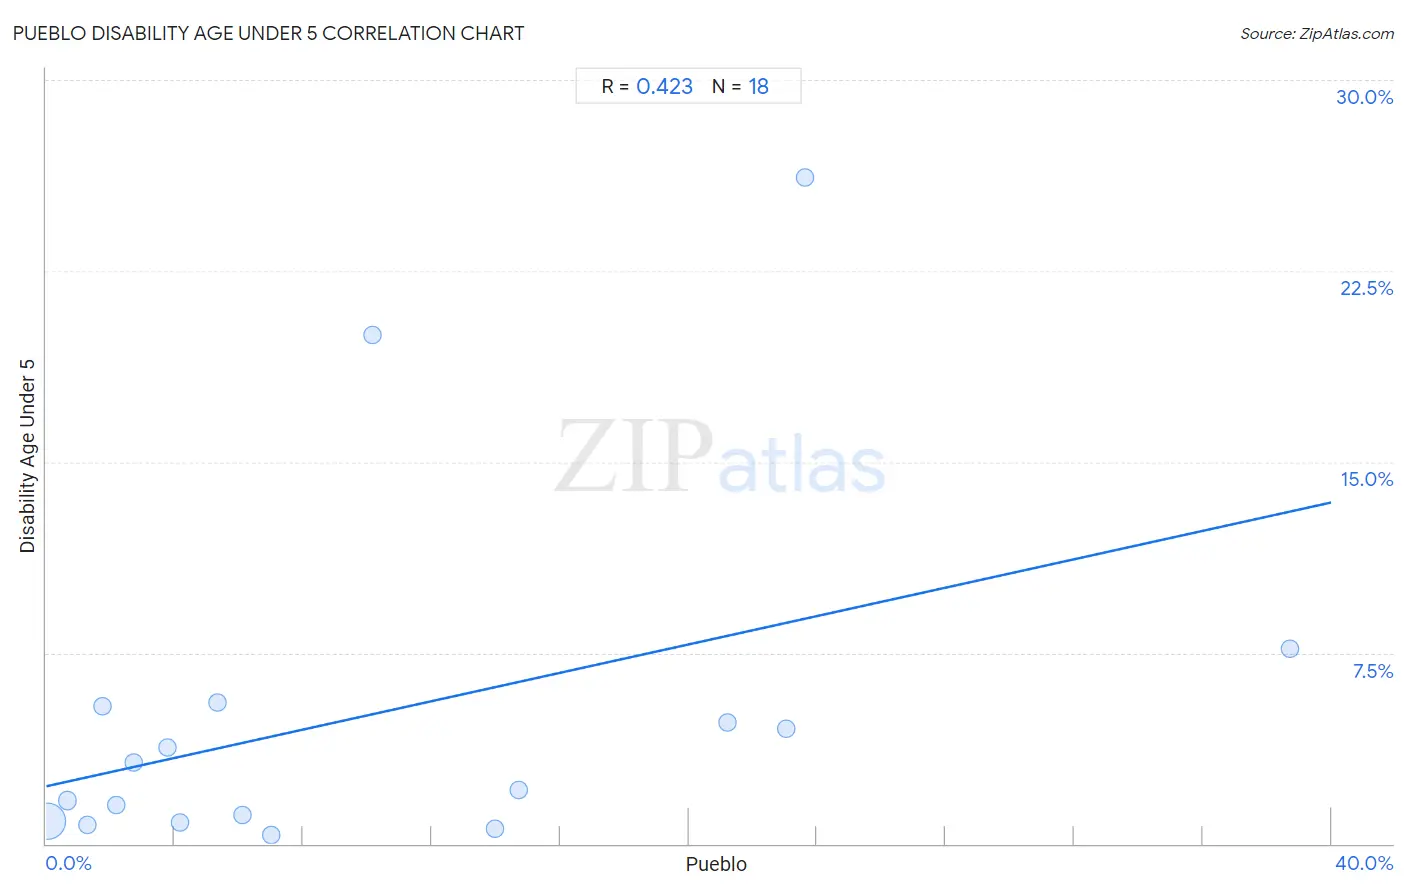
Pueblo Disability Age Under 5 Correlation Chart
The statistical analysis conducted on geographies consisting of 91,796,516 people shows a moderate positive correlation between the proportion of Pueblo and percentage of population with a disability under the age of 5 in the United States with a correlation coefficient (R) of 0.423 and weighted average of 1.3%. On average, for every 1% (one percent) increase in Pueblo within a typical geography, there is an increase of 0.28% in percentage of population with a disability under the age of 5.
It is essential to understand that the correlation between the percentage of Pueblo and percentage of population with a disability under the age of 5 does not imply a direct cause-and-effect relationship. It remains uncertain whether the presence of Pueblo influences an upward or downward trend in the level of percentage of population with a disability under the age of 5 within an area, or if Pueblo simply ended up residing in those areas with higher or lower levels of percentage of population with a disability under the age of 5 due to other factors.
Demographics Similar to Pueblo by Disability Age Under 5
In terms of disability age under 5, the demographic groups most similar to Pueblo are Central American Indian (1.3%, a difference of 0.070%), Tongan (1.3%, a difference of 0.26%), South American Indian (1.3%, a difference of 0.27%), French American Indian (1.3%, a difference of 0.38%), and Immigrants from Northern Europe (1.3%, a difference of 0.51%).
| Demographics | Rating | Rank | Disability Age Under 5 |
| Taiwanese | 6.1 /100 | #227 | Tragic 1.3% |
| Luxembourgers | 6.1 /100 | #228 | Tragic 1.3% |
| Immigrants from Costa Rica | 5.5 /100 | #229 | Tragic 1.3% |
| Lebanese | 5.3 /100 | #230 | Tragic 1.3% |
| Immigrants from Northern Europe | 4.7 /100 | #231 | Tragic 1.3% |
| French American Indians | 4.5 /100 | #232 | Tragic 1.3% |
| Tongans | 4.2 /100 | #233 | Tragic 1.3% |
| Pueblo | 3.8 /100 | #234 | Tragic 1.3% |
| Central American Indians | 3.6 /100 | #235 | Tragic 1.3% |
| South American Indians | 3.3 /100 | #236 | Tragic 1.3% |
| Basques | 3.0 /100 | #237 | Tragic 1.3% |
| Spanish American Indians | 2.4 /100 | #238 | Tragic 1.3% |
| Immigrants from Austria | 2.3 /100 | #239 | Tragic 1.3% |
| Native Hawaiians | 2.2 /100 | #240 | Tragic 1.3% |
| Maltese | 2.2 /100 | #241 | Tragic 1.3% |
Pueblo Disability Age Under 5 Correlation Summary
| Measurement | Pueblo Data | Disability Age Under 5 Data |
| Minimum | 0.036% | 0.37% |
| Maximum | 38.7% | 26.2% |
| Range | 38.7% | 25.8% |
| Mean | 10.0% | 5.1% |
| Median | 5.7% | 2.7% |
| Interquartile 25% (IQ1) | 2.2% | 0.86% |
| Interquartile 75% (IQ3) | 14.7% | 5.4% |
| Interquartile Range (IQR) | 12.6% | 4.5% |
| Standard Deviation (Sample) | 10.6% | 7.0% |
| Standard Deviation (Population) | 10.3% | 6.8% |
Correlation Details
| Pueblo Percentile | Sample Size | Disability Age Under 5 |
[ 0.0% - 0.5% ] 0.036% | 90,050,694 | 0.86% |
[ 0.5% - 1.0% ] 0.66% | 552,218 | 1.7% |
[ 1.0% - 1.5% ] 1.28% | 984,832 | 0.72% |
[ 1.5% - 2.0% ] 1.77% | 67,286 | 5.4% |
[ 2.0% - 2.5% ] 2.16% | 4,023 | 1.5% |
[ 2.5% - 3.0% ] 2.71% | 14,706 | 3.2% |
[ 3.5% - 4.0% ] 3.78% | 5,027 | 3.8% |
[ 4.0% - 4.5% ] 4.15% | 56,808 | 0.83% |
[ 5.0% - 5.5% ] 5.33% | 806 | 5.6% |
[ 6.0% - 6.5% ] 6.10% | 2,902 | 1.1% |
[ 7.0% - 7.5% ] 7.00% | 20,354 | 0.37% |
[ 10.0% - 10.5% ] 10.17% | 423 | 20.0% |
[ 13.5% - 14.0% ] 13.97% | 11,614 | 0.61% |
[ 14.5% - 15.0% ] 14.72% | 15,895 | 2.1% |
[ 21.0% - 21.5% ] 21.20% | 2,165 | 4.8% |
[ 23.0% - 23.5% ] 23.03% | 2,336 | 4.5% |
[ 23.5% - 24.0% ] 23.61% | 610 | 26.2% |
[ 38.5% - 39.0% ] 38.72% | 3,817 | 7.6% |