Pueblo vs Immigrants from Netherlands Disability Age 5 to 17
COMPARE
Pueblo
Immigrants from Netherlands
Disability Age 5 to 17
Disability Age 5 to 17 Comparison
Pueblo
Immigrants from Netherlands
5.7%
DISABILITY AGE 5 TO 17
27.5/ 100
METRIC RATING
189th/ 347
METRIC RANK
5.4%
DISABILITY AGE 5 TO 17
90.5/ 100
METRIC RATING
140th/ 347
METRIC RANK
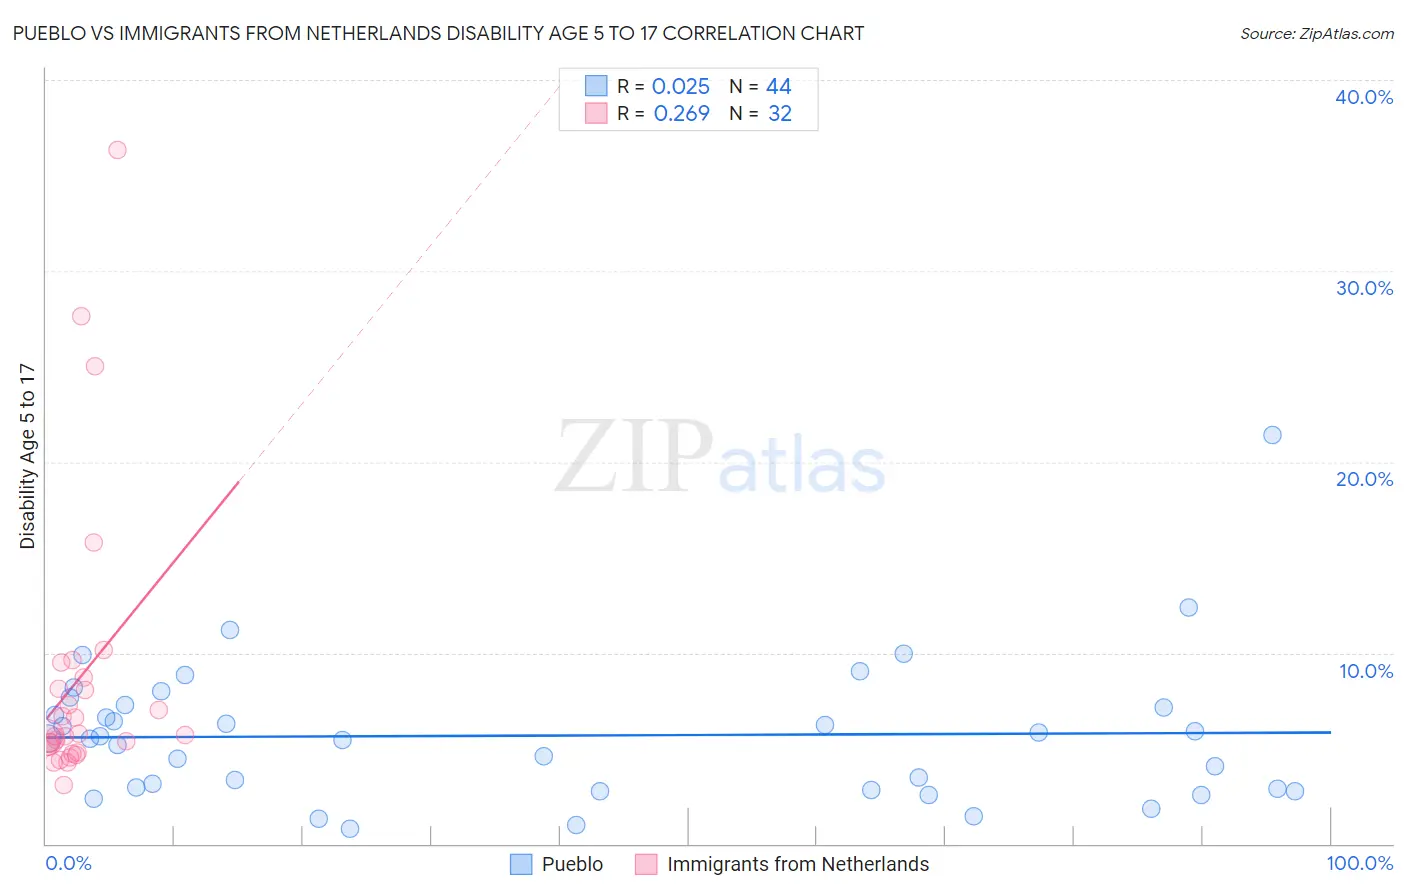
Pueblo vs Immigrants from Netherlands Disability Age 5 to 17 Correlation Chart
The statistical analysis conducted on geographies consisting of 119,704,648 people shows no correlation between the proportion of Pueblo and percentage of population with a disability between the ages 5 and 17 in the United States with a correlation coefficient (R) of 0.025 and weighted average of 5.7%. Similarly, the statistical analysis conducted on geographies consisting of 236,298,961 people shows a weak positive correlation between the proportion of Immigrants from Netherlands and percentage of population with a disability between the ages 5 and 17 in the United States with a correlation coefficient (R) of 0.269 and weighted average of 5.4%, a difference of 4.1%.
Disability Age 5 to 17 Correlation Summary
| Measurement | Pueblo | Immigrants from Netherlands |
| Minimum | 0.78% | 3.1% |
| Maximum | 21.4% | 36.4% |
| Range | 20.6% | 33.3% |
| Mean | 5.7% | 8.6% |
| Median | 5.5% | 5.7% |
| Interquartile 25% (IQ1) | 2.8% | 5.0% |
| Interquartile 75% (IQ3) | 7.2% | 8.4% |
| Interquartile Range (IQR) | 4.3% | 3.5% |
| Standard Deviation (Sample) | 3.7% | 7.4% |
| Standard Deviation (Population) | 3.7% | 7.3% |
Similar Demographics by Disability Age 5 to 17
Demographics Similar to Pueblo by Disability Age 5 to 17
In terms of disability age 5 to 17, the demographic groups most similar to Pueblo are Immigrants from Eastern Africa (5.7%, a difference of 0.010%), Marshallese (5.7%, a difference of 0.040%), Danish (5.7%, a difference of 0.060%), Immigrants from Bosnia and Herzegovina (5.7%, a difference of 0.070%), and Immigrants from Canada (5.7%, a difference of 0.090%).
| Demographics | Rating | Rank | Disability Age 5 to 17 |
| Mexican American Indians | 35.2 /100 | #182 | Fair 5.6% |
| Immigrants | Latin America | 34.3 /100 | #183 | Fair 5.6% |
| Syrians | 33.8 /100 | #184 | Fair 5.6% |
| Immigrants | Mexico | 33.7 /100 | #185 | Fair 5.6% |
| Fijians | 31.7 /100 | #186 | Fair 5.7% |
| Immigrants | Thailand | 30.2 /100 | #187 | Fair 5.7% |
| Marshallese | 28.1 /100 | #188 | Fair 5.7% |
| Pueblo | 27.5 /100 | #189 | Fair 5.7% |
| Immigrants | Eastern Africa | 27.3 /100 | #190 | Fair 5.7% |
| Danes | 26.5 /100 | #191 | Fair 5.7% |
| Immigrants | Bosnia and Herzegovina | 26.3 /100 | #192 | Fair 5.7% |
| Immigrants | Canada | 26.1 /100 | #193 | Fair 5.7% |
| Croatians | 23.6 /100 | #194 | Fair 5.7% |
| Immigrants | Nigeria | 23.4 /100 | #195 | Fair 5.7% |
| Inupiat | 23.3 /100 | #196 | Fair 5.7% |
Demographics Similar to Immigrants from Netherlands by Disability Age 5 to 17
In terms of disability age 5 to 17, the demographic groups most similar to Immigrants from Netherlands are Immigrants from Oceania (5.4%, a difference of 0.050%), Belizean (5.4%, a difference of 0.050%), Navajo (5.4%, a difference of 0.060%), Immigrants from Denmark (5.4%, a difference of 0.14%), and South American Indian (5.5%, a difference of 0.17%).
| Demographics | Rating | Rank | Disability Age 5 to 17 |
| Venezuelans | 92.7 /100 | #133 | Exceptional 5.4% |
| Yuman | 92.3 /100 | #134 | Exceptional 5.4% |
| Immigrants | Belize | 91.7 /100 | #135 | Exceptional 5.4% |
| Immigrants | Denmark | 91.4 /100 | #136 | Exceptional 5.4% |
| Navajo | 90.9 /100 | #137 | Exceptional 5.4% |
| Immigrants | Oceania | 90.8 /100 | #138 | Exceptional 5.4% |
| Belizeans | 90.8 /100 | #139 | Exceptional 5.4% |
| Immigrants | Netherlands | 90.5 /100 | #140 | Exceptional 5.4% |
| South American Indians | 89.3 /100 | #141 | Excellent 5.5% |
| Colombians | 88.0 /100 | #142 | Excellent 5.5% |
| Immigrants | Hungary | 87.9 /100 | #143 | Excellent 5.5% |
| Pakistanis | 87.3 /100 | #144 | Excellent 5.5% |
| Immigrants | Guatemala | 86.6 /100 | #145 | Excellent 5.5% |
| Albanians | 83.7 /100 | #146 | Excellent 5.5% |
| Immigrants | Albania | 83.1 /100 | #147 | Excellent 5.5% |