Immigrants from Southern Europe vs Immigrants from Hong Kong Disability Age 5 to 17
COMPARE
Immigrants from Southern Europe
Immigrants from Hong Kong
Disability Age 5 to 17
Disability Age 5 to 17 Comparison
Immigrants from Southern Europe
Immigrants from Hong Kong
5.6%
DISABILITY AGE 5 TO 17
64.0/ 100
METRIC RATING
163rd/ 347
METRIC RANK
4.3%
DISABILITY AGE 5 TO 17
100.0/ 100
METRIC RATING
3rd/ 347
METRIC RANK
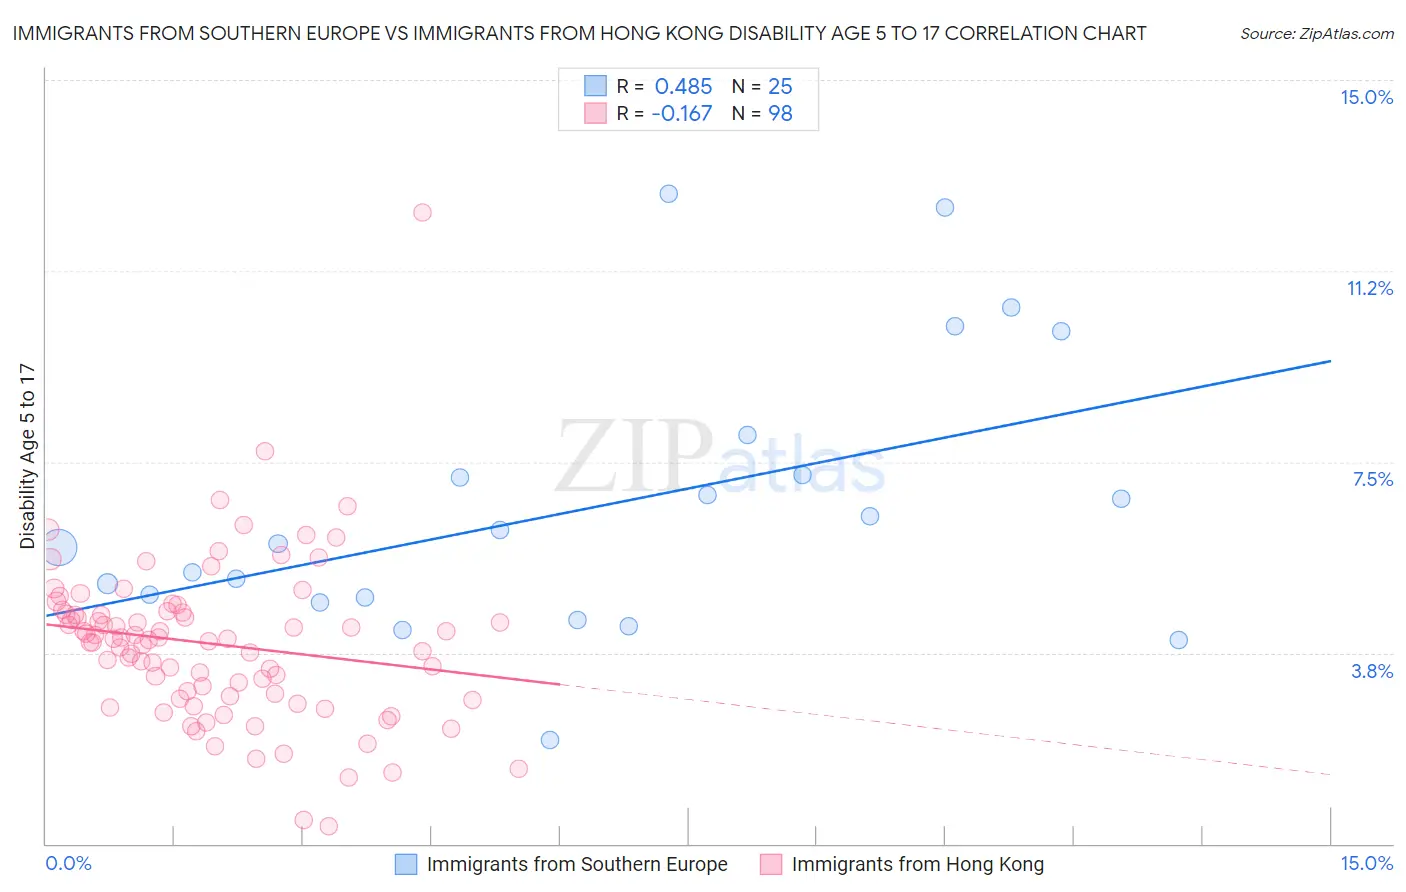
Immigrants from Southern Europe vs Immigrants from Hong Kong Disability Age 5 to 17 Correlation Chart
The statistical analysis conducted on geographies consisting of 398,595,383 people shows a moderate positive correlation between the proportion of Immigrants from Southern Europe and percentage of population with a disability between the ages 5 and 17 in the United States with a correlation coefficient (R) of 0.485 and weighted average of 5.6%. Similarly, the statistical analysis conducted on geographies consisting of 252,525,907 people shows a poor negative correlation between the proportion of Immigrants from Hong Kong and percentage of population with a disability between the ages 5 and 17 in the United States with a correlation coefficient (R) of -0.167 and weighted average of 4.3%, a difference of 29.4%.
Disability Age 5 to 17 Correlation Summary
| Measurement | Immigrants from Southern Europe | Immigrants from Hong Kong |
| Minimum | 2.0% | 0.35% |
| Maximum | 12.8% | 12.4% |
| Range | 10.7% | 12.0% |
| Mean | 6.6% | 3.9% |
| Median | 5.9% | 4.0% |
| Interquartile 25% (IQ1) | 4.8% | 2.9% |
| Interquartile 75% (IQ3) | 7.6% | 4.5% |
| Interquartile Range (IQR) | 2.8% | 1.6% |
| Standard Deviation (Sample) | 2.7% | 1.6% |
| Standard Deviation (Population) | 2.7% | 1.6% |
Similar Demographics by Disability Age 5 to 17
Demographics Similar to Immigrants from Southern Europe by Disability Age 5 to 17
In terms of disability age 5 to 17, the demographic groups most similar to Immigrants from Southern Europe are Immigrants from Scotland (5.6%, a difference of 0.11%), Lebanese (5.6%, a difference of 0.14%), Zimbabwean (5.5%, a difference of 0.18%), Greek (5.6%, a difference of 0.18%), and Immigrants from Burma/Myanmar (5.6%, a difference of 0.25%).
| Demographics | Rating | Rank | Disability Age 5 to 17 |
| Hawaiians | 78.0 /100 | #156 | Good 5.5% |
| Immigrants | Costa Rica | 77.9 /100 | #157 | Good 5.5% |
| Immigrants | Nepal | 77.1 /100 | #158 | Good 5.5% |
| Immigrants | Zimbabwe | 75.3 /100 | #159 | Good 5.5% |
| South Africans | 73.3 /100 | #160 | Good 5.5% |
| Immigrants | Saudi Arabia | 69.1 /100 | #161 | Good 5.5% |
| Zimbabweans | 67.2 /100 | #162 | Good 5.5% |
| Immigrants | Southern Europe | 64.0 /100 | #163 | Good 5.6% |
| Immigrants | Scotland | 61.9 /100 | #164 | Good 5.6% |
| Lebanese | 61.4 /100 | #165 | Good 5.6% |
| Greeks | 60.6 /100 | #166 | Good 5.6% |
| Immigrants | Burma/Myanmar | 59.3 /100 | #167 | Average 5.6% |
| Iraqis | 56.0 /100 | #168 | Average 5.6% |
| Immigrants | Norway | 55.7 /100 | #169 | Average 5.6% |
| Serbians | 54.0 /100 | #170 | Average 5.6% |
Demographics Similar to Immigrants from Hong Kong by Disability Age 5 to 17
In terms of disability age 5 to 17, the demographic groups most similar to Immigrants from Hong Kong are Filipino (4.3%, a difference of 1.0%), Immigrants from Iran (4.4%, a difference of 1.5%), Immigrants from Taiwan (4.2%, a difference of 2.5%), Immigrants from Israel (4.5%, a difference of 5.0%), and Immigrants from China (4.5%, a difference of 5.3%).
| Demographics | Rating | Rank | Disability Age 5 to 17 |
| Immigrants | Armenia | 100.0 /100 | #1 | Exceptional 4.1% |
| Immigrants | Taiwan | 100.0 /100 | #2 | Exceptional 4.2% |
| Immigrants | Hong Kong | 100.0 /100 | #3 | Exceptional 4.3% |
| Filipinos | 100.0 /100 | #4 | Exceptional 4.3% |
| Immigrants | Iran | 100.0 /100 | #5 | Exceptional 4.4% |
| Immigrants | Israel | 100.0 /100 | #6 | Exceptional 4.5% |
| Immigrants | China | 100.0 /100 | #7 | Exceptional 4.5% |
| Indians (Asian) | 100.0 /100 | #8 | Exceptional 4.6% |
| Immigrants | Eastern Asia | 100.0 /100 | #9 | Exceptional 4.6% |
| Immigrants | India | 100.0 /100 | #10 | Exceptional 4.6% |
| Armenians | 100.0 /100 | #11 | Exceptional 4.6% |
| Iranians | 100.0 /100 | #12 | Exceptional 4.6% |
| Thais | 100.0 /100 | #13 | Exceptional 4.7% |
| Immigrants | Korea | 100.0 /100 | #14 | Exceptional 4.7% |
| Chinese | 100.0 /100 | #15 | Exceptional 4.7% |