Immigrants from Southern Europe vs Osage Disability Age 5 to 17
COMPARE
Immigrants from Southern Europe
Osage
Disability Age 5 to 17
Disability Age 5 to 17 Comparison
Immigrants from Southern Europe
Osage
5.6%
DISABILITY AGE 5 TO 17
64.0/ 100
METRIC RATING
163rd/ 347
METRIC RANK
6.5%
DISABILITY AGE 5 TO 17
0.0/ 100
METRIC RATING
323rd/ 347
METRIC RANK
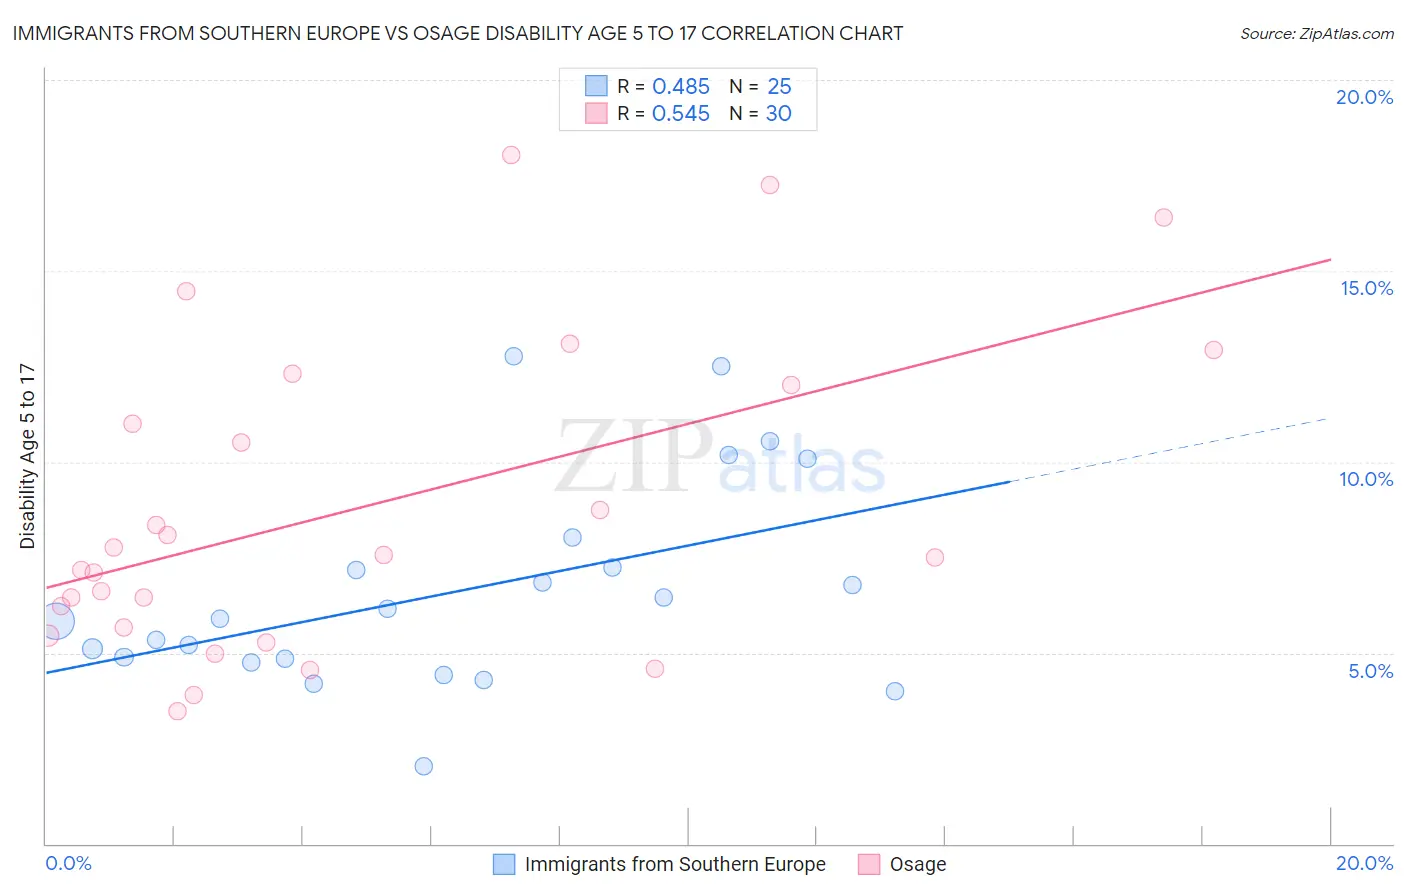
Immigrants from Southern Europe vs Osage Disability Age 5 to 17 Correlation Chart
The statistical analysis conducted on geographies consisting of 398,595,383 people shows a moderate positive correlation between the proportion of Immigrants from Southern Europe and percentage of population with a disability between the ages 5 and 17 in the United States with a correlation coefficient (R) of 0.485 and weighted average of 5.6%. Similarly, the statistical analysis conducted on geographies consisting of 91,613,344 people shows a substantial positive correlation between the proportion of Osage and percentage of population with a disability between the ages 5 and 17 in the United States with a correlation coefficient (R) of 0.545 and weighted average of 6.5%, a difference of 17.2%.
Disability Age 5 to 17 Correlation Summary
| Measurement | Immigrants from Southern Europe | Osage |
| Minimum | 2.0% | 3.5% |
| Maximum | 12.8% | 18.0% |
| Range | 10.7% | 14.5% |
| Mean | 6.6% | 8.8% |
| Median | 5.9% | 7.5% |
| Interquartile 25% (IQ1) | 4.8% | 5.7% |
| Interquartile 75% (IQ3) | 7.6% | 12.0% |
| Interquartile Range (IQR) | 2.8% | 6.4% |
| Standard Deviation (Sample) | 2.7% | 4.1% |
| Standard Deviation (Population) | 2.7% | 4.0% |
Similar Demographics by Disability Age 5 to 17
Demographics Similar to Immigrants from Southern Europe by Disability Age 5 to 17
In terms of disability age 5 to 17, the demographic groups most similar to Immigrants from Southern Europe are Immigrants from Scotland (5.6%, a difference of 0.11%), Lebanese (5.6%, a difference of 0.14%), Zimbabwean (5.5%, a difference of 0.18%), Greek (5.6%, a difference of 0.18%), and Immigrants from Burma/Myanmar (5.6%, a difference of 0.25%).
| Demographics | Rating | Rank | Disability Age 5 to 17 |
| Hawaiians | 78.0 /100 | #156 | Good 5.5% |
| Immigrants | Costa Rica | 77.9 /100 | #157 | Good 5.5% |
| Immigrants | Nepal | 77.1 /100 | #158 | Good 5.5% |
| Immigrants | Zimbabwe | 75.3 /100 | #159 | Good 5.5% |
| South Africans | 73.3 /100 | #160 | Good 5.5% |
| Immigrants | Saudi Arabia | 69.1 /100 | #161 | Good 5.5% |
| Zimbabweans | 67.2 /100 | #162 | Good 5.5% |
| Immigrants | Southern Europe | 64.0 /100 | #163 | Good 5.6% |
| Immigrants | Scotland | 61.9 /100 | #164 | Good 5.6% |
| Lebanese | 61.4 /100 | #165 | Good 5.6% |
| Greeks | 60.6 /100 | #166 | Good 5.6% |
| Immigrants | Burma/Myanmar | 59.3 /100 | #167 | Average 5.6% |
| Iraqis | 56.0 /100 | #168 | Average 5.6% |
| Immigrants | Norway | 55.7 /100 | #169 | Average 5.6% |
| Serbians | 54.0 /100 | #170 | Average 5.6% |
Demographics Similar to Osage by Disability Age 5 to 17
In terms of disability age 5 to 17, the demographic groups most similar to Osage are Slovak (6.5%, a difference of 0.040%), Tohono O'odham (6.5%, a difference of 0.060%), Dominican (6.5%, a difference of 0.080%), American (6.5%, a difference of 0.14%), and Potawatomi (6.5%, a difference of 0.27%).
| Demographics | Rating | Rank | Disability Age 5 to 17 |
| Immigrants | Dominican Republic | 0.0 /100 | #316 | Tragic 6.4% |
| Kiowa | 0.0 /100 | #317 | Tragic 6.4% |
| Comanche | 0.0 /100 | #318 | Tragic 6.4% |
| Delaware | 0.0 /100 | #319 | Tragic 6.5% |
| Africans | 0.0 /100 | #320 | Tragic 6.5% |
| Tohono O'odham | 0.0 /100 | #321 | Tragic 6.5% |
| Slovaks | 0.0 /100 | #322 | Tragic 6.5% |
| Osage | 0.0 /100 | #323 | Tragic 6.5% |
| Dominicans | 0.0 /100 | #324 | Tragic 6.5% |
| Americans | 0.0 /100 | #325 | Tragic 6.5% |
| Potawatomi | 0.0 /100 | #326 | Tragic 6.5% |
| French American Indians | 0.0 /100 | #327 | Tragic 6.6% |
| Pennsylvania Germans | 0.0 /100 | #328 | Tragic 6.6% |
| Blackfeet | 0.0 /100 | #329 | Tragic 6.6% |
| Dutch West Indians | 0.0 /100 | #330 | Tragic 6.7% |