Immigrants from Russia vs Immigrants from Bolivia Disability Age 5 to 17
COMPARE
Immigrants from Russia
Immigrants from Bolivia
Disability Age 5 to 17
Disability Age 5 to 17 Comparison
Immigrants from Russia
Immigrants from Bolivia
5.0%
DISABILITY AGE 5 TO 17
100.0/ 100
METRIC RATING
43rd/ 347
METRIC RANK
4.8%
DISABILITY AGE 5 TO 17
100.0/ 100
METRIC RATING
23rd/ 347
METRIC RANK
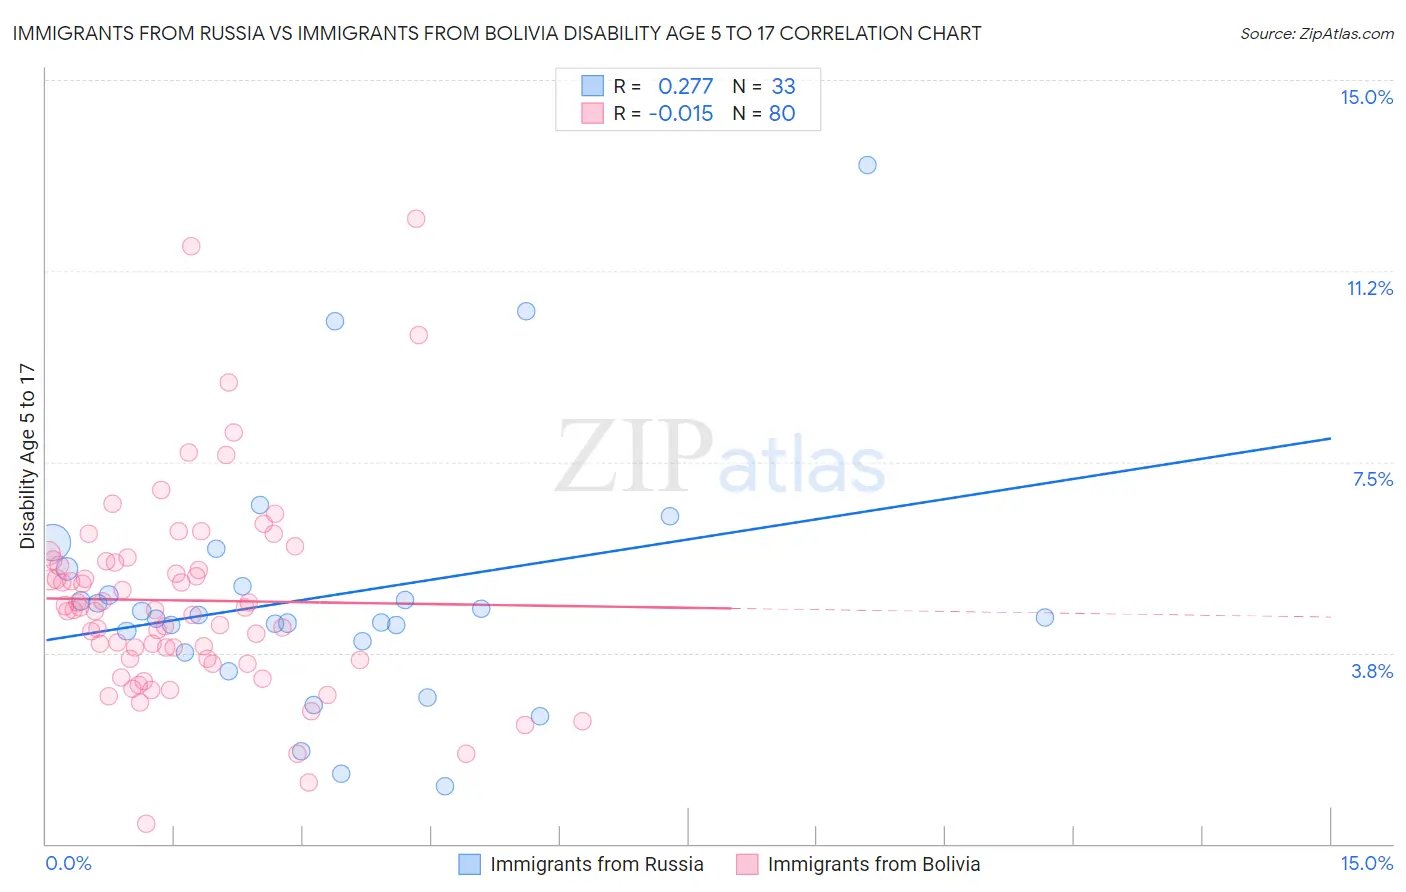
Immigrants from Russia vs Immigrants from Bolivia Disability Age 5 to 17 Correlation Chart
The statistical analysis conducted on geographies consisting of 345,279,670 people shows a weak positive correlation between the proportion of Immigrants from Russia and percentage of population with a disability between the ages 5 and 17 in the United States with a correlation coefficient (R) of 0.277 and weighted average of 5.0%. Similarly, the statistical analysis conducted on geographies consisting of 158,284,084 people shows no correlation between the proportion of Immigrants from Bolivia and percentage of population with a disability between the ages 5 and 17 in the United States with a correlation coefficient (R) of -0.015 and weighted average of 4.8%, a difference of 4.1%.
Disability Age 5 to 17 Correlation Summary
| Measurement | Immigrants from Russia | Immigrants from Bolivia |
| Minimum | 1.1% | 0.40% |
| Maximum | 13.3% | 12.3% |
| Range | 12.2% | 11.9% |
| Mean | 4.9% | 4.8% |
| Median | 4.4% | 4.6% |
| Interquartile 25% (IQ1) | 3.9% | 3.6% |
| Interquartile 75% (IQ3) | 5.2% | 5.5% |
| Interquartile Range (IQR) | 1.4% | 1.9% |
| Standard Deviation (Sample) | 2.5% | 2.0% |
| Standard Deviation (Population) | 2.4% | 2.0% |
Demographics Similar to Immigrants from Russia and Immigrants from Bolivia by Disability Age 5 to 17
In terms of disability age 5 to 17, the demographic groups most similar to Immigrants from Russia are Immigrants from Sri Lanka (5.0%, a difference of 0.38%), Immigrants from Australia (5.0%, a difference of 0.39%), Okinawan (5.0%, a difference of 0.47%), Immigrants from Philippines (5.0%, a difference of 0.55%), and Immigrants from Argentina (5.0%, a difference of 0.55%). Similarly, the demographic groups most similar to Immigrants from Bolivia are Immigrants from Lebanon (4.8%, a difference of 0.15%), Immigrants from Asia (4.8%, a difference of 0.26%), Bhutanese (4.9%, a difference of 1.1%), Taiwanese (4.9%, a difference of 1.7%), and Immigrants from Japan (4.9%, a difference of 1.8%).
| Demographics | Rating | Rank | Disability Age 5 to 17 |
| Immigrants | Bolivia | 100.0 /100 | #23 | Exceptional 4.8% |
| Immigrants | Lebanon | 100.0 /100 | #24 | Exceptional 4.8% |
| Immigrants | Asia | 100.0 /100 | #25 | Exceptional 4.8% |
| Bhutanese | 100.0 /100 | #26 | Exceptional 4.9% |
| Taiwanese | 100.0 /100 | #27 | Exceptional 4.9% |
| Immigrants | Japan | 100.0 /100 | #28 | Exceptional 4.9% |
| Immigrants | Serbia | 100.0 /100 | #29 | Exceptional 4.9% |
| Immigrants | Malaysia | 100.0 /100 | #30 | Exceptional 5.0% |
| Immigrants | Pakistan | 100.0 /100 | #31 | Exceptional 5.0% |
| Soviet Union | 100.0 /100 | #32 | Exceptional 5.0% |
| Immigrants | Indonesia | 100.0 /100 | #33 | Exceptional 5.0% |
| Israelis | 100.0 /100 | #34 | Exceptional 5.0% |
| Bolivians | 100.0 /100 | #35 | Exceptional 5.0% |
| Immigrants | Egypt | 100.0 /100 | #36 | Exceptional 5.0% |
| Immigrants | Belarus | 100.0 /100 | #37 | Exceptional 5.0% |
| Immigrants | Philippines | 100.0 /100 | #38 | Exceptional 5.0% |
| Immigrants | Argentina | 100.0 /100 | #39 | Exceptional 5.0% |
| Okinawans | 100.0 /100 | #40 | Exceptional 5.0% |
| Immigrants | Australia | 100.0 /100 | #41 | Exceptional 5.0% |
| Immigrants | Sri Lanka | 100.0 /100 | #42 | Exceptional 5.0% |
| Immigrants | Russia | 100.0 /100 | #43 | Exceptional 5.0% |