Immigrants from Russia vs Native/Alaskan Disability Age 5 to 17
COMPARE
Immigrants from Russia
Native/Alaskan
Disability Age 5 to 17
Disability Age 5 to 17 Comparison
Immigrants from Russia
Natives/Alaskans
5.0%
DISABILITY AGE 5 TO 17
100.0/ 100
METRIC RATING
43rd/ 347
METRIC RANK
6.3%
DISABILITY AGE 5 TO 17
0.0/ 100
METRIC RATING
305th/ 347
METRIC RANK
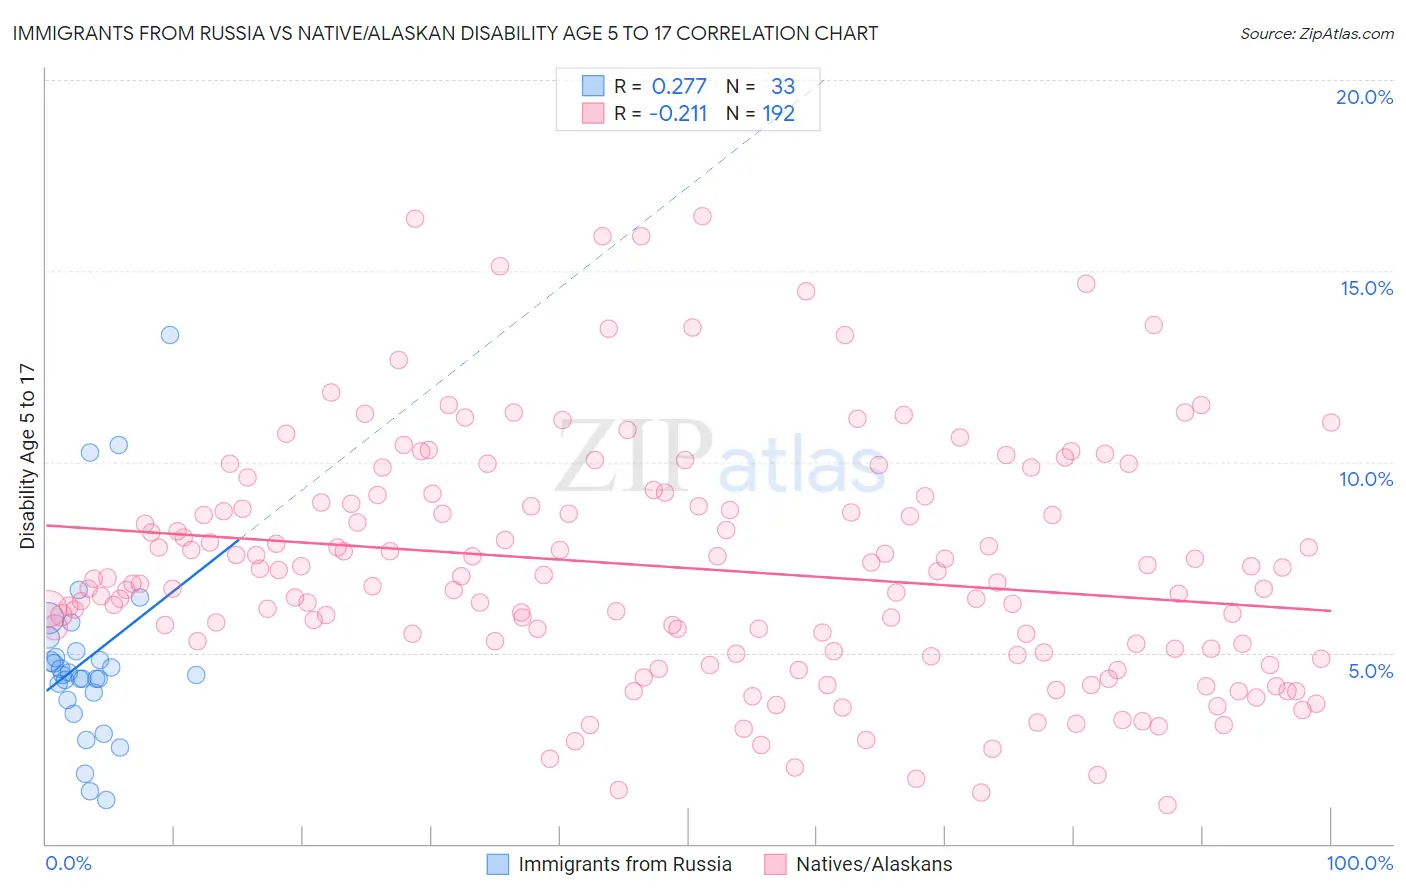
Immigrants from Russia vs Native/Alaskan Disability Age 5 to 17 Correlation Chart
The statistical analysis conducted on geographies consisting of 345,279,670 people shows a weak positive correlation between the proportion of Immigrants from Russia and percentage of population with a disability between the ages 5 and 17 in the United States with a correlation coefficient (R) of 0.277 and weighted average of 5.0%. Similarly, the statistical analysis conducted on geographies consisting of 506,009,662 people shows a weak negative correlation between the proportion of Natives/Alaskans and percentage of population with a disability between the ages 5 and 17 in the United States with a correlation coefficient (R) of -0.211 and weighted average of 6.3%, a difference of 25.2%.
Disability Age 5 to 17 Correlation Summary
| Measurement | Immigrants from Russia | Native/Alaskan |
| Minimum | 1.1% | 1.0% |
| Maximum | 13.3% | 16.4% |
| Range | 12.2% | 15.4% |
| Mean | 4.9% | 7.2% |
| Median | 4.4% | 6.9% |
| Interquartile 25% (IQ1) | 3.9% | 5.1% |
| Interquartile 75% (IQ3) | 5.2% | 8.9% |
| Interquartile Range (IQR) | 1.4% | 3.8% |
| Standard Deviation (Sample) | 2.5% | 3.1% |
| Standard Deviation (Population) | 2.4% | 3.1% |
Similar Demographics by Disability Age 5 to 17
Demographics Similar to Immigrants from Russia by Disability Age 5 to 17
In terms of disability age 5 to 17, the demographic groups most similar to Immigrants from Russia are Egyptian (5.0%, a difference of 0.040%), Tongan (5.0%, a difference of 0.11%), Assyrian/Chaldean/Syriac (5.0%, a difference of 0.18%), Vietnamese (5.1%, a difference of 0.30%), and Immigrants from Sri Lanka (5.0%, a difference of 0.38%).
| Demographics | Rating | Rank | Disability Age 5 to 17 |
| Immigrants | Egypt | 100.0 /100 | #36 | Exceptional 5.0% |
| Immigrants | Belarus | 100.0 /100 | #37 | Exceptional 5.0% |
| Immigrants | Philippines | 100.0 /100 | #38 | Exceptional 5.0% |
| Immigrants | Argentina | 100.0 /100 | #39 | Exceptional 5.0% |
| Okinawans | 100.0 /100 | #40 | Exceptional 5.0% |
| Immigrants | Australia | 100.0 /100 | #41 | Exceptional 5.0% |
| Immigrants | Sri Lanka | 100.0 /100 | #42 | Exceptional 5.0% |
| Immigrants | Russia | 100.0 /100 | #43 | Exceptional 5.0% |
| Egyptians | 100.0 /100 | #44 | Exceptional 5.0% |
| Tongans | 100.0 /100 | #45 | Exceptional 5.0% |
| Assyrians/Chaldeans/Syriacs | 100.0 /100 | #46 | Exceptional 5.0% |
| Vietnamese | 100.0 /100 | #47 | Exceptional 5.1% |
| Koreans | 100.0 /100 | #48 | Exceptional 5.1% |
| Immigrants | Western Asia | 100.0 /100 | #49 | Exceptional 5.1% |
| Argentineans | 99.9 /100 | #50 | Exceptional 5.1% |
Demographics Similar to Natives/Alaskans by Disability Age 5 to 17
In terms of disability age 5 to 17, the demographic groups most similar to Natives/Alaskans are Nonimmigrants (6.3%, a difference of 0.10%), Senegalese (6.3%, a difference of 0.14%), Yakama (6.3%, a difference of 0.22%), Bahamian (6.3%, a difference of 0.24%), and Celtic (6.3%, a difference of 0.33%).
| Demographics | Rating | Rank | Disability Age 5 to 17 |
| Lumbee | 0.0 /100 | #298 | Tragic 6.2% |
| Welsh | 0.0 /100 | #299 | Tragic 6.3% |
| Carpatho Rusyns | 0.0 /100 | #300 | Tragic 6.3% |
| U.S. Virgin Islanders | 0.0 /100 | #301 | Tragic 6.3% |
| Celtics | 0.0 /100 | #302 | Tragic 6.3% |
| Yakama | 0.0 /100 | #303 | Tragic 6.3% |
| Senegalese | 0.0 /100 | #304 | Tragic 6.3% |
| Natives/Alaskans | 0.0 /100 | #305 | Tragic 6.3% |
| Immigrants | Nonimmigrants | 0.0 /100 | #306 | Tragic 6.3% |
| Bahamians | 0.0 /100 | #307 | Tragic 6.3% |
| Scotch-Irish | 0.0 /100 | #308 | Tragic 6.3% |
| Hmong | 0.0 /100 | #309 | Tragic 6.3% |
| Alaskan Athabascans | 0.0 /100 | #310 | Tragic 6.3% |
| Immigrants | Dominica | 0.0 /100 | #311 | Tragic 6.3% |
| Bermudans | 0.0 /100 | #312 | Tragic 6.4% |