Immigrants from Russia vs Immigrants from Greece Disability Age 5 to 17
COMPARE
Immigrants from Russia
Immigrants from Greece
Disability Age 5 to 17
Disability Age 5 to 17 Comparison
Immigrants from Russia
Immigrants from Greece
5.0%
DISABILITY AGE 5 TO 17
100.0/ 100
METRIC RATING
43rd/ 347
METRIC RANK
5.2%
DISABILITY AGE 5 TO 17
99.8/ 100
METRIC RATING
65th/ 347
METRIC RANK
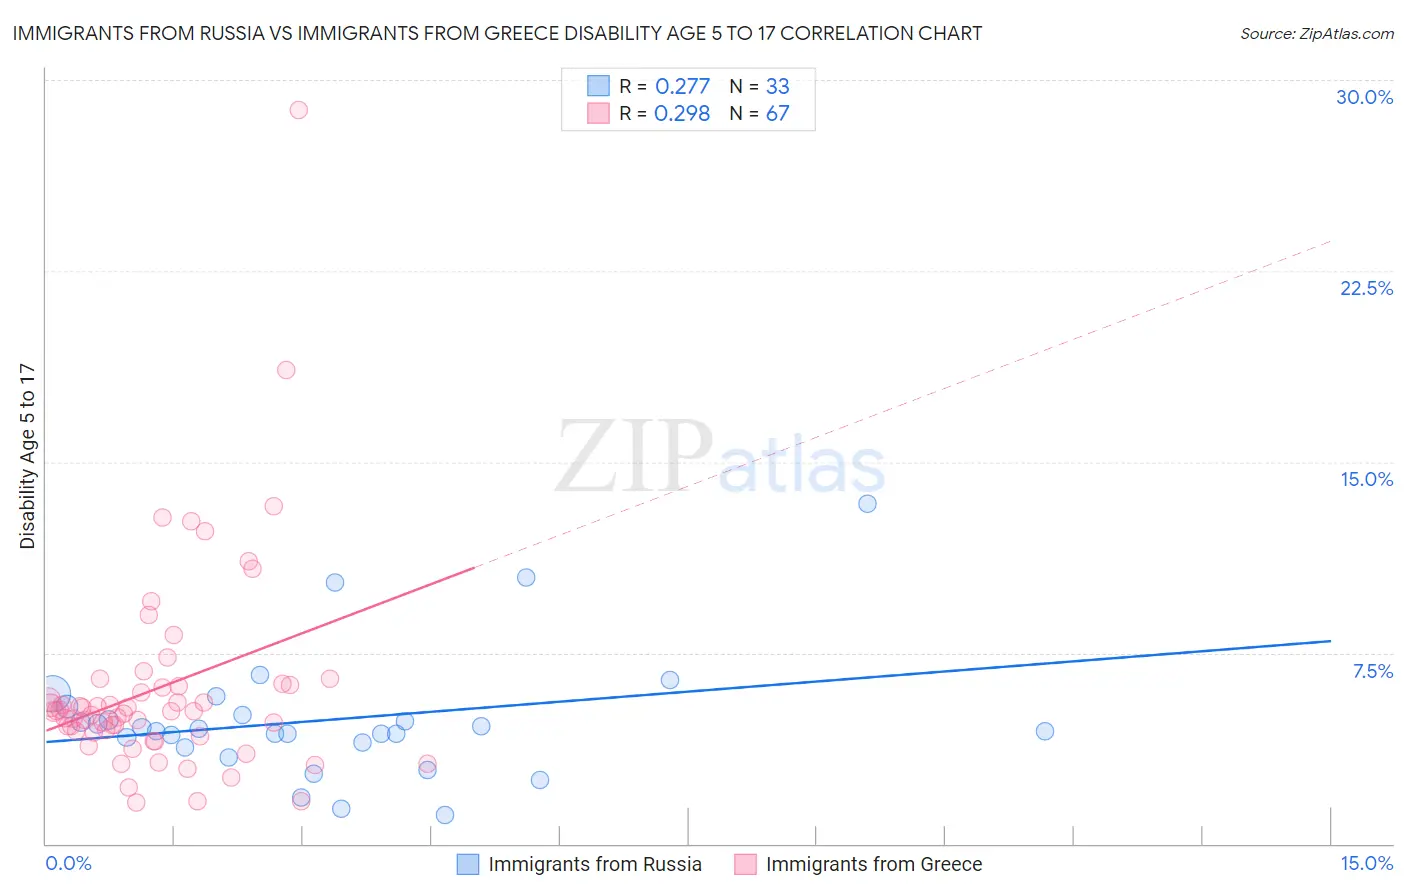
Immigrants from Russia vs Immigrants from Greece Disability Age 5 to 17 Correlation Chart
The statistical analysis conducted on geographies consisting of 345,279,670 people shows a weak positive correlation between the proportion of Immigrants from Russia and percentage of population with a disability between the ages 5 and 17 in the United States with a correlation coefficient (R) of 0.277 and weighted average of 5.0%. Similarly, the statistical analysis conducted on geographies consisting of 215,473,396 people shows a weak positive correlation between the proportion of Immigrants from Greece and percentage of population with a disability between the ages 5 and 17 in the United States with a correlation coefficient (R) of 0.298 and weighted average of 5.2%, a difference of 2.8%.
Disability Age 5 to 17 Correlation Summary
| Measurement | Immigrants from Russia | Immigrants from Greece |
| Minimum | 1.1% | 1.6% |
| Maximum | 13.3% | 28.8% |
| Range | 12.2% | 27.2% |
| Mean | 4.9% | 6.1% |
| Median | 4.4% | 5.2% |
| Interquartile 25% (IQ1) | 3.9% | 4.4% |
| Interquartile 75% (IQ3) | 5.2% | 6.2% |
| Interquartile Range (IQR) | 1.4% | 1.9% |
| Standard Deviation (Sample) | 2.5% | 4.1% |
| Standard Deviation (Population) | 2.4% | 4.1% |
Similar Demographics by Disability Age 5 to 17
Demographics Similar to Immigrants from Russia by Disability Age 5 to 17
In terms of disability age 5 to 17, the demographic groups most similar to Immigrants from Russia are Egyptian (5.0%, a difference of 0.040%), Tongan (5.0%, a difference of 0.11%), Assyrian/Chaldean/Syriac (5.0%, a difference of 0.18%), Vietnamese (5.1%, a difference of 0.30%), and Immigrants from Sri Lanka (5.0%, a difference of 0.38%).
| Demographics | Rating | Rank | Disability Age 5 to 17 |
| Immigrants | Egypt | 100.0 /100 | #36 | Exceptional 5.0% |
| Immigrants | Belarus | 100.0 /100 | #37 | Exceptional 5.0% |
| Immigrants | Philippines | 100.0 /100 | #38 | Exceptional 5.0% |
| Immigrants | Argentina | 100.0 /100 | #39 | Exceptional 5.0% |
| Okinawans | 100.0 /100 | #40 | Exceptional 5.0% |
| Immigrants | Australia | 100.0 /100 | #41 | Exceptional 5.0% |
| Immigrants | Sri Lanka | 100.0 /100 | #42 | Exceptional 5.0% |
| Immigrants | Russia | 100.0 /100 | #43 | Exceptional 5.0% |
| Egyptians | 100.0 /100 | #44 | Exceptional 5.0% |
| Tongans | 100.0 /100 | #45 | Exceptional 5.0% |
| Assyrians/Chaldeans/Syriacs | 100.0 /100 | #46 | Exceptional 5.0% |
| Vietnamese | 100.0 /100 | #47 | Exceptional 5.1% |
| Koreans | 100.0 /100 | #48 | Exceptional 5.1% |
| Immigrants | Western Asia | 100.0 /100 | #49 | Exceptional 5.1% |
| Argentineans | 99.9 /100 | #50 | Exceptional 5.1% |
Demographics Similar to Immigrants from Greece by Disability Age 5 to 17
In terms of disability age 5 to 17, the demographic groups most similar to Immigrants from Greece are Immigrants from South Eastern Asia (5.2%, a difference of 0.010%), Immigrants from Bangladesh (5.2%, a difference of 0.040%), Palestinian (5.2%, a difference of 0.040%), Macedonian (5.2%, a difference of 0.070%), and Immigrants from Ireland (5.2%, a difference of 0.15%).
| Demographics | Rating | Rank | Disability Age 5 to 17 |
| Immigrants | Ukraine | 99.9 /100 | #58 | Exceptional 5.1% |
| Immigrants | North Macedonia | 99.9 /100 | #59 | Exceptional 5.1% |
| Immigrants | Eastern Europe | 99.9 /100 | #60 | Exceptional 5.1% |
| Immigrants | Switzerland | 99.8 /100 | #61 | Exceptional 5.2% |
| Immigrants | Ireland | 99.8 /100 | #62 | Exceptional 5.2% |
| Immigrants | Bangladesh | 99.8 /100 | #63 | Exceptional 5.2% |
| Immigrants | South Eastern Asia | 99.8 /100 | #64 | Exceptional 5.2% |
| Immigrants | Greece | 99.8 /100 | #65 | Exceptional 5.2% |
| Palestinians | 99.8 /100 | #66 | Exceptional 5.2% |
| Macedonians | 99.8 /100 | #67 | Exceptional 5.2% |
| Immigrants | Syria | 99.7 /100 | #68 | Exceptional 5.2% |
| Guyanese | 99.7 /100 | #69 | Exceptional 5.2% |
| Immigrants | Belgium | 99.7 /100 | #70 | Exceptional 5.2% |
| Jordanians | 99.7 /100 | #71 | Exceptional 5.2% |
| Immigrants | Vietnam | 99.7 /100 | #72 | Exceptional 5.2% |