Immigrants from Romania vs Thai Disability Age 5 to 17
COMPARE
Immigrants from Romania
Thai
Disability Age 5 to 17
Disability Age 5 to 17 Comparison
Immigrants from Romania
Thais
5.2%
DISABILITY AGE 5 TO 17
99.7/ 100
METRIC RATING
74th/ 347
METRIC RANK
4.7%
DISABILITY AGE 5 TO 17
100.0/ 100
METRIC RATING
13th/ 347
METRIC RANK
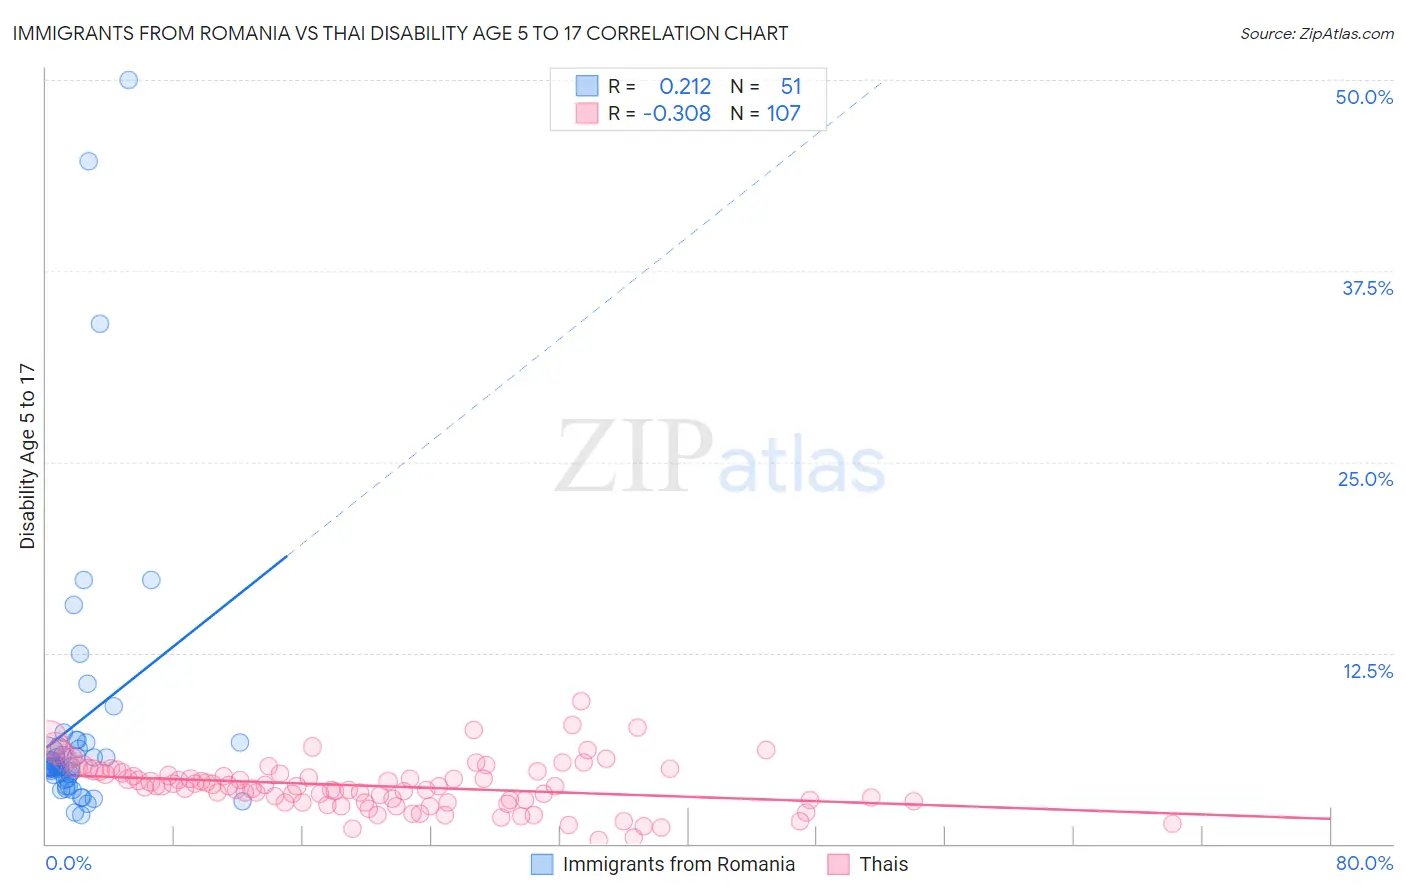
Immigrants from Romania vs Thai Disability Age 5 to 17 Correlation Chart
The statistical analysis conducted on geographies consisting of 255,693,351 people shows a weak positive correlation between the proportion of Immigrants from Romania and percentage of population with a disability between the ages 5 and 17 in the United States with a correlation coefficient (R) of 0.212 and weighted average of 5.2%. Similarly, the statistical analysis conducted on geographies consisting of 470,579,887 people shows a mild negative correlation between the proportion of Thais and percentage of population with a disability between the ages 5 and 17 in the United States with a correlation coefficient (R) of -0.308 and weighted average of 4.7%, a difference of 11.8%.
Disability Age 5 to 17 Correlation Summary
| Measurement | Immigrants from Romania | Thai |
| Minimum | 1.9% | 0.21% |
| Maximum | 50.0% | 9.3% |
| Range | 48.1% | 9.1% |
| Mean | 8.1% | 3.8% |
| Median | 5.2% | 3.8% |
| Interquartile 25% (IQ1) | 4.2% | 2.7% |
| Interquartile 75% (IQ3) | 6.7% | 4.7% |
| Interquartile Range (IQR) | 2.5% | 2.0% |
| Standard Deviation (Sample) | 9.5% | 1.6% |
| Standard Deviation (Population) | 9.5% | 1.6% |
Similar Demographics by Disability Age 5 to 17
Demographics Similar to Immigrants from Romania by Disability Age 5 to 17
In terms of disability age 5 to 17, the demographic groups most similar to Immigrants from Romania are Immigrants from Czechoslovakia (5.2%, a difference of 0.070%), Immigrants from Vietnam (5.2%, a difference of 0.090%), Jordanian (5.2%, a difference of 0.12%), Immigrants from Belgium (5.2%, a difference of 0.16%), and Guyanese (5.2%, a difference of 0.20%).
| Demographics | Rating | Rank | Disability Age 5 to 17 |
| Macedonians | 99.8 /100 | #67 | Exceptional 5.2% |
| Immigrants | Syria | 99.7 /100 | #68 | Exceptional 5.2% |
| Guyanese | 99.7 /100 | #69 | Exceptional 5.2% |
| Immigrants | Belgium | 99.7 /100 | #70 | Exceptional 5.2% |
| Jordanians | 99.7 /100 | #71 | Exceptional 5.2% |
| Immigrants | Vietnam | 99.7 /100 | #72 | Exceptional 5.2% |
| Immigrants | Czechoslovakia | 99.7 /100 | #73 | Exceptional 5.2% |
| Immigrants | Romania | 99.7 /100 | #74 | Exceptional 5.2% |
| Immigrants | Moldova | 99.6 /100 | #75 | Exceptional 5.2% |
| Immigrants | Guyana | 99.6 /100 | #76 | Exceptional 5.2% |
| Immigrants | Kazakhstan | 99.6 /100 | #77 | Exceptional 5.2% |
| Immigrants | Cuba | 99.6 /100 | #78 | Exceptional 5.2% |
| Afghans | 99.6 /100 | #79 | Exceptional 5.2% |
| Sri Lankans | 99.6 /100 | #80 | Exceptional 5.2% |
| Native Hawaiians | 99.6 /100 | #81 | Exceptional 5.2% |
Demographics Similar to Thais by Disability Age 5 to 17
In terms of disability age 5 to 17, the demographic groups most similar to Thais are Immigrants from Korea (4.7%, a difference of 0.70%), Chinese (4.7%, a difference of 0.91%), Iranian (4.6%, a difference of 1.1%), Armenian (4.6%, a difference of 1.3%), and Immigrants from Singapore (4.7%, a difference of 1.3%).
| Demographics | Rating | Rank | Disability Age 5 to 17 |
| Immigrants | Israel | 100.0 /100 | #6 | Exceptional 4.5% |
| Immigrants | China | 100.0 /100 | #7 | Exceptional 4.5% |
| Indians (Asian) | 100.0 /100 | #8 | Exceptional 4.6% |
| Immigrants | Eastern Asia | 100.0 /100 | #9 | Exceptional 4.6% |
| Immigrants | India | 100.0 /100 | #10 | Exceptional 4.6% |
| Armenians | 100.0 /100 | #11 | Exceptional 4.6% |
| Iranians | 100.0 /100 | #12 | Exceptional 4.6% |
| Thais | 100.0 /100 | #13 | Exceptional 4.7% |
| Immigrants | Korea | 100.0 /100 | #14 | Exceptional 4.7% |
| Chinese | 100.0 /100 | #15 | Exceptional 4.7% |
| Immigrants | Singapore | 100.0 /100 | #16 | Exceptional 4.7% |
| Arapaho | 100.0 /100 | #17 | Exceptional 4.7% |
| Immigrants | South Central Asia | 100.0 /100 | #18 | Exceptional 4.7% |
| Immigrants | Uzbekistan | 100.0 /100 | #19 | Exceptional 4.8% |
| Burmese | 100.0 /100 | #20 | Exceptional 4.8% |