Immigrants from Romania vs Immigrants from North America Disability Age 5 to 17
COMPARE
Immigrants from Romania
Immigrants from North America
Disability Age 5 to 17
Disability Age 5 to 17 Comparison
Immigrants from Romania
Immigrants from North America
5.2%
DISABILITY AGE 5 TO 17
99.7/ 100
METRIC RATING
74th/ 347
METRIC RANK
5.7%
DISABILITY AGE 5 TO 17
23.1/ 100
METRIC RATING
197th/ 347
METRIC RANK
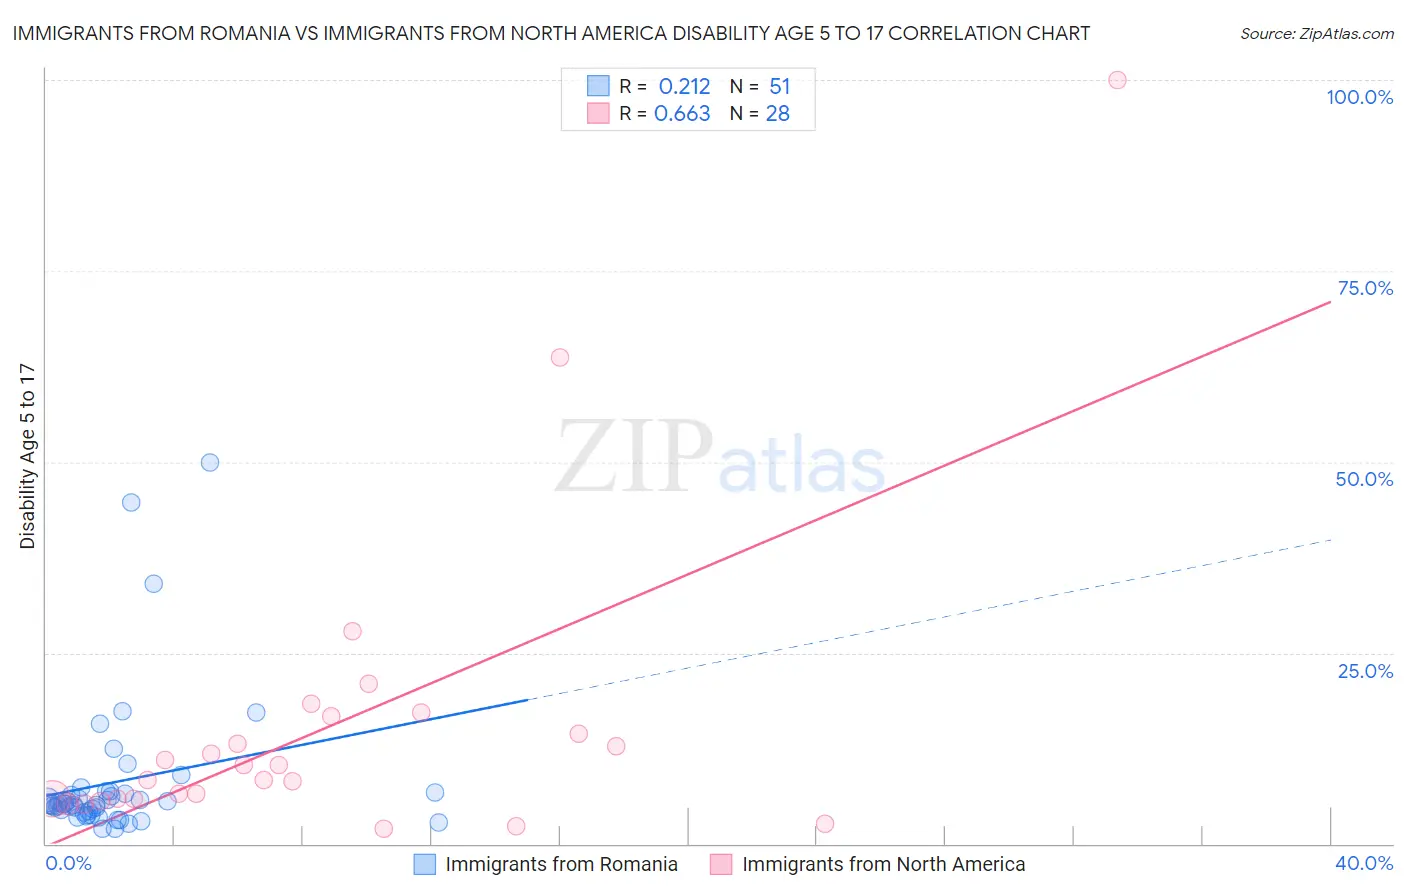
Immigrants from Romania vs Immigrants from North America Disability Age 5 to 17 Correlation Chart
The statistical analysis conducted on geographies consisting of 255,693,351 people shows a weak positive correlation between the proportion of Immigrants from Romania and percentage of population with a disability between the ages 5 and 17 in the United States with a correlation coefficient (R) of 0.212 and weighted average of 5.2%. Similarly, the statistical analysis conducted on geographies consisting of 456,706,371 people shows a significant positive correlation between the proportion of Immigrants from North America and percentage of population with a disability between the ages 5 and 17 in the United States with a correlation coefficient (R) of 0.663 and weighted average of 5.7%, a difference of 9.2%.
Disability Age 5 to 17 Correlation Summary
| Measurement | Immigrants from Romania | Immigrants from North America |
| Minimum | 1.9% | 1.9% |
| Maximum | 50.0% | 100.0% |
| Range | 48.1% | 98.1% |
| Mean | 8.1% | 15.2% |
| Median | 5.2% | 9.3% |
| Interquartile 25% (IQ1) | 4.2% | 5.9% |
| Interquartile 75% (IQ3) | 6.7% | 15.6% |
| Interquartile Range (IQR) | 2.5% | 9.7% |
| Standard Deviation (Sample) | 9.5% | 20.3% |
| Standard Deviation (Population) | 9.5% | 20.0% |
Similar Demographics by Disability Age 5 to 17
Demographics Similar to Immigrants from Romania by Disability Age 5 to 17
In terms of disability age 5 to 17, the demographic groups most similar to Immigrants from Romania are Immigrants from Czechoslovakia (5.2%, a difference of 0.070%), Immigrants from Vietnam (5.2%, a difference of 0.090%), Jordanian (5.2%, a difference of 0.12%), Immigrants from Belgium (5.2%, a difference of 0.16%), and Guyanese (5.2%, a difference of 0.20%).
| Demographics | Rating | Rank | Disability Age 5 to 17 |
| Macedonians | 99.8 /100 | #67 | Exceptional 5.2% |
| Immigrants | Syria | 99.7 /100 | #68 | Exceptional 5.2% |
| Guyanese | 99.7 /100 | #69 | Exceptional 5.2% |
| Immigrants | Belgium | 99.7 /100 | #70 | Exceptional 5.2% |
| Jordanians | 99.7 /100 | #71 | Exceptional 5.2% |
| Immigrants | Vietnam | 99.7 /100 | #72 | Exceptional 5.2% |
| Immigrants | Czechoslovakia | 99.7 /100 | #73 | Exceptional 5.2% |
| Immigrants | Romania | 99.7 /100 | #74 | Exceptional 5.2% |
| Immigrants | Moldova | 99.6 /100 | #75 | Exceptional 5.2% |
| Immigrants | Guyana | 99.6 /100 | #76 | Exceptional 5.2% |
| Immigrants | Kazakhstan | 99.6 /100 | #77 | Exceptional 5.2% |
| Immigrants | Cuba | 99.6 /100 | #78 | Exceptional 5.2% |
| Afghans | 99.6 /100 | #79 | Exceptional 5.2% |
| Sri Lankans | 99.6 /100 | #80 | Exceptional 5.2% |
| Native Hawaiians | 99.6 /100 | #81 | Exceptional 5.2% |
Demographics Similar to Immigrants from North America by Disability Age 5 to 17
In terms of disability age 5 to 17, the demographic groups most similar to Immigrants from North America are Inupiat (5.7%, a difference of 0.010%), Immigrants from Nigeria (5.7%, a difference of 0.020%), Croatian (5.7%, a difference of 0.030%), Norwegian (5.7%, a difference of 0.16%), and Immigrants from Canada (5.7%, a difference of 0.19%).
| Demographics | Rating | Rank | Disability Age 5 to 17 |
| Immigrants | Eastern Africa | 27.3 /100 | #190 | Fair 5.7% |
| Danes | 26.5 /100 | #191 | Fair 5.7% |
| Immigrants | Bosnia and Herzegovina | 26.3 /100 | #192 | Fair 5.7% |
| Immigrants | Canada | 26.1 /100 | #193 | Fair 5.7% |
| Croatians | 23.6 /100 | #194 | Fair 5.7% |
| Immigrants | Nigeria | 23.4 /100 | #195 | Fair 5.7% |
| Inupiat | 23.3 /100 | #196 | Fair 5.7% |
| Immigrants | North America | 23.1 /100 | #197 | Fair 5.7% |
| Norwegians | 20.9 /100 | #198 | Fair 5.7% |
| Northern Europeans | 15.2 /100 | #199 | Poor 5.7% |
| Icelanders | 14.6 /100 | #200 | Poor 5.7% |
| Basques | 13.7 /100 | #201 | Poor 5.7% |
| Austrians | 13.2 /100 | #202 | Poor 5.7% |
| Spanish American Indians | 12.8 /100 | #203 | Poor 5.7% |
| Paiute | 11.2 /100 | #204 | Poor 5.7% |