European Disability
COMPARE
European
Select to Compare
Disability
European Disability
12.3%
DISABILITY
1.4/ 100
METRIC RATING
251st/ 347
METRIC RANK
European Disability Correlation Chart
The statistical analysis conducted on geographies consisting of 561,707,574 people shows a weak positive correlation between the proportion of Europeans and percentage of population with a disability in the United States with a correlation coefficient (R) of 0.227 and weighted average of 12.3%. On average, for every 1% (one percent) increase in Europeans within a typical geography, there is an increase of 0.13% in percentage of population with a disability.
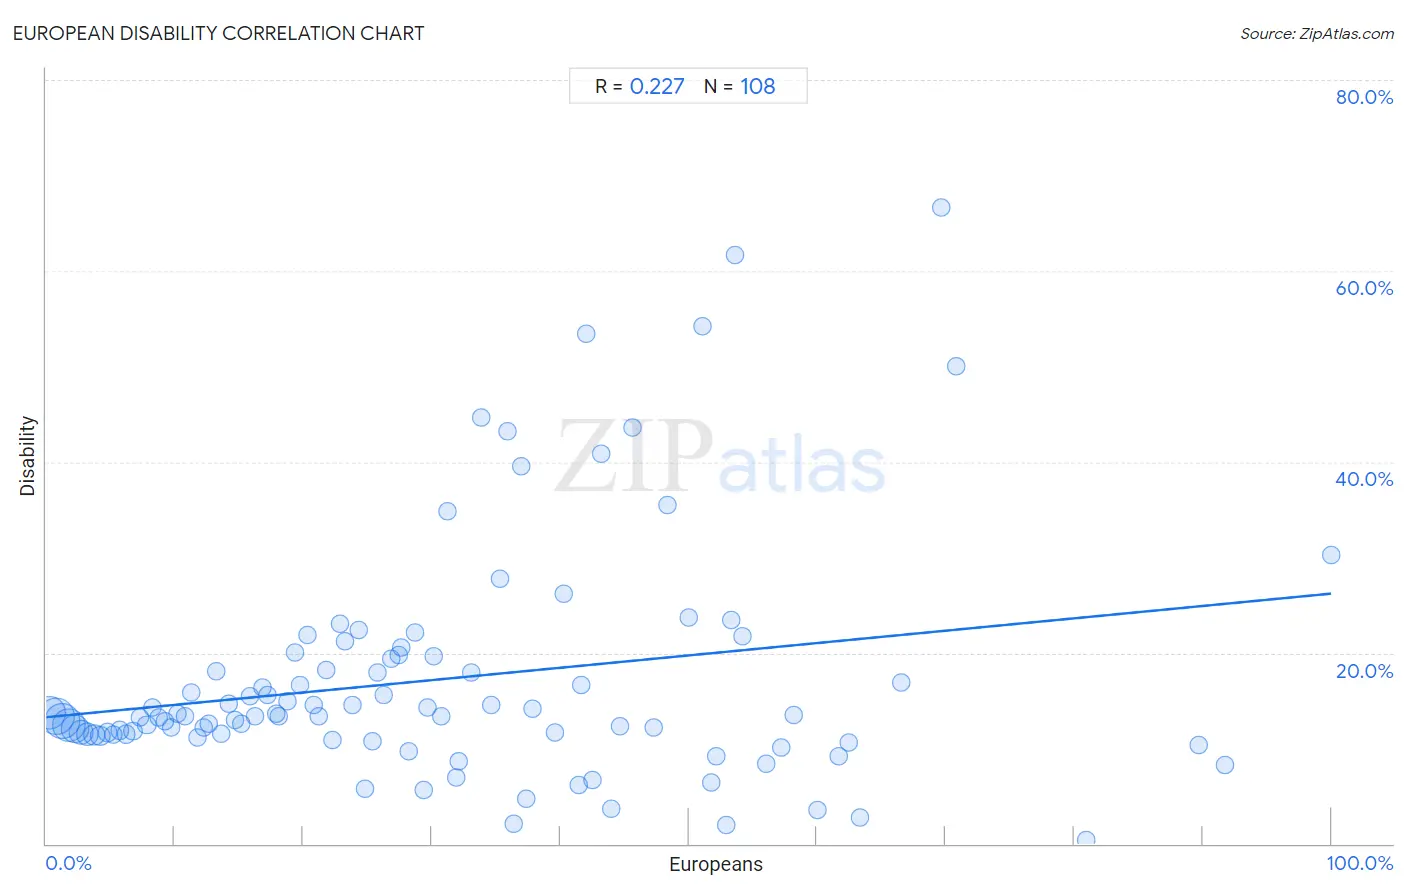
It is essential to understand that the correlation between the percentage of Europeans and percentage of population with a disability does not imply a direct cause-and-effect relationship. It remains uncertain whether the presence of Europeans influences an upward or downward trend in the level of percentage of population with a disability within an area, or if Europeans simply ended up residing in those areas with higher or lower levels of percentage of population with a disability due to other factors.
Demographics Similar to Europeans by Disability
In terms of disability, the demographic groups most similar to Europeans are Subsaharan African (12.3%, a difference of 0.0%), Carpatho Rusyn (12.3%, a difference of 0.010%), Guamanian/Chamorro (12.3%, a difference of 0.020%), Indonesian (12.2%, a difference of 0.060%), and Swiss (12.2%, a difference of 0.090%).
| Demographics | Rating | Rank | Disability |
| Basques | 1.5 /100 | #244 | Tragic 12.2% |
| Liberians | 1.5 /100 | #245 | Tragic 12.2% |
| Swiss | 1.5 /100 | #246 | Tragic 12.2% |
| Indonesians | 1.4 /100 | #247 | Tragic 12.2% |
| Guamanians/Chamorros | 1.4 /100 | #248 | Tragic 12.3% |
| Carpatho Rusyns | 1.4 /100 | #249 | Tragic 12.3% |
| Sub-Saharan Africans | 1.4 /100 | #250 | Tragic 12.3% |
| Europeans | 1.4 /100 | #251 | Tragic 12.3% |
| Bermudans | 1.1 /100 | #252 | Tragic 12.3% |
| Belgians | 0.8 /100 | #253 | Tragic 12.3% |
| German Russians | 0.8 /100 | #254 | Tragic 12.3% |
| Slovenes | 0.6 /100 | #255 | Tragic 12.4% |
| Immigrants from Dominica | 0.6 /100 | #256 | Tragic 12.4% |
| Immigrants from Laos | 0.5 /100 | #257 | Tragic 12.4% |
| Slavs | 0.5 /100 | #258 | Tragic 12.4% |
European Disability Correlation Summary
| Measurement | European Data | Disability Data |
| Minimum | 0.27% | 0.41% |
| Maximum | 100.0% | 66.7% |
| Range | 99.7% | 66.3% |
| Mean | 30.6% | 17.2% |
| Median | 27.1% | 13.4% |
| Interquartile 25% (IQ1) | 13.5% | 11.4% |
| Interquartile 75% (IQ3) | 43.6% | 19.6% |
| Interquartile Range (IQR) | 30.1% | 8.1% |
| Standard Deviation (Sample) | 21.7% | 12.4% |
| Standard Deviation (Population) | 21.6% | 12.3% |
Correlation Details
| European Percentile | Sample Size | Disability |
[ 0.0% - 0.5% ] 0.27% | 85,164,987 | 13.7% |
[ 0.5% - 1.0% ] 0.76% | 110,464,530 | 13.4% |
[ 1.0% - 1.5% ] 1.25% | 106,151,130 | 12.9% |
[ 1.5% - 2.0% ] 1.73% | 87,072,175 | 12.4% |
[ 2.0% - 2.5% ] 2.23% | 58,755,147 | 12.0% |
[ 2.5% - 3.0% ] 2.73% | 39,783,157 | 11.7% |
[ 3.0% - 3.5% ] 3.23% | 23,619,049 | 11.5% |
[ 3.5% - 4.0% ] 3.74% | 15,617,564 | 11.5% |
[ 4.0% - 4.5% ] 4.20% | 11,509,888 | 11.3% |
[ 4.5% - 5.0% ] 4.73% | 6,883,077 | 11.6% |
[ 5.0% - 5.5% ] 5.23% | 4,985,241 | 11.4% |
[ 5.5% - 6.0% ] 5.75% | 2,586,160 | 11.9% |
[ 6.0% - 6.5% ] 6.24% | 1,997,745 | 11.5% |
[ 6.5% - 7.0% ] 6.74% | 1,758,413 | 11.8% |
[ 7.0% - 7.5% ] 7.25% | 839,471 | 13.2% |
[ 7.5% - 8.0% ] 7.82% | 873,966 | 12.5% |
[ 8.0% - 8.5% ] 8.28% | 577,362 | 14.2% |
[ 8.5% - 9.0% ] 8.76% | 407,462 | 13.3% |
[ 9.0% - 9.5% ] 9.20% | 416,476 | 12.8% |
[ 9.5% - 10.0% ] 9.72% | 495,969 | 12.2% |
[ 10.0% - 10.5% ] 10.19% | 243,090 | 13.6% |
[ 10.5% - 11.0% ] 10.78% | 138,040 | 13.4% |
[ 11.0% - 11.5% ] 11.24% | 159,449 | 15.8% |
[ 11.5% - 12.0% ] 11.81% | 116,842 | 11.2% |
[ 12.0% - 12.5% ] 12.29% | 115,445 | 12.2% |
[ 12.5% - 13.0% ] 12.64% | 140,409 | 12.6% |
[ 13.0% - 13.5% ] 13.25% | 48,195 | 18.1% |
[ 13.5% - 14.0% ] 13.66% | 174,691 | 11.5% |
[ 14.0% - 14.5% ] 14.20% | 49,122 | 14.6% |
[ 14.5% - 15.0% ] 14.66% | 96,049 | 12.9% |
[ 15.0% - 15.5% ] 15.22% | 75,387 | 12.6% |
[ 15.5% - 16.0% ] 15.82% | 74,515 | 15.4% |
[ 16.0% - 16.5% ] 16.24% | 12,725 | 13.4% |
[ 16.5% - 17.0% ] 16.83% | 46,575 | 16.3% |
[ 17.0% - 17.5% ] 17.22% | 37,725 | 15.6% |
[ 17.5% - 18.0% ] 17.87% | 41,889 | 13.7% |
[ 18.0% - 18.5% ] 18.13% | 24,723 | 13.3% |
[ 18.5% - 19.0% ] 18.80% | 13,841 | 14.9% |
[ 19.0% - 19.5% ] 19.36% | 15,874 | 20.0% |
[ 19.5% - 20.0% ] 19.78% | 9,221 | 16.6% |
[ 20.0% - 20.5% ] 20.29% | 7,964 | 21.9% |
[ 20.5% - 21.0% ] 20.78% | 6,391 | 14.6% |
[ 21.0% - 21.5% ] 21.23% | 16,685 | 13.3% |
[ 21.5% - 22.0% ] 21.76% | 13,173 | 18.1% |
[ 22.0% - 22.5% ] 22.24% | 6,115 | 10.9% |
[ 22.5% - 23.0% ] 22.82% | 3,229 | 23.0% |
[ 23.0% - 23.5% ] 23.27% | 4,478 | 21.3% |
[ 23.5% - 24.0% ] 23.84% | 2,072 | 14.5% |
[ 24.0% - 24.5% ] 24.32% | 3,717 | 22.3% |
[ 24.5% - 25.0% ] 24.82% | 1,402 | 5.8% |
[ 25.0% - 25.5% ] 25.35% | 8,819 | 10.8% |
[ 25.5% - 26.0% ] 25.74% | 4,207 | 17.9% |
[ 26.0% - 26.5% ] 26.23% | 877 | 15.6% |
[ 26.5% - 27.0% ] 26.80% | 1,787 | 19.4% |
[ 27.0% - 27.5% ] 27.42% | 952 | 19.7% |
[ 27.5% - 28.0% ] 27.66% | 1,298 | 20.6% |
[ 28.0% - 28.5% ] 28.16% | 3,231 | 9.7% |
[ 28.5% - 29.0% ] 28.74% | 2,119 | 22.1% |
[ 29.0% - 29.5% ] 29.35% | 920 | 5.7% |
[ 29.5% - 30.0% ] 29.65% | 1,619 | 14.3% |
[ 30.0% - 30.5% ] 30.16% | 1,472 | 19.7% |
[ 30.5% - 31.0% ] 30.78% | 2,791 | 13.4% |
[ 31.0% - 31.5% ] 31.18% | 1,408 | 34.8% |
[ 31.5% - 32.0% ] 31.90% | 116 | 6.9% |
[ 32.0% - 32.5% ] 32.14% | 1,061 | 8.7% |
[ 33.0% - 33.5% ] 33.09% | 677 | 17.9% |
[ 33.5% - 34.0% ] 33.85% | 65 | 44.6% |
[ 34.5% - 35.0% ] 34.65% | 3,469 | 14.6% |
[ 35.0% - 35.5% ] 35.28% | 547 | 27.8% |
[ 35.5% - 36.0% ] 35.85% | 569 | 43.2% |
[ 36.0% - 36.5% ] 36.34% | 388 | 2.1% |
[ 36.5% - 37.0% ] 36.95% | 617 | 39.5% |
[ 37.0% - 37.5% ] 37.38% | 107 | 4.7% |
[ 37.5% - 38.0% ] 37.83% | 608 | 14.1% |
[ 39.5% - 40.0% ] 39.64% | 111 | 11.7% |
[ 40.0% - 40.5% ] 40.29% | 206 | 26.2% |
[ 41.0% - 41.5% ] 41.46% | 82 | 6.1% |
[ 41.5% - 42.0% ] 41.67% | 120 | 16.7% |
[ 42.0% - 42.5% ] 42.05% | 88 | 53.4% |
[ 42.5% - 43.0% ] 42.55% | 416 | 6.7% |
[ 43.0% - 43.5% ] 43.18% | 44 | 40.9% |
[ 43.5% - 44.0% ] 43.95% | 248 | 3.6% |
[ 44.5% - 45.0% ] 44.61% | 946 | 12.4% |
[ 45.5% - 46.0% ] 45.61% | 1,002 | 43.6% |
[ 47.0% - 47.5% ] 47.31% | 484 | 12.2% |
[ 48.0% - 48.5% ] 48.35% | 242 | 35.5% |
[ 50.0% - 50.5% ] 50.00% | 422 | 23.7% |
[ 51.0% - 51.5% ] 51.04% | 96 | 54.2% |
[ 51.5% - 52.0% ] 51.72% | 203 | 6.4% |
[ 52.0% - 52.5% ] 52.16% | 347 | 9.2% |
[ 52.5% - 53.0% ] 52.94% | 51 | 2.0% |
[ 53.0% - 53.5% ] 53.33% | 420 | 23.4% |
[ 53.5% - 54.0% ] 53.57% | 112 | 61.6% |
[ 54.0% - 54.5% ] 54.19% | 179 | 21.8% |
[ 56.0% - 56.5% ] 56.02% | 166 | 8.4% |
[ 57.0% - 57.5% ] 57.19% | 668 | 10.0% |
[ 58.0% - 58.5% ] 58.21% | 67 | 13.4% |
[ 60.0% - 60.5% ] 60.00% | 725 | 3.6% |
[ 61.5% - 62.0% ] 61.67% | 621 | 9.2% |
[ 62.0% - 62.5% ] 62.41% | 141 | 10.6% |
[ 63.0% - 63.5% ] 63.35% | 483 | 2.7% |
[ 66.5% - 67.0% ] 66.53% | 236 | 16.9% |
[ 69.5% - 70.0% ] 69.70% | 33 | 66.7% |
[ 70.5% - 71.0% ] 70.83% | 24 | 50.0% |
[ 80.5% - 81.0% ] 80.89% | 246 | 0.41% |
[ 89.5% - 90.0% ] 89.71% | 136 | 10.3% |
[ 91.5% - 92.0% ] 91.71% | 205 | 8.3% |
[ 99.5% - 100.0% ] 100.00% | 278 | 30.2% |