European Disability Age Under 5

COMPARE

European
Race
Ancestry
AfghanAfricanAlaska NativeAlaskan AthabascanAlbanianAleutAlsatianAmericanApacheArabArapahoArgentineanArmenianAssyrian/Chaldean/SyriacAustralianAustrianBahamianBangladeshiBarbadianBasqueBelgianBelizeanBermudanBhutaneseBlackfeetBolivianBrazilianBritishBritish West IndianBulgarianBurmeseCajunCambodianCanadianCape VerdeanCarpatho RusynCelticCentral AmericanCentral American IndianCherokeeCheyenneChickasawChileanChineseChippewaChoctawColombianColvilleComancheCosta RicanCreeCreekCroatianCrowCubanCypriotCzechCzechoslovakianDanishDelawareDominicanDutchDutch West IndianEastern EuropeanEcuadorianEgyptianEnglishEstonianEthiopianEuropeanFijianFilipinoFinnishFrenchFrench American IndianFrench CanadianGermanGerman RussianGhanaianGreekGuamanian/ChamorroGuatemalanGuyaneseHaitianHmongHonduranHopiHoumaHungarianIcelanderIndian (Asian)IndonesianInupiatIranianIraqiIrishIroquoisIsraeliItalianJamaicanJapaneseJordanianKenyanKiowaKoreanLaotianLatvianLebaneseLiberianLithuanianLumbeeLuxembourgerMacedonianMalaysianMalteseMarshalleseMenomineeMexicanMexican American IndianMongolianMoroccanNative HawaiianNavajoNepaleseNew ZealanderNicaraguanNigerianNorthern EuropeanNorwegianOkinawanOsageOttawaPaiutePakistaniPalestinianPanamanianParaguayanPennsylvania GermanPeruvianPimaPolishPortuguesePotawatomiPuebloPuerto RicanPuget Sound SalishRomanianRussianSalvadoranSamoanScandinavianScotch-IrishScottishSeminoleSenegaleseSerbianShoshoneSierra LeoneanSiouxSlavicSlovakSloveneSomaliSouth AfricanSouth AmericanSouth American IndianSoviet UnionSpaniardSpanishSpanish AmericanSpanish American IndianSri LankanSubsaharan AfricanSudaneseSwedishSwissSyrianTaiwaneseThaiTlingit-HaidaTohono O'OdhamTonganTrinidadian and TobagonianTsimshianTurkishU.S. Virgin IslanderUgandanUkrainianUruguayanUteVenezuelanVietnameseWelshWest IndianYakamaYaquiYugoslavianYumanYup'ikZimbabwean
Immigration
NonimmigrantsImmigrantsAfghanistanAfricaAlbaniaArgentinaArmeniaAsiaAustraliaAustriaBahamasBangladeshBarbadosBelarusBelgiumBelizeBoliviaBosnia and HerzegovinaBrazilBulgariaBurma/MyanmarCabo VerdeCambodiaCameroonCanadaCaribbeanCentral AmericaChileChinaColombiaCongoCosta RicaCroatiaCubaCzechoslovakiaDenmarkDominicaDominican RepublicEastern AfricaEastern AsiaEastern EuropeEcuadorEgyptEl SalvadorEnglandEritreaEthiopiaEuropeFijiFranceGermanyGhanaGreeceGrenadaGuatemalaGuyanaHaitiHondurasHong KongHungaryIndiaIndonesiaIranIraqIrelandIsraelItalyJamaicaJapanJordanKazakhstanKenyaKoreaKuwaitLaosLatin AmericaLatviaLebanonLiberiaLithuaniaMalaysiaMexicoMicronesiaMiddle AfricaMoldovaMoroccoNepalNetherlandsNicaraguaNigeriaNorth AmericaNorth MacedoniaNorthern AfricaNorthern EuropeNorwayOceaniaPakistanPanamaPeruPhilippinesPolandPortugalRomaniaRussiaSaudi ArabiaScotlandSenegalSerbiaSierra LeoneSingaporeSomaliaSouth AfricaSouth AmericaSouth Central AsiaSouth Eastern AsiaSouthern EuropeSpainSri LankaSt. Vincent and the GrenadinesSudanSwedenSwitzerlandSyriaTaiwanThailandTrinidad and TobagoTurkeyUgandaUkraineUruguayUzbekistanVenezuelaVietnamWest IndiesWestern AfricaWestern AsiaWestern EuropeYemenZaireZimbabweAzores
Select to Compare
Race
Ancestry
AfghanAfricanAlaska NativeAlaskan AthabascanAlbanianAleutAlsatianAmericanApacheArabArapahoArgentineanArmenianAssyrian/Chaldean/SyriacAustralianAustrianBahamianBangladeshiBarbadianBasqueBelgianBelizeanBermudanBhutaneseBlackfeetBolivianBrazilianBritishBritish West IndianBulgarianBurmeseCajunCambodianCanadianCape VerdeanCarpatho RusynCelticCentral AmericanCentral American IndianCherokeeCheyenneChickasawChileanChineseChippewaChoctawColombianColvilleComancheCosta RicanCreeCreekCroatianCrowCubanCypriotCzechCzechoslovakianDanishDelawareDominicanDutchDutch West IndianEastern EuropeanEcuadorianEgyptianEnglishEstonianEthiopianFijianFilipinoFinnishFrenchFrench American IndianFrench CanadianGermanGerman RussianGhanaianGreekGuamanian/ChamorroGuatemalanGuyaneseHaitianHmongHonduranHopiHoumaHungarianIcelanderIndian (Asian)IndonesianInupiatIranianIraqiIrishIroquoisIsraeliItalianJamaicanJapaneseJordanianKenyanKiowaKoreanLaotianLatvianLebaneseLiberianLithuanianLumbeeLuxembourgerMacedonianMalaysianMalteseMarshalleseMenomineeMexicanMexican American IndianMongolianMoroccanNative HawaiianNavajoNepaleseNew ZealanderNicaraguanNigerianNorthern EuropeanNorwegianOkinawanOsageOttawaPaiutePakistaniPalestinianPanamanianParaguayanPennsylvania GermanPeruvianPimaPolishPortuguesePotawatomiPuebloPuerto RicanPuget Sound SalishRomanianRussianSalvadoranSamoanScandinavianScotch-IrishScottishSeminoleSenegaleseSerbianShoshoneSierra LeoneanSiouxSlavicSlovakSloveneSomaliSouth AfricanSouth AmericanSouth American IndianSoviet UnionSpaniardSpanishSpanish AmericanSpanish American IndianSri LankanSubsaharan AfricanSudaneseSwedishSwissSyrianTaiwaneseThaiTlingit-HaidaTohono O'OdhamTonganTrinidadian and TobagonianTsimshianTurkishU.S. Virgin IslanderUgandanUkrainianUruguayanUteVenezuelanVietnameseWelshWest IndianYakamaYaquiYugoslavianYumanYup'ikZimbabwean
Immigration
NonimmigrantsImmigrantsAfghanistanAfricaAlbaniaArgentinaArmeniaAsiaAustraliaAustriaBahamasBangladeshBarbadosBelarusBelgiumBelizeBoliviaBosnia and HerzegovinaBrazilBulgariaBurma/MyanmarCabo VerdeCambodiaCameroonCanadaCaribbeanCentral AmericaChileChinaColombiaCongoCosta RicaCroatiaCubaCzechoslovakiaDenmarkDominicaDominican RepublicEastern AfricaEastern AsiaEastern EuropeEcuadorEgyptEl SalvadorEnglandEritreaEthiopiaEuropeFijiFranceGermanyGhanaGreeceGrenadaGuatemalaGuyanaHaitiHondurasHong KongHungaryIndiaIndonesiaIranIraqIrelandIsraelItalyJamaicaJapanJordanKazakhstanKenyaKoreaKuwaitLaosLatin AmericaLatviaLebanonLiberiaLithuaniaMalaysiaMexicoMicronesiaMiddle AfricaMoldovaMoroccoNepalNetherlandsNicaraguaNigeriaNorth AmericaNorth MacedoniaNorthern AfricaNorthern EuropeNorwayOceaniaPakistanPanamaPeruPhilippinesPolandPortugalRomaniaRussiaSaudi ArabiaScotlandSenegalSerbiaSierra LeoneSingaporeSomaliaSouth AfricaSouth AmericaSouth Central AsiaSouth Eastern AsiaSouthern EuropeSpainSri LankaSt. Vincent and the GrenadinesSudanSwedenSwitzerlandSyriaTaiwanThailandTrinidad and TobagoTurkeyUgandaUkraineUruguayUzbekistanVenezuelaVietnamWest IndiesWestern AfricaWestern AsiaWestern EuropeYemenZaireZimbabweAzores
Disability Age Under 5
Income
Poverty
Unemployment
Labor Participation
Family Structure
Vehicle Availability
Education Level
Disability

European Disability Age Under 5
Tragic

1.5%
DISABILITY | AGE UNDER 5
0.0/ 100
METRIC RATING
284th/ 347
METRIC RANK

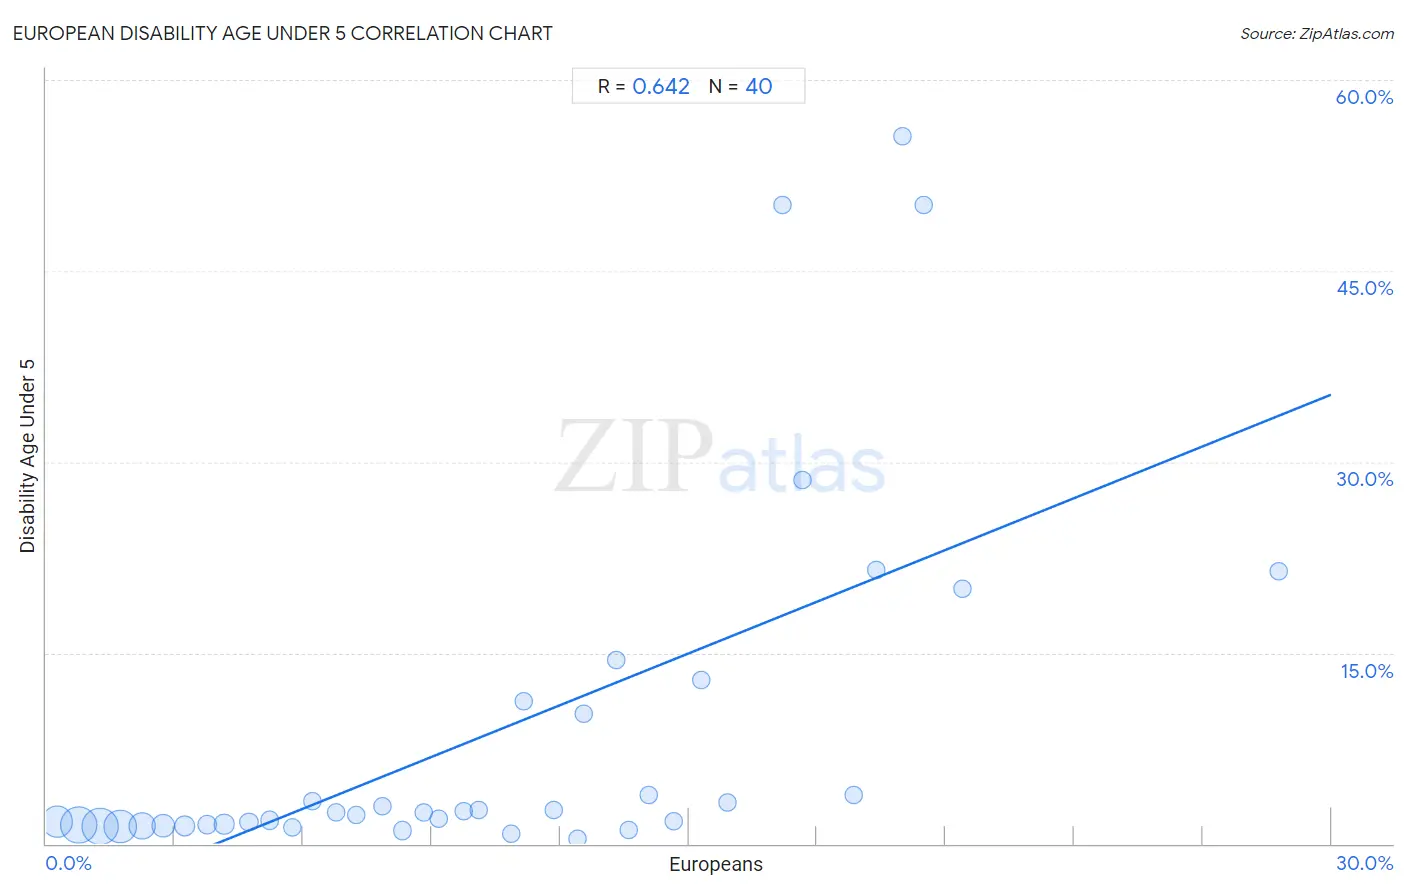
European Disability Age Under 5 Correlation Chart

The statistical analysis conducted on geographies consisting of 258,994,834 people shows a significant positive correlation between the proportion of Europeans and percentage of population with a disability under the age of 5 in the United States with a correlation coefficient (R) of 0.642 and weighted average of 1.5%. On average, for every 1% (one percent) increase in Europeans within a typical geography, there is an increase of 1.4% in percentage of population with a disability under the age of 5.
European Disability Age Under 5
It is essential to understand that the correlation between the percentage of Europeans and percentage of population with a disability under the age of 5 does not imply a direct cause-and-effect relationship. It remains uncertain whether the presence of Europeans influences an upward or downward trend in the level of percentage of population with a disability under the age of 5 within an area, or if Europeans simply ended up residing in those areas with higher or lower levels of percentage of population with a disability under the age of 5 due to other factors.

Demographics Similar to Europeans by Disability Age Under 5

In terms of disability age under 5, the demographic groups most similar to Europeans are Delaware (1.5%, a difference of 0.050%), Cheyenne (1.5%, a difference of 0.25%), Czechoslovakian (1.5%, a difference of 0.59%), Croatian (1.5%, a difference of 1.2%), and Tlingit-Haida (1.5%, a difference of 1.4%).
DemographicsRating | RankDisability Age Under 5
Canadians
0.0
/100
|
#277
Tragic
1.5%
Kiowa
0.0
/100
|
#278
Tragic
1.5%
Danes
0.0
/100
|
#279
Tragic
1.5%
British
0.0
/100
|
#280
Tragic
1.5%
Czechoslovakians
0.0
/100
|
#281
Tragic
1.5%
Cheyenne
0.0
/100
|
#282
Tragic
1.5%
Delaware
0.0
/100
|
#283
Tragic
1.5%
Europeans
0.0
/100
|
#284
Tragic
1.5%
Croatians
0.0
/100
|
#285
Tragic
1.5%
Tlingit-Haida
0.0
/100
|
#286
Tragic
1.5%
Scandinavians
0.0
/100
|
#287
Tragic
1.5%
Estonians
0.0
/100
|
#288
Tragic
1.5%
Hungarians
0.0
/100
|
#289
Tragic
1.5%
Czechs
0.0
/100
|
#290
Tragic
1.5%
Northern Europeans
0.0
/100
|
#291
Tragic
1.6%

European Disability Age Under 5 Correlation Summary

MeasurementEuropean DataDisability Age Under 5 Data
Minimum0.26%0.42%
Maximum28.8%55.6%
Range28.5%55.1%
Mean10.5%8.8%
Median9.9%2.4%
Interquartile 25% (IQ1)5.0%1.4%
Interquartile 75% (IQ3)15.0%10.7%
Interquartile Range (IQR)10.0%9.2%
Standard Deviation (Sample)6.7%14.2%
Standard Deviation (Population)6.7%14.0%

Correlation Details

European PercentileSample SizeDisability Age Under 5
[
0.0%
-
0.5%
]
0.26%
37,610,5901.7%
[
0.5%
-
1.0%
]
0.77%
54,323,4231.4%
[
1.0%
-
1.5%
]
1.25%
53,586,4091.4%
[
1.5%
-
2.0%
]
1.73%
42,046,9661.4%
[
2.0%
-
2.5%
]
2.23%
27,294,9081.4%
[
2.5%
-
3.0%
]
2.73%
17,491,5261.4%
[
3.0%
-
3.5%
]
3.23%
8,948,9961.4%
[
3.5%
-
4.0%
]
3.76%
5,504,5011.5%
[
4.0%
-
4.5%
]
4.16%
4,506,6581.5%
[
4.5%
-
5.0%
]
4.73%
2,455,0081.7%
[
5.0%
-
5.5%
]
5.22%
1,748,1581.9%
[
5.5%
-
6.0%
]
5.75%
652,6331.3%
[
6.0%
-
6.5%
]
6.22%
595,3333.3%
[
6.5%
-
7.0%
]
6.77%
716,5792.5%
[
7.0%
-
7.5%
]
7.23%
140,4292.2%
[
7.5%
-
8.0%
]
7.84%
176,8073.0%
[
8.0%
-
8.5%
]
8.31%
219,2931.0%
[
8.5%
-
9.0%
]
8.80%
155,8442.4%
[
9.0%
-
9.5%
]
9.17%
72,0662.0%
[
9.5%
-
10.0%
]
9.74%
287,9112.5%
[
10.0%
-
10.5%
]
10.11%
104,4422.7%
[
10.5%
-
11.0%
]
10.86%
40,8260.81%
[
11.0%
-
11.5%
]
11.14%
2,67411.2%
[
11.5%
-
12.0%
]
11.84%
21,8482.6%
[
12.0%
-
12.5%
]
12.40%
25,6040.42%
[
12.5%
-
13.0%
]
12.54%
4,96810.2%
[
13.0%
-
13.5%
]
13.29%
7,56714.4%
[
13.5%
-
14.0%
]
13.60%
104,0021.1%
[
14.0%
-
14.5%
]
14.05%
17,1053.8%
[
14.5%
-
15.0%
]
14.64%
71,9591.7%
[
15.0%
-
15.5%
]
15.30%
7,76412.9%
[
15.5%
-
16.0%
]
15.89%
37,0183.3%
[
17.0%
-
17.5%
]
17.19%
2,16450.2%
[
17.5%
-
18.0%
]
17.66%
1,17828.6%
[
18.5%
-
19.0%
]
18.85%
2,7533.8%
[
19.0%
-
19.5%
]
19.37%
2,90221.5%
[
19.5%
-
20.0%
]
19.98%
1,23655.6%
[
20.0%
-
20.5%
]
20.50%
1,81550.2%
[
21.0%
-
21.5%
]
21.39%
1,82820.0%
[
28.5%
-
29.0%
]
28.78%
1,14321.4%