European vs Iraqi Disability Age 5 to 17
COMPARE
European
Iraqi
Disability Age 5 to 17
Disability Age 5 to 17 Comparison
Europeans
Iraqis
5.8%
DISABILITY AGE 5 TO 17
4.5/ 100
METRIC RATING
231st/ 347
METRIC RANK
5.6%
DISABILITY AGE 5 TO 17
56.0/ 100
METRIC RATING
168th/ 347
METRIC RANK
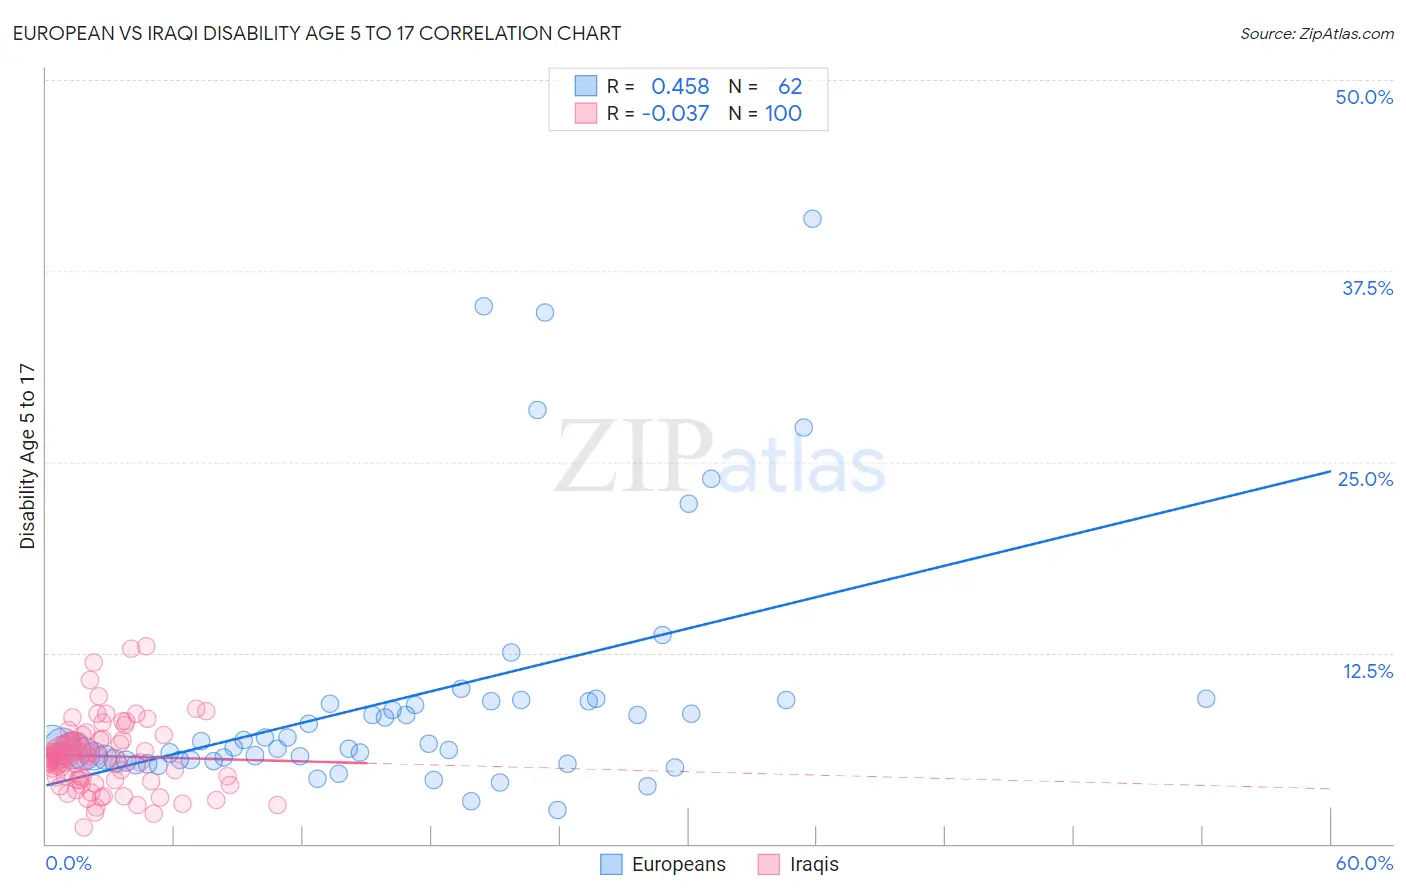
European vs Iraqi Disability Age 5 to 17 Correlation Chart
The statistical analysis conducted on geographies consisting of 549,684,135 people shows a moderate positive correlation between the proportion of Europeans and percentage of population with a disability between the ages 5 and 17 in the United States with a correlation coefficient (R) of 0.458 and weighted average of 5.8%. Similarly, the statistical analysis conducted on geographies consisting of 170,075,057 people shows no correlation between the proportion of Iraqis and percentage of population with a disability between the ages 5 and 17 in the United States with a correlation coefficient (R) of -0.037 and weighted average of 5.6%, a difference of 4.1%.
Disability Age 5 to 17 Correlation Summary
| Measurement | European | Iraqi |
| Minimum | 2.2% | 1.0% |
| Maximum | 40.9% | 12.9% |
| Range | 38.7% | 11.9% |
| Mean | 9.4% | 5.7% |
| Median | 6.5% | 5.7% |
| Interquartile 25% (IQ1) | 5.5% | 4.3% |
| Interquartile 75% (IQ3) | 9.3% | 6.7% |
| Interquartile Range (IQR) | 3.8% | 2.4% |
| Standard Deviation (Sample) | 8.1% | 2.2% |
| Standard Deviation (Population) | 8.0% | 2.2% |
Similar Demographics by Disability Age 5 to 17
Demographics Similar to Europeans by Disability Age 5 to 17
In terms of disability age 5 to 17, the demographic groups most similar to Europeans are Ghanaian (5.8%, a difference of 0.070%), Bangladeshi (5.8%, a difference of 0.080%), Haitian (5.8%, a difference of 0.090%), Swiss (5.8%, a difference of 0.17%), and Immigrants from Laos (5.8%, a difference of 0.20%).
| Demographics | Rating | Rank | Disability Age 5 to 17 |
| Mexicans | 5.7 /100 | #224 | Tragic 5.8% |
| Guamanians/Chamorros | 5.6 /100 | #225 | Tragic 5.8% |
| British West Indians | 5.4 /100 | #226 | Tragic 5.8% |
| Swiss | 5.1 /100 | #227 | Tragic 5.8% |
| Haitians | 4.8 /100 | #228 | Tragic 5.8% |
| Bangladeshis | 4.8 /100 | #229 | Tragic 5.8% |
| Ghanaians | 4.7 /100 | #230 | Tragic 5.8% |
| Europeans | 4.5 /100 | #231 | Tragic 5.8% |
| Immigrants | Laos | 3.8 /100 | #232 | Tragic 5.8% |
| Immigrants | West Indies | 3.5 /100 | #233 | Tragic 5.8% |
| Immigrants | Kenya | 3.4 /100 | #234 | Tragic 5.8% |
| Malaysians | 3.4 /100 | #235 | Tragic 5.8% |
| Immigrants | Brazil | 3.2 /100 | #236 | Tragic 5.8% |
| Sudanese | 2.9 /100 | #237 | Tragic 5.8% |
| Hungarians | 2.6 /100 | #238 | Tragic 5.8% |
Demographics Similar to Iraqis by Disability Age 5 to 17
In terms of disability age 5 to 17, the demographic groups most similar to Iraqis are Immigrants from Norway (5.6%, a difference of 0.020%), Serbian (5.6%, a difference of 0.10%), Immigrants from Iraq (5.6%, a difference of 0.11%), Immigrants from Burma/Myanmar (5.6%, a difference of 0.17%), and Greek (5.6%, a difference of 0.23%).
| Demographics | Rating | Rank | Disability Age 5 to 17 |
| Immigrants | Saudi Arabia | 69.1 /100 | #161 | Good 5.5% |
| Zimbabweans | 67.2 /100 | #162 | Good 5.5% |
| Immigrants | Southern Europe | 64.0 /100 | #163 | Good 5.6% |
| Immigrants | Scotland | 61.9 /100 | #164 | Good 5.6% |
| Lebanese | 61.4 /100 | #165 | Good 5.6% |
| Greeks | 60.6 /100 | #166 | Good 5.6% |
| Immigrants | Burma/Myanmar | 59.3 /100 | #167 | Average 5.6% |
| Iraqis | 56.0 /100 | #168 | Average 5.6% |
| Immigrants | Norway | 55.7 /100 | #169 | Average 5.6% |
| Serbians | 54.0 /100 | #170 | Average 5.6% |
| Immigrants | Iraq | 53.9 /100 | #171 | Average 5.6% |
| Ukrainians | 51.5 /100 | #172 | Average 5.6% |
| Uruguayans | 51.0 /100 | #173 | Average 5.6% |
| Costa Ricans | 50.0 /100 | #174 | Average 5.6% |
| Shoshone | 49.4 /100 | #175 | Average 5.6% |