European vs Dutch West Indian Disability Age 5 to 17
COMPARE
European
Dutch West Indian
Disability Age 5 to 17
Disability Age 5 to 17 Comparison
Europeans
Dutch West Indians
5.8%
DISABILITY AGE 5 TO 17
4.5/ 100
METRIC RATING
231st/ 347
METRIC RANK
6.7%
DISABILITY AGE 5 TO 17
0.0/ 100
METRIC RATING
330th/ 347
METRIC RANK
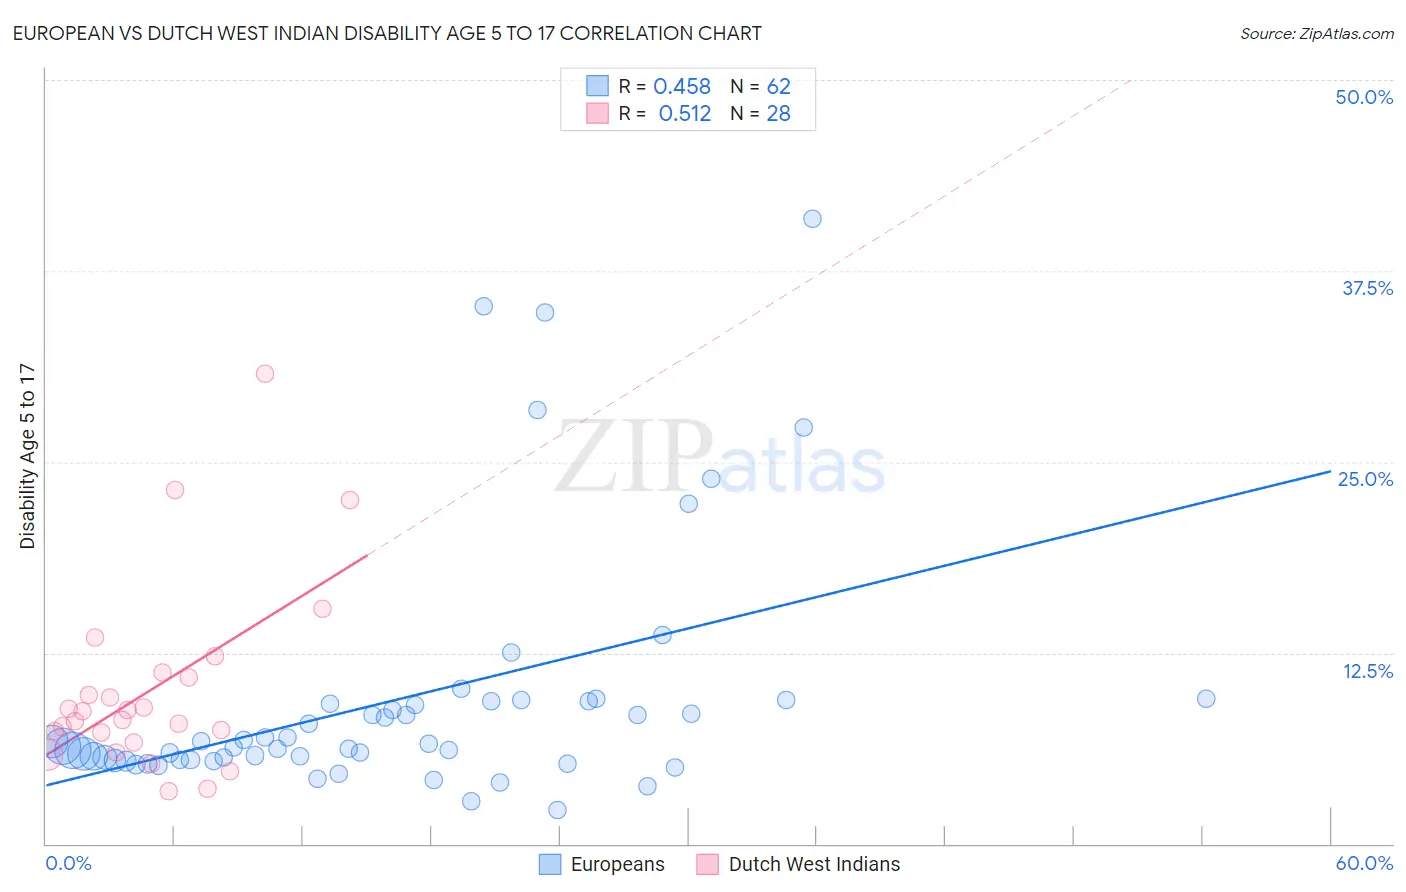
European vs Dutch West Indian Disability Age 5 to 17 Correlation Chart
The statistical analysis conducted on geographies consisting of 549,684,135 people shows a moderate positive correlation between the proportion of Europeans and percentage of population with a disability between the ages 5 and 17 in the United States with a correlation coefficient (R) of 0.458 and weighted average of 5.8%. Similarly, the statistical analysis conducted on geographies consisting of 85,576,125 people shows a substantial positive correlation between the proportion of Dutch West Indians and percentage of population with a disability between the ages 5 and 17 in the United States with a correlation coefficient (R) of 0.512 and weighted average of 6.7%, a difference of 15.4%.
Disability Age 5 to 17 Correlation Summary
| Measurement | European | Dutch West Indian |
| Minimum | 2.2% | 3.5% |
| Maximum | 40.9% | 30.8% |
| Range | 38.7% | 27.3% |
| Mean | 9.4% | 10.1% |
| Median | 6.5% | 8.4% |
| Interquartile 25% (IQ1) | 5.5% | 7.0% |
| Interquartile 75% (IQ3) | 9.3% | 11.0% |
| Interquartile Range (IQR) | 3.8% | 4.1% |
| Standard Deviation (Sample) | 8.1% | 6.2% |
| Standard Deviation (Population) | 8.0% | 6.1% |
Similar Demographics by Disability Age 5 to 17
Demographics Similar to Europeans by Disability Age 5 to 17
In terms of disability age 5 to 17, the demographic groups most similar to Europeans are Ghanaian (5.8%, a difference of 0.070%), Bangladeshi (5.8%, a difference of 0.080%), Haitian (5.8%, a difference of 0.090%), Swiss (5.8%, a difference of 0.17%), and Immigrants from Laos (5.8%, a difference of 0.20%).
| Demographics | Rating | Rank | Disability Age 5 to 17 |
| Mexicans | 5.7 /100 | #224 | Tragic 5.8% |
| Guamanians/Chamorros | 5.6 /100 | #225 | Tragic 5.8% |
| British West Indians | 5.4 /100 | #226 | Tragic 5.8% |
| Swiss | 5.1 /100 | #227 | Tragic 5.8% |
| Haitians | 4.8 /100 | #228 | Tragic 5.8% |
| Bangladeshis | 4.8 /100 | #229 | Tragic 5.8% |
| Ghanaians | 4.7 /100 | #230 | Tragic 5.8% |
| Europeans | 4.5 /100 | #231 | Tragic 5.8% |
| Immigrants | Laos | 3.8 /100 | #232 | Tragic 5.8% |
| Immigrants | West Indies | 3.5 /100 | #233 | Tragic 5.8% |
| Immigrants | Kenya | 3.4 /100 | #234 | Tragic 5.8% |
| Malaysians | 3.4 /100 | #235 | Tragic 5.8% |
| Immigrants | Brazil | 3.2 /100 | #236 | Tragic 5.8% |
| Sudanese | 2.9 /100 | #237 | Tragic 5.8% |
| Hungarians | 2.6 /100 | #238 | Tragic 5.8% |
Demographics Similar to Dutch West Indians by Disability Age 5 to 17
In terms of disability age 5 to 17, the demographic groups most similar to Dutch West Indians are French Canadian (6.7%, a difference of 0.080%), Immigrants from the Azores (6.7%, a difference of 0.10%), Black/African American (6.8%, a difference of 0.69%), Seminole (6.8%, a difference of 0.74%), and Ottawa (6.8%, a difference of 1.5%).
| Demographics | Rating | Rank | Disability Age 5 to 17 |
| Osage | 0.0 /100 | #323 | Tragic 6.5% |
| Dominicans | 0.0 /100 | #324 | Tragic 6.5% |
| Americans | 0.0 /100 | #325 | Tragic 6.5% |
| Potawatomi | 0.0 /100 | #326 | Tragic 6.5% |
| French American Indians | 0.0 /100 | #327 | Tragic 6.6% |
| Pennsylvania Germans | 0.0 /100 | #328 | Tragic 6.6% |
| Blackfeet | 0.0 /100 | #329 | Tragic 6.6% |
| Dutch West Indians | 0.0 /100 | #330 | Tragic 6.7% |
| French Canadians | 0.0 /100 | #331 | Tragic 6.7% |
| Immigrants | Azores | 0.0 /100 | #332 | Tragic 6.7% |
| Blacks/African Americans | 0.0 /100 | #333 | Tragic 6.8% |
| Seminole | 0.0 /100 | #334 | Tragic 6.8% |
| Ottawa | 0.0 /100 | #335 | Tragic 6.8% |
| Chickasaw | 0.0 /100 | #336 | Tragic 6.8% |
| Creek | 0.0 /100 | #337 | Tragic 6.9% |