European 4 or more Vehicles in Household
COMPARE
European
Select to Compare
4 or more Vehicles in Household
European 4 or more Vehicles in Household
7.6%
4+ VEHICLES AVAILABLE
100.0/ 100
METRIC RATING
61st/ 347
METRIC RANK
European 4 or more Vehicles in Household Correlation Chart
The statistical analysis conducted on geographies consisting of 558,591,930 people shows a significant positive correlation between the proportion of Europeans and percentage of households with 4 or more vehicles available in the United States with a correlation coefficient (R) of 0.630 and weighted average of 7.6%. On average, for every 1% (one percent) increase in Europeans within a typical geography, there is an increase of 0.50% in percentage of households with 4 or more vehicles available.
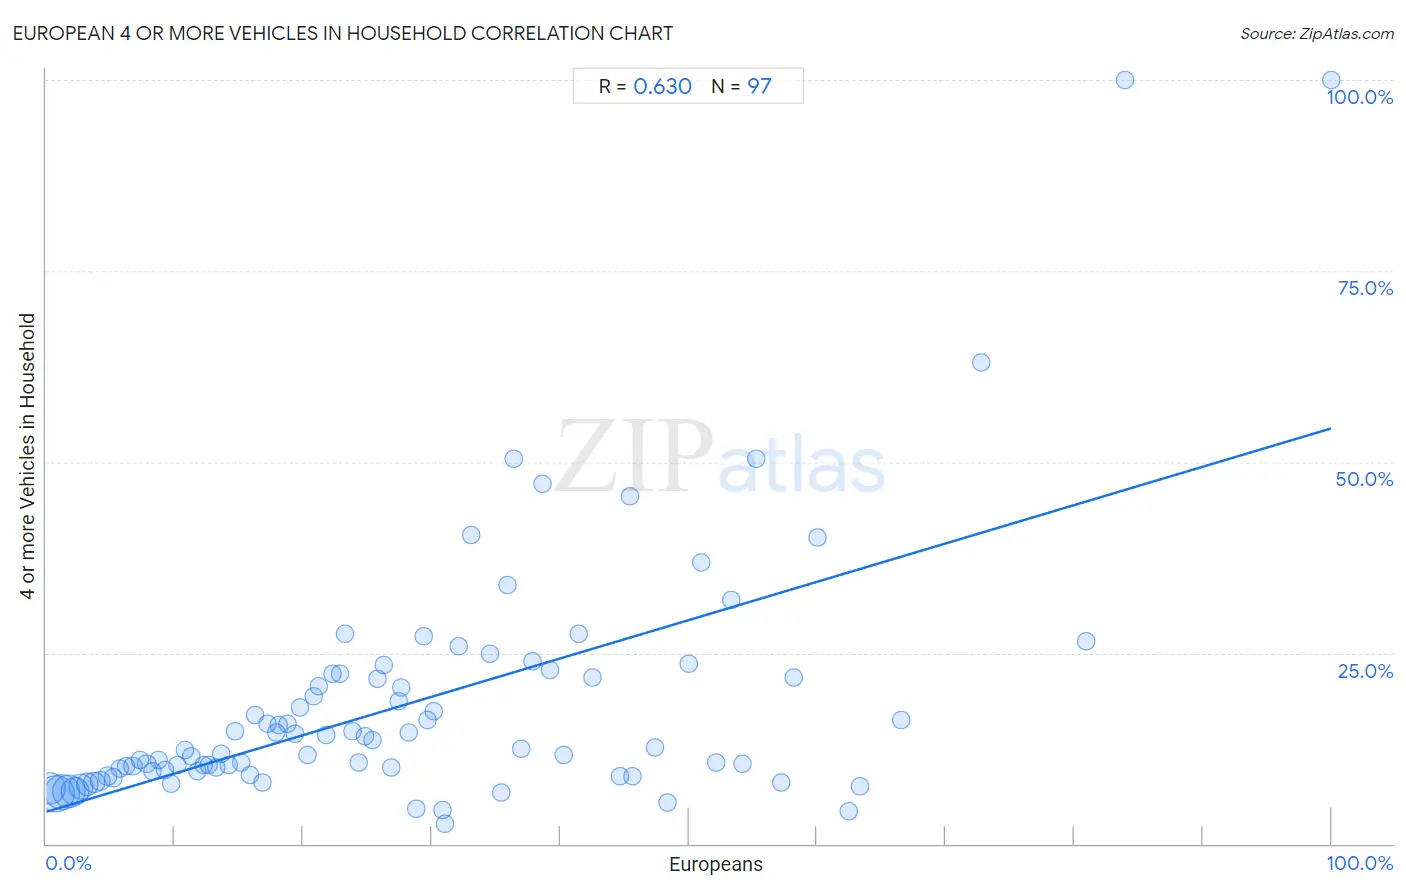
It is essential to understand that the correlation between the percentage of Europeans and percentage of households with 4 or more vehicles available does not imply a direct cause-and-effect relationship. It remains uncertain whether the presence of Europeans influences an upward or downward trend in the level of percentage of households with 4 or more vehicles available within an area, or if Europeans simply ended up residing in those areas with higher or lower levels of percentage of households with 4 or more vehicles available due to other factors.
Demographics Similar to Europeans by 4 or more Vehicles in Household
In terms of 4 or more vehicles in household, the demographic groups most similar to Europeans are Spaniard (7.6%, a difference of 0.26%), Chippewa (7.6%, a difference of 0.26%), Immigrants from Micronesia (7.6%, a difference of 0.27%), Hispanic or Latino (7.6%, a difference of 0.32%), and Pennsylvania German (7.6%, a difference of 0.36%).
| Demographics | Rating | Rank | 4 or more Vehicles in Household |
| Dutch | 100.0 /100 | #54 | Exceptional 7.7% |
| Immigrants from Oceania | 100.0 /100 | #55 | Exceptional 7.6% |
| English | 100.0 /100 | #56 | Exceptional 7.6% |
| Pennsylvania Germans | 100.0 /100 | #57 | Exceptional 7.6% |
| Swedes | 100.0 /100 | #58 | Exceptional 7.6% |
| Hispanics or Latinos | 100.0 /100 | #59 | Exceptional 7.6% |
| Spaniards | 100.0 /100 | #60 | Exceptional 7.6% |
| Europeans | 100.0 /100 | #61 | Exceptional 7.6% |
| Chippewa | 100.0 /100 | #62 | Exceptional 7.6% |
| Immigrants from Micronesia | 100.0 /100 | #63 | Exceptional 7.6% |
| Bangladeshis | 100.0 /100 | #64 | Exceptional 7.6% |
| Immigrants from the Azores | 100.0 /100 | #65 | Exceptional 7.5% |
| Immigrants from Taiwan | 99.9 /100 | #66 | Exceptional 7.5% |
| Americans | 99.9 /100 | #67 | Exceptional 7.5% |
| Welsh | 99.9 /100 | #68 | Exceptional 7.5% |
European 4 or more Vehicles in Household Correlation Summary
| Measurement | European Data | 4 or more Vehicles in Household Data |
| Minimum | 0.27% | 2.6% |
| Maximum | 100.0% | 100.0% |
| Range | 99.7% | 97.4% |
| Mean | 28.1% | 18.3% |
| Median | 24.3% | 12.5% |
| Interquartile 25% (IQ1) | 12.0% | 9.2% |
| Interquartile 75% (IQ3) | 39.8% | 22.0% |
| Interquartile Range (IQR) | 27.7% | 12.8% |
| Standard Deviation (Sample) | 20.7% | 16.5% |
| Standard Deviation (Population) | 20.6% | 16.4% |
Correlation Details
| European Percentile | Sample Size | 4 or more Vehicles in Household |
[ 0.0% - 0.5% ] 0.27% | 84,499,439 | 7.3% |
[ 0.5% - 1.0% ] 0.76% | 109,877,729 | 6.5% |
[ 1.0% - 1.5% ] 1.25% | 105,771,260 | 6.8% |
[ 1.5% - 2.0% ] 1.73% | 86,712,174 | 6.9% |
[ 2.0% - 2.5% ] 2.24% | 58,485,687 | 6.8% |
[ 2.5% - 3.0% ] 2.73% | 39,596,371 | 7.5% |
[ 3.0% - 3.5% ] 3.23% | 23,463,684 | 7.8% |
[ 3.5% - 4.0% ] 3.74% | 15,475,235 | 8.1% |
[ 4.0% - 4.5% ] 4.20% | 11,451,467 | 8.2% |
[ 4.5% - 5.0% ] 4.73% | 6,777,601 | 8.9% |
[ 5.0% - 5.5% ] 5.23% | 4,967,530 | 8.6% |
[ 5.5% - 6.0% ] 5.75% | 2,559,904 | 9.8% |
[ 6.0% - 6.5% ] 6.24% | 1,964,785 | 10.1% |
[ 6.5% - 7.0% ] 6.74% | 1,742,947 | 10.2% |
[ 7.0% - 7.5% ] 7.26% | 824,730 | 11.0% |
[ 7.5% - 8.0% ] 7.82% | 865,810 | 10.5% |
[ 8.0% - 8.5% ] 8.28% | 574,661 | 9.5% |
[ 8.5% - 9.0% ] 8.76% | 400,932 | 11.0% |
[ 9.0% - 9.5% ] 9.21% | 401,283 | 9.7% |
[ 9.5% - 10.0% ] 9.72% | 488,793 | 7.9% |
[ 10.0% - 10.5% ] 10.19% | 239,069 | 10.2% |
[ 10.5% - 11.0% ] 10.78% | 135,636 | 12.2% |
[ 11.0% - 11.5% ] 11.24% | 157,734 | 11.5% |
[ 11.5% - 12.0% ] 11.80% | 108,634 | 9.5% |
[ 12.0% - 12.5% ] 12.29% | 113,431 | 10.3% |
[ 12.5% - 13.0% ] 12.64% | 138,837 | 10.3% |
[ 13.0% - 13.5% ] 13.25% | 45,754 | 9.9% |
[ 13.5% - 14.0% ] 13.66% | 170,497 | 11.7% |
[ 14.0% - 14.5% ] 14.20% | 48,043 | 10.3% |
[ 14.5% - 15.0% ] 14.66% | 93,307 | 14.7% |
[ 15.0% - 15.5% ] 15.21% | 74,173 | 10.7% |
[ 15.5% - 16.0% ] 15.82% | 73,269 | 9.0% |
[ 16.0% - 16.5% ] 16.24% | 11,861 | 16.8% |
[ 16.5% - 17.0% ] 16.83% | 45,564 | 7.9% |
[ 17.0% - 17.5% ] 17.23% | 34,441 | 15.7% |
[ 17.5% - 18.0% ] 17.87% | 41,719 | 14.6% |
[ 18.0% - 18.5% ] 18.13% | 24,608 | 15.5% |
[ 18.5% - 19.0% ] 18.80% | 13,740 | 15.7% |
[ 19.0% - 19.5% ] 19.36% | 15,738 | 14.3% |
[ 19.5% - 20.0% ] 19.76% | 7,156 | 17.8% |
[ 20.0% - 20.5% ] 20.30% | 6,504 | 11.6% |
[ 20.5% - 21.0% ] 20.82% | 4,914 | 19.3% |
[ 21.0% - 21.5% ] 21.20% | 12,178 | 20.6% |
[ 21.5% - 22.0% ] 21.74% | 11,824 | 14.3% |
[ 22.0% - 22.5% ] 22.23% | 6,018 | 22.2% |
[ 22.5% - 23.0% ] 22.88% | 2,037 | 22.2% |
[ 23.0% - 23.5% ] 23.25% | 3,110 | 27.5% |
[ 23.5% - 24.0% ] 23.85% | 1,870 | 14.8% |
[ 24.0% - 24.5% ] 24.34% | 3,410 | 10.6% |
[ 24.5% - 25.0% ] 24.83% | 1,510 | 14.0% |
[ 25.0% - 25.5% ] 25.35% | 8,819 | 13.6% |
[ 25.5% - 26.0% ] 25.74% | 4,681 | 21.7% |
[ 26.0% - 26.5% ] 26.22% | 633 | 23.5% |
[ 26.5% - 27.0% ] 26.80% | 1,787 | 10.0% |
[ 27.0% - 27.5% ] 27.41% | 1,164 | 18.6% |
[ 27.5% - 28.0% ] 27.64% | 1,230 | 20.5% |
[ 28.0% - 28.5% ] 28.16% | 3,231 | 14.6% |
[ 28.5% - 29.0% ] 28.79% | 1,365 | 4.6% |
[ 29.0% - 29.5% ] 29.35% | 920 | 27.2% |
[ 29.5% - 30.0% ] 29.66% | 1,487 | 16.2% |
[ 30.0% - 30.5% ] 30.18% | 1,256 | 17.3% |
[ 30.5% - 31.0% ] 30.79% | 2,429 | 4.4% |
[ 31.0% - 31.5% ] 31.01% | 732 | 2.6% |
[ 32.0% - 32.5% ] 32.14% | 809 | 25.9% |
[ 33.0% - 33.5% ] 33.09% | 417 | 40.5% |
[ 34.5% - 35.0% ] 34.57% | 2,152 | 24.9% |
[ 35.0% - 35.5% ] 35.37% | 311 | 6.8% |
[ 35.5% - 36.0% ] 35.85% | 516 | 33.8% |
[ 36.0% - 36.5% ] 36.34% | 388 | 50.4% |
[ 36.5% - 37.0% ] 36.95% | 617 | 12.5% |
[ 37.5% - 38.0% ] 37.87% | 573 | 23.9% |
[ 38.5% - 39.0% ] 38.58% | 127 | 47.1% |
[ 39.0% - 39.5% ] 39.22% | 51 | 22.7% |
[ 40.0% - 40.5% ] 40.29% | 206 | 11.6% |
[ 41.0% - 41.5% ] 41.46% | 82 | 27.5% |
[ 42.5% - 43.0% ] 42.52% | 214 | 21.7% |
[ 44.5% - 45.0% ] 44.61% | 946 | 8.8% |
[ 45.0% - 45.5% ] 45.39% | 141 | 45.6% |
[ 45.5% - 46.0% ] 45.61% | 1,002 | 8.9% |
[ 47.0% - 47.5% ] 47.42% | 310 | 12.7% |
[ 48.0% - 48.5% ] 48.36% | 122 | 5.4% |
[ 50.0% - 50.5% ] 50.00% | 324 | 23.5% |
[ 51.0% - 51.5% ] 51.02% | 49 | 36.8% |
[ 52.0% - 52.5% ] 52.16% | 347 | 10.6% |
[ 53.0% - 53.5% ] 53.33% | 420 | 31.9% |
[ 54.0% - 54.5% ] 54.19% | 179 | 10.4% |
[ 55.0% - 55.5% ] 55.28% | 369 | 50.4% |
[ 57.0% - 57.5% ] 57.19% | 612 | 8.0% |
[ 58.0% - 58.5% ] 58.21% | 67 | 21.7% |
[ 60.0% - 60.5% ] 60.00% | 725 | 40.1% |
[ 62.0% - 62.5% ] 62.41% | 141 | 4.3% |
[ 63.0% - 63.5% ] 63.35% | 382 | 7.6% |
[ 66.5% - 67.0% ] 66.53% | 236 | 16.2% |
[ 72.5% - 73.0% ] 72.73% | 88 | 63.1% |
[ 80.5% - 81.0% ] 80.89% | 246 | 26.6% |
[ 83.5% - 84.0% ] 83.96% | 187 | 100.0% |
[ 99.5% - 100.0% ] 100.00% | 232 | 100.0% |