European vs Dutch Disability Age 5 to 17
COMPARE
European
Dutch
Disability Age 5 to 17
Disability Age 5 to 17 Comparison
Europeans
Dutch
5.8%
DISABILITY AGE 5 TO 17
4.5/ 100
METRIC RATING
231st/ 347
METRIC RANK
6.0%
DISABILITY AGE 5 TO 17
0.2/ 100
METRIC RATING
275th/ 347
METRIC RANK
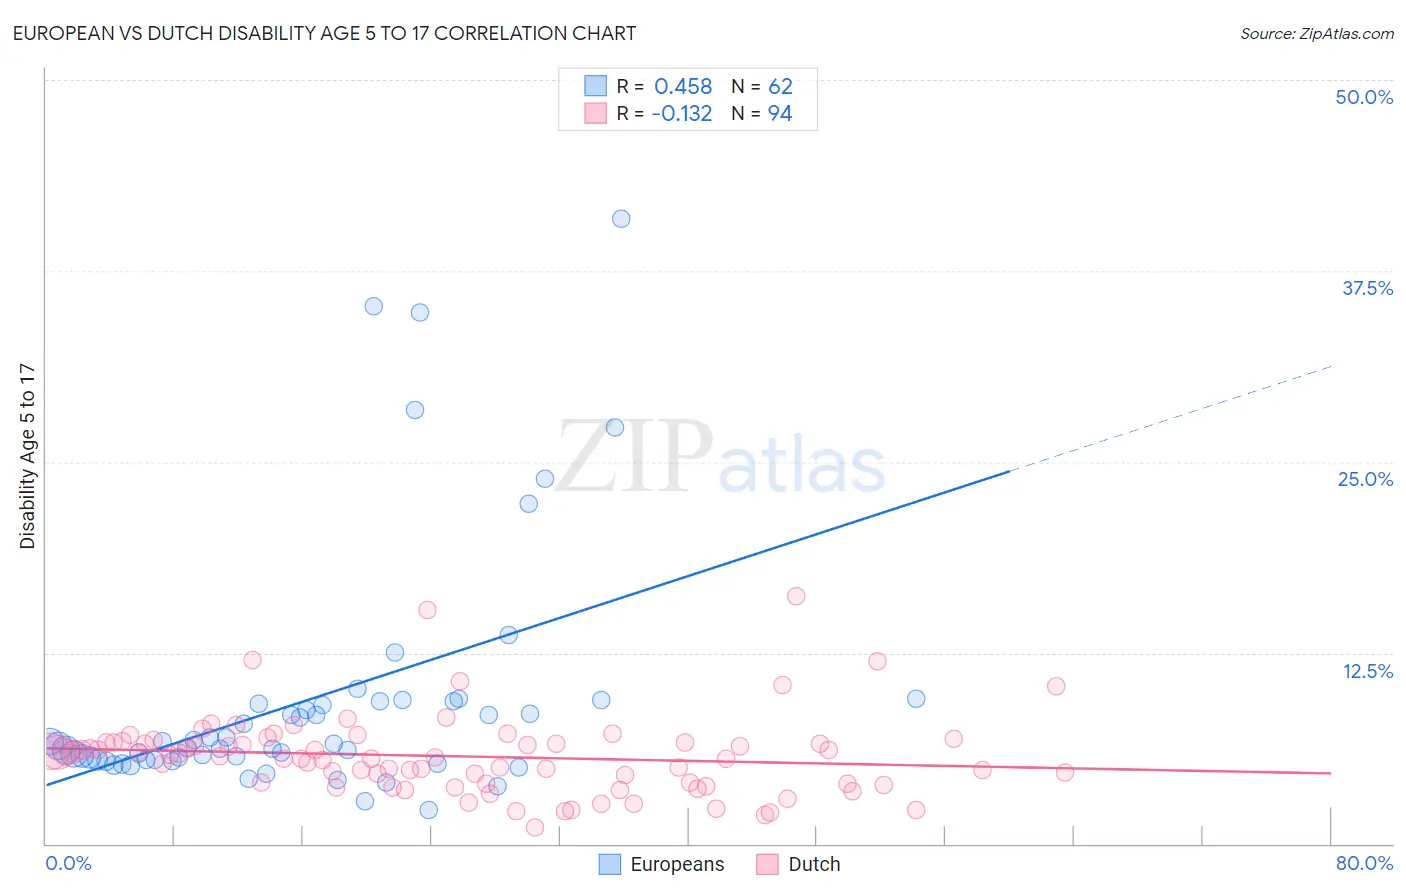
European vs Dutch Disability Age 5 to 17 Correlation Chart
The statistical analysis conducted on geographies consisting of 549,684,135 people shows a moderate positive correlation between the proportion of Europeans and percentage of population with a disability between the ages 5 and 17 in the United States with a correlation coefficient (R) of 0.458 and weighted average of 5.8%. Similarly, the statistical analysis conducted on geographies consisting of 542,324,990 people shows a poor negative correlation between the proportion of Dutch and percentage of population with a disability between the ages 5 and 17 in the United States with a correlation coefficient (R) of -0.132 and weighted average of 6.0%, a difference of 4.0%.
Disability Age 5 to 17 Correlation Summary
| Measurement | European | Dutch |
| Minimum | 2.2% | 1.1% |
| Maximum | 40.9% | 16.2% |
| Range | 38.7% | 15.1% |
| Mean | 9.4% | 5.7% |
| Median | 6.5% | 5.7% |
| Interquartile 25% (IQ1) | 5.5% | 3.9% |
| Interquartile 75% (IQ3) | 9.3% | 6.6% |
| Interquartile Range (IQR) | 3.8% | 2.7% |
| Standard Deviation (Sample) | 8.1% | 2.6% |
| Standard Deviation (Population) | 8.0% | 2.6% |
Similar Demographics by Disability Age 5 to 17
Demographics Similar to Europeans by Disability Age 5 to 17
In terms of disability age 5 to 17, the demographic groups most similar to Europeans are Ghanaian (5.8%, a difference of 0.070%), Bangladeshi (5.8%, a difference of 0.080%), Haitian (5.8%, a difference of 0.090%), Swiss (5.8%, a difference of 0.17%), and Immigrants from Laos (5.8%, a difference of 0.20%).
| Demographics | Rating | Rank | Disability Age 5 to 17 |
| Mexicans | 5.7 /100 | #224 | Tragic 5.8% |
| Guamanians/Chamorros | 5.6 /100 | #225 | Tragic 5.8% |
| British West Indians | 5.4 /100 | #226 | Tragic 5.8% |
| Swiss | 5.1 /100 | #227 | Tragic 5.8% |
| Haitians | 4.8 /100 | #228 | Tragic 5.8% |
| Bangladeshis | 4.8 /100 | #229 | Tragic 5.8% |
| Ghanaians | 4.7 /100 | #230 | Tragic 5.8% |
| Europeans | 4.5 /100 | #231 | Tragic 5.8% |
| Immigrants | Laos | 3.8 /100 | #232 | Tragic 5.8% |
| Immigrants | West Indies | 3.5 /100 | #233 | Tragic 5.8% |
| Immigrants | Kenya | 3.4 /100 | #234 | Tragic 5.8% |
| Malaysians | 3.4 /100 | #235 | Tragic 5.8% |
| Immigrants | Brazil | 3.2 /100 | #236 | Tragic 5.8% |
| Sudanese | 2.9 /100 | #237 | Tragic 5.8% |
| Hungarians | 2.6 /100 | #238 | Tragic 5.8% |
Demographics Similar to Dutch by Disability Age 5 to 17
In terms of disability age 5 to 17, the demographic groups most similar to Dutch are Cheyenne (6.0%, a difference of 0.11%), Japanese (6.1%, a difference of 0.11%), Alaska Native (6.0%, a difference of 0.22%), Finnish (6.0%, a difference of 0.27%), and Immigrants from Zaire (6.0%, a difference of 0.30%).
| Demographics | Rating | Rank | Disability Age 5 to 17 |
| Sioux | 0.4 /100 | #268 | Tragic 6.0% |
| Liberians | 0.4 /100 | #269 | Tragic 6.0% |
| Immigrants | Somalia | 0.4 /100 | #270 | Tragic 6.0% |
| Immigrants | Zaire | 0.2 /100 | #271 | Tragic 6.0% |
| Finns | 0.2 /100 | #272 | Tragic 6.0% |
| Alaska Natives | 0.2 /100 | #273 | Tragic 6.0% |
| Cheyenne | 0.2 /100 | #274 | Tragic 6.0% |
| Dutch | 0.2 /100 | #275 | Tragic 6.0% |
| Japanese | 0.1 /100 | #276 | Tragic 6.1% |
| Puget Sound Salish | 0.1 /100 | #277 | Tragic 6.1% |
| Immigrants | Liberia | 0.1 /100 | #278 | Tragic 6.1% |
| Immigrants | Jamaica | 0.1 /100 | #279 | Tragic 6.1% |
| Portuguese | 0.1 /100 | #280 | Tragic 6.1% |
| Scottish | 0.0 /100 | #281 | Tragic 6.1% |
| Germans | 0.0 /100 | #282 | Tragic 6.1% |