European Receiving Food Stamps
COMPARE
European
Select to Compare
Receiving Food Stamps
European Receiving Food Stamps
9.5%
PUBLIC INCOME | FOOD STAMPS
99.6/ 100
METRIC RATING
37th/ 347
METRIC RANK
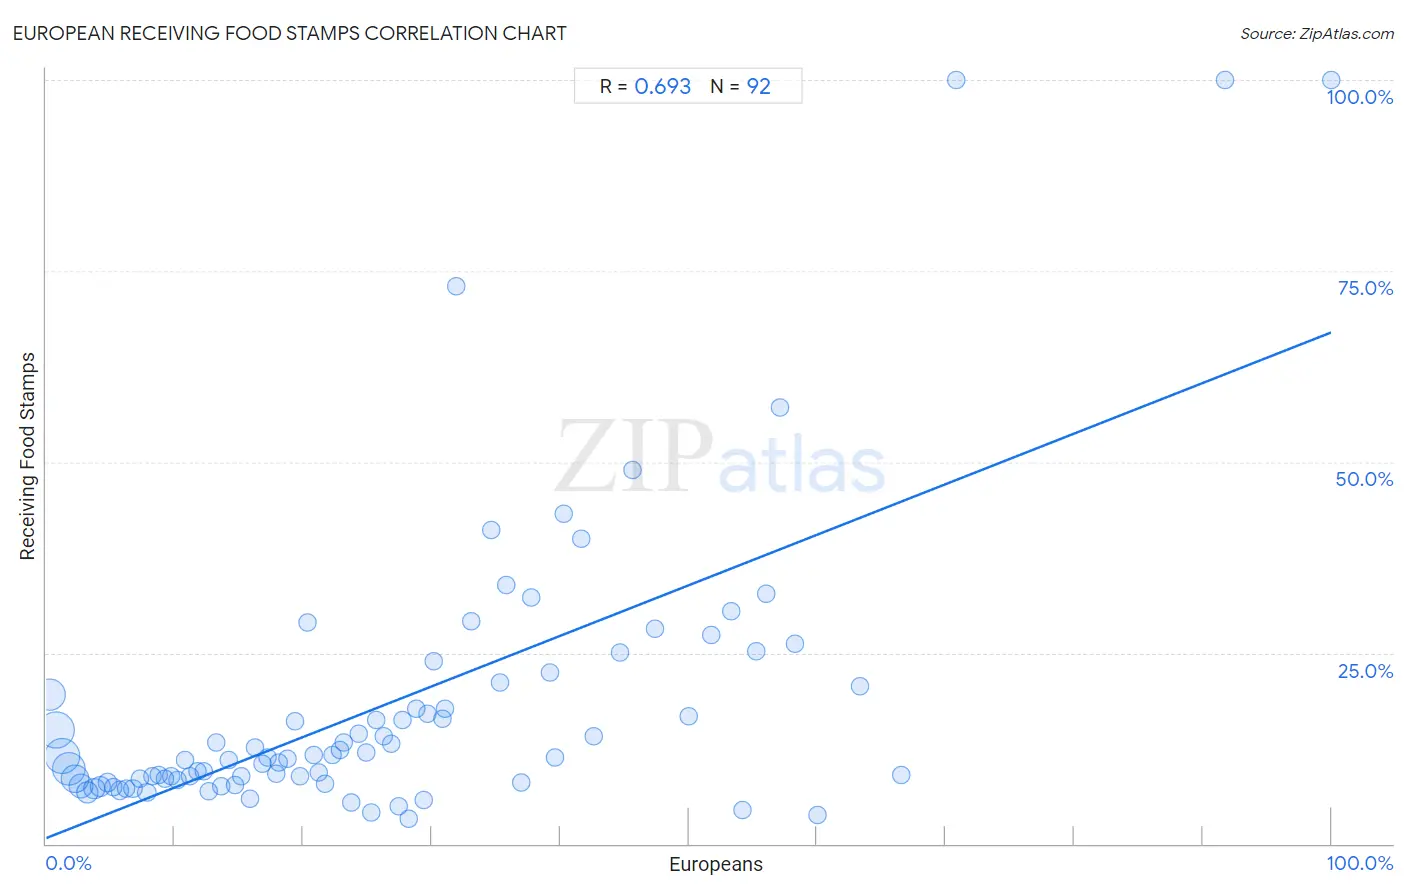
European Receiving Food Stamps Correlation Chart
The statistical analysis conducted on geographies consisting of 558,520,577 people shows a significant positive correlation between the proportion of Europeans and percentage of population receiving government assistance and/or food stamps in the United States with a correlation coefficient (R) of 0.693 and weighted average of 9.5%. On average, for every 1% (one percent) increase in Europeans within a typical geography, there is an increase of 0.66% in percentage of population receiving government assistance and/or food stamps.
It is essential to understand that the correlation between the percentage of Europeans and percentage of population receiving government assistance and/or food stamps does not imply a direct cause-and-effect relationship. It remains uncertain whether the presence of Europeans influences an upward or downward trend in the level of percentage of population receiving government assistance and/or food stamps within an area, or if Europeans simply ended up residing in those areas with higher or lower levels of percentage of population receiving government assistance and/or food stamps due to other factors.
Demographics Similar to Europeans by Receiving Food Stamps
In terms of receiving food stamps, the demographic groups most similar to Europeans are Estonian (9.5%, a difference of 0.070%), Immigrants from Austria (9.5%, a difference of 0.090%), Turkish (9.5%, a difference of 0.12%), Zimbabwean (9.5%, a difference of 0.13%), and Immigrants from Sri Lanka (9.5%, a difference of 0.29%).
| Demographics | Rating | Rank | Receiving Food Stamps |
| Immigrants from Sweden | 99.7 /100 | #30 | Exceptional 9.3% |
| Immigrants from Eastern Asia | 99.7 /100 | #31 | Exceptional 9.3% |
| Bolivians | 99.7 /100 | #32 | Exceptional 9.3% |
| Zimbabweans | 99.6 /100 | #33 | Exceptional 9.5% |
| Turks | 99.6 /100 | #34 | Exceptional 9.5% |
| Immigrants from Austria | 99.6 /100 | #35 | Exceptional 9.5% |
| Estonians | 99.6 /100 | #36 | Exceptional 9.5% |
| Europeans | 99.6 /100 | #37 | Exceptional 9.5% |
| Immigrants from Sri Lanka | 99.5 /100 | #38 | Exceptional 9.5% |
| Immigrants from Bolivia | 99.5 /100 | #39 | Exceptional 9.5% |
| Immigrants from Netherlands | 99.5 /100 | #40 | Exceptional 9.5% |
| Cambodians | 99.5 /100 | #41 | Exceptional 9.5% |
| Immigrants from China | 99.5 /100 | #42 | Exceptional 9.6% |
| Croatians | 99.5 /100 | #43 | Exceptional 9.6% |
| Immigrants from Denmark | 99.4 /100 | #44 | Exceptional 9.6% |
European Receiving Food Stamps Correlation Summary
| Measurement | European Data | Receiving Food Stamps Data |
| Minimum | 0.27% | 3.2% |
| Maximum | 100.0% | 100.0% |
| Range | 99.7% | 96.8% |
| Mean | 26.8% | 18.5% |
| Median | 23.0% | 11.4% |
| Interquartile 25% (IQ1) | 11.5% | 8.2% |
| Interquartile 75% (IQ3) | 37.4% | 20.8% |
| Interquartile Range (IQR) | 25.9% | 12.6% |
| Standard Deviation (Sample) | 20.2% | 19.3% |
| Standard Deviation (Population) | 20.1% | 19.2% |
Correlation Details
| European Percentile | Sample Size | Receiving Food Stamps |
[ 0.0% - 0.5% ] 0.27% | 84,779,293 | 19.5% |
[ 0.5% - 1.0% ] 0.76% | 110,019,301 | 14.9% |
[ 1.0% - 1.5% ] 1.25% | 105,763,806 | 11.5% |
[ 1.5% - 2.0% ] 1.73% | 86,706,761 | 9.8% |
[ 2.0% - 2.5% ] 2.23% | 58,485,326 | 8.5% |
[ 2.5% - 3.0% ] 2.73% | 39,546,741 | 7.5% |
[ 3.0% - 3.5% ] 3.23% | 23,403,482 | 6.8% |
[ 3.5% - 4.0% ] 3.74% | 15,398,287 | 7.2% |
[ 4.0% - 4.5% ] 4.20% | 11,375,694 | 7.5% |
[ 4.5% - 5.0% ] 4.73% | 6,792,525 | 7.9% |
[ 5.0% - 5.5% ] 5.23% | 4,907,478 | 7.4% |
[ 5.5% - 6.0% ] 5.75% | 2,536,705 | 7.0% |
[ 6.0% - 6.5% ] 6.25% | 1,948,573 | 7.2% |
[ 6.5% - 7.0% ] 6.74% | 1,719,357 | 7.2% |
[ 7.0% - 7.5% ] 7.25% | 811,359 | 8.6% |
[ 7.5% - 8.0% ] 7.82% | 849,748 | 6.7% |
[ 8.0% - 8.5% ] 8.28% | 564,657 | 8.9% |
[ 8.5% - 9.0% ] 8.75% | 391,212 | 9.0% |
[ 9.0% - 9.5% ] 9.20% | 396,440 | 8.6% |
[ 9.5% - 10.0% ] 9.72% | 478,995 | 8.9% |
[ 10.0% - 10.5% ] 10.19% | 231,515 | 8.4% |
[ 10.5% - 11.0% ] 10.78% | 134,392 | 10.9% |
[ 11.0% - 11.5% ] 11.23% | 151,227 | 8.9% |
[ 11.5% - 12.0% ] 11.81% | 110,767 | 9.4% |
[ 12.0% - 12.5% ] 12.29% | 113,326 | 9.5% |
[ 12.5% - 13.0% ] 12.64% | 136,753 | 6.9% |
[ 13.0% - 13.5% ] 13.26% | 45,724 | 13.3% |
[ 13.5% - 14.0% ] 13.66% | 171,329 | 7.6% |
[ 14.0% - 14.5% ] 14.21% | 45,216 | 11.0% |
[ 14.5% - 15.0% ] 14.65% | 92,419 | 7.7% |
[ 15.0% - 15.5% ] 15.22% | 72,084 | 8.9% |
[ 15.5% - 16.0% ] 15.82% | 72,974 | 5.9% |
[ 16.0% - 16.5% ] 16.24% | 7,714 | 12.5% |
[ 16.5% - 17.0% ] 16.83% | 46,007 | 10.4% |
[ 17.0% - 17.5% ] 17.22% | 35,757 | 11.3% |
[ 17.5% - 18.0% ] 17.87% | 40,423 | 9.1% |
[ 18.0% - 18.5% ] 18.14% | 21,543 | 10.7% |
[ 18.5% - 19.0% ] 18.82% | 11,360 | 11.1% |
[ 19.0% - 19.5% ] 19.36% | 14,117 | 16.0% |
[ 19.5% - 20.0% ] 19.79% | 7,958 | 8.9% |
[ 20.0% - 20.5% ] 20.36% | 4,288 | 29.0% |
[ 20.5% - 21.0% ] 20.79% | 3,977 | 11.7% |
[ 21.0% - 21.5% ] 21.20% | 13,978 | 9.3% |
[ 21.5% - 22.0% ] 21.73% | 9,912 | 7.9% |
[ 22.0% - 22.5% ] 22.25% | 3,595 | 11.6% |
[ 22.5% - 23.0% ] 22.82% | 2,919 | 12.3% |
[ 23.0% - 23.5% ] 23.13% | 2,010 | 13.3% |
[ 23.5% - 24.0% ] 23.75% | 678 | 5.4% |
[ 24.0% - 24.5% ] 24.32% | 3,717 | 14.5% |
[ 24.5% - 25.0% ] 24.90% | 1,016 | 11.9% |
[ 25.0% - 25.5% ] 25.34% | 7,756 | 4.0% |
[ 25.5% - 26.0% ] 25.66% | 2,997 | 16.2% |
[ 26.0% - 26.5% ] 26.23% | 877 | 14.0% |
[ 26.5% - 27.0% ] 26.82% | 1,592 | 13.2% |
[ 27.0% - 27.5% ] 27.43% | 711 | 4.9% |
[ 27.5% - 28.0% ] 27.70% | 870 | 16.1% |
[ 28.0% - 28.5% ] 28.16% | 3,121 | 3.2% |
[ 28.5% - 29.0% ] 28.79% | 1,365 | 17.6% |
[ 29.0% - 29.5% ] 29.35% | 920 | 5.8% |
[ 29.5% - 30.0% ] 29.63% | 1,397 | 17.0% |
[ 30.0% - 30.5% ] 30.14% | 511 | 23.9% |
[ 30.5% - 31.0% ] 30.80% | 1,555 | 16.4% |
[ 31.0% - 31.5% ] 31.07% | 988 | 17.7% |
[ 31.5% - 32.0% ] 31.90% | 116 | 73.0% |
[ 33.0% - 33.5% ] 33.08% | 529 | 29.1% |
[ 34.5% - 35.0% ] 34.65% | 3,469 | 41.2% |
[ 35.0% - 35.5% ] 35.28% | 547 | 21.1% |
[ 35.5% - 36.0% ] 35.79% | 394 | 34.0% |
[ 36.5% - 37.0% ] 37.00% | 546 | 8.1% |
[ 37.5% - 38.0% ] 37.78% | 405 | 32.3% |
[ 39.0% - 39.5% ] 39.18% | 97 | 22.5% |
[ 39.5% - 40.0% ] 39.58% | 96 | 11.3% |
[ 40.0% - 40.5% ] 40.29% | 206 | 43.2% |
[ 41.5% - 42.0% ] 41.67% | 120 | 40.0% |
[ 42.5% - 43.0% ] 42.57% | 202 | 14.0% |
[ 44.5% - 45.0% ] 44.61% | 946 | 25.1% |
[ 45.5% - 46.0% ] 45.66% | 611 | 48.9% |
[ 47.0% - 47.5% ] 47.42% | 310 | 28.2% |
[ 50.0% - 50.5% ] 50.00% | 24 | 16.7% |
[ 51.5% - 52.0% ] 51.72% | 203 | 27.3% |
[ 53.0% - 53.5% ] 53.29% | 289 | 30.4% |
[ 54.0% - 54.5% ] 54.19% | 179 | 4.5% |
[ 55.0% - 55.5% ] 55.28% | 369 | 25.2% |
[ 56.0% - 56.5% ] 56.02% | 166 | 32.8% |
[ 57.0% - 57.5% ] 57.14% | 56 | 57.1% |
[ 58.0% - 58.5% ] 58.23% | 79 | 26.2% |
[ 60.0% - 60.5% ] 60.00% | 725 | 3.7% |
[ 63.0% - 63.5% ] 63.37% | 101 | 20.6% |
[ 66.5% - 67.0% ] 66.53% | 236 | 9.0% |
[ 70.5% - 71.0% ] 70.83% | 24 | 100.0% |
[ 91.5% - 92.0% ] 91.71% | 205 | 100.0% |
[ 99.5% - 100.0% ] 100.00% | 232 | 100.0% |