Comanche vs Dutch Disability Age 5 to 17
COMPARE
Comanche
Dutch
Disability Age 5 to 17
Disability Age 5 to 17 Comparison
Comanche
Dutch
6.4%
DISABILITY AGE 5 TO 17
0.0/ 100
METRIC RATING
318th/ 347
METRIC RANK
6.0%
DISABILITY AGE 5 TO 17
0.2/ 100
METRIC RATING
275th/ 347
METRIC RANK
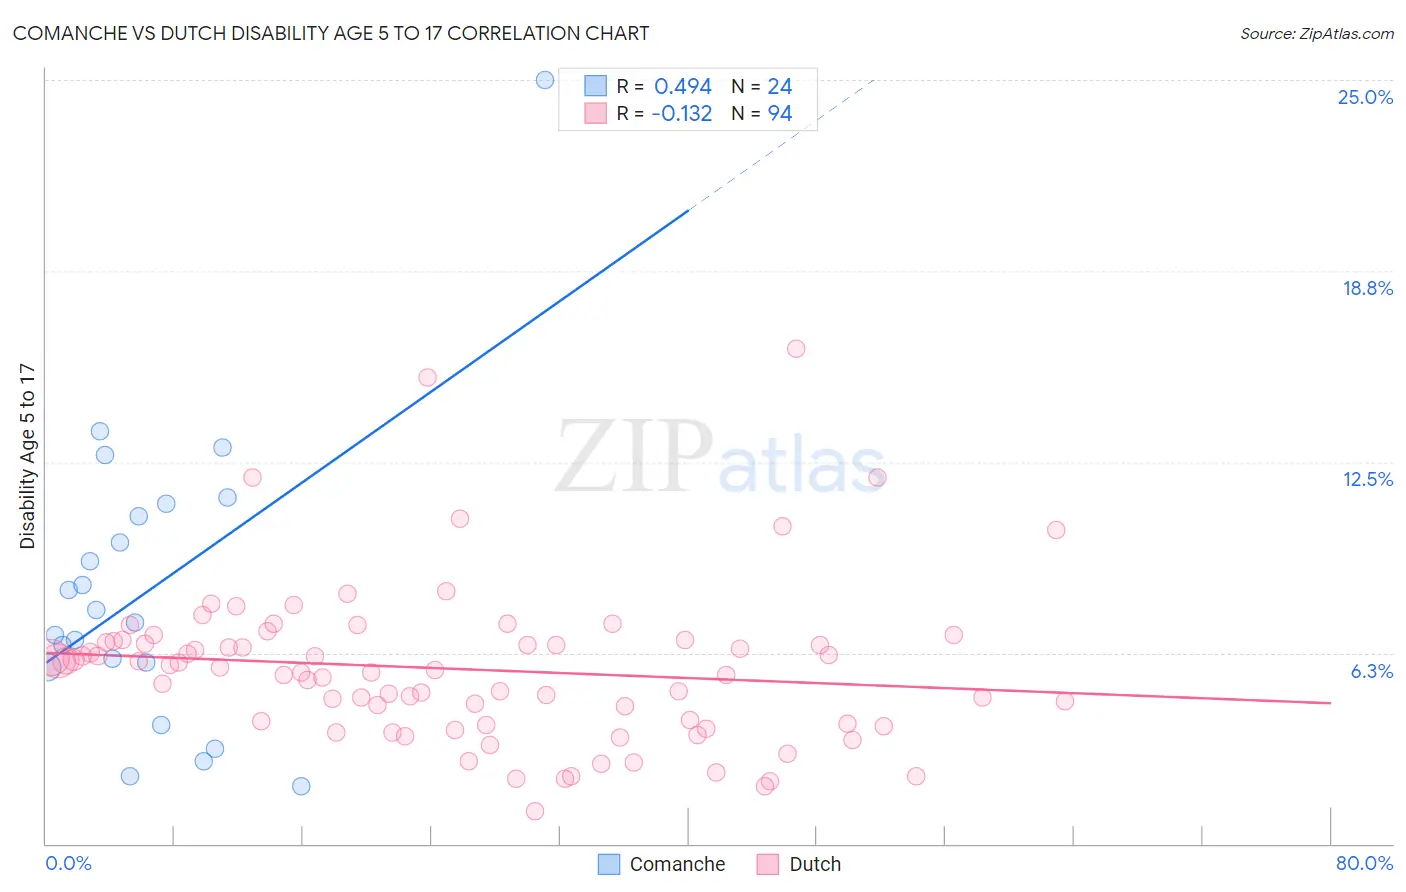
Comanche vs Dutch Disability Age 5 to 17 Correlation Chart
The statistical analysis conducted on geographies consisting of 109,534,984 people shows a moderate positive correlation between the proportion of Comanche and percentage of population with a disability between the ages 5 and 17 in the United States with a correlation coefficient (R) of 0.494 and weighted average of 6.4%. Similarly, the statistical analysis conducted on geographies consisting of 542,324,990 people shows a poor negative correlation between the proportion of Dutch and percentage of population with a disability between the ages 5 and 17 in the United States with a correlation coefficient (R) of -0.132 and weighted average of 6.0%, a difference of 6.6%.
Disability Age 5 to 17 Correlation Summary
| Measurement | Comanche | Dutch |
| Minimum | 1.9% | 1.1% |
| Maximum | 25.0% | 16.2% |
| Range | 23.1% | 15.1% |
| Mean | 8.3% | 5.7% |
| Median | 7.4% | 5.7% |
| Interquartile 25% (IQ1) | 5.9% | 3.9% |
| Interquartile 75% (IQ3) | 10.9% | 6.6% |
| Interquartile Range (IQR) | 5.1% | 2.7% |
| Standard Deviation (Sample) | 4.9% | 2.6% |
| Standard Deviation (Population) | 4.8% | 2.6% |
Similar Demographics by Disability Age 5 to 17
Demographics Similar to Comanche by Disability Age 5 to 17
In terms of disability age 5 to 17, the demographic groups most similar to Comanche are Kiowa (6.4%, a difference of 0.030%), Immigrants from Dominican Republic (6.4%, a difference of 0.16%), Immigrants from Portugal (6.4%, a difference of 0.34%), French (6.4%, a difference of 0.51%), and Delaware (6.5%, a difference of 0.55%).
| Demographics | Rating | Rank | Disability Age 5 to 17 |
| Immigrants | Dominica | 0.0 /100 | #311 | Tragic 6.3% |
| Bermudans | 0.0 /100 | #312 | Tragic 6.4% |
| Apache | 0.0 /100 | #313 | Tragic 6.4% |
| French | 0.0 /100 | #314 | Tragic 6.4% |
| Immigrants | Portugal | 0.0 /100 | #315 | Tragic 6.4% |
| Immigrants | Dominican Republic | 0.0 /100 | #316 | Tragic 6.4% |
| Kiowa | 0.0 /100 | #317 | Tragic 6.4% |
| Comanche | 0.0 /100 | #318 | Tragic 6.4% |
| Delaware | 0.0 /100 | #319 | Tragic 6.5% |
| Africans | 0.0 /100 | #320 | Tragic 6.5% |
| Tohono O'odham | 0.0 /100 | #321 | Tragic 6.5% |
| Slovaks | 0.0 /100 | #322 | Tragic 6.5% |
| Osage | 0.0 /100 | #323 | Tragic 6.5% |
| Dominicans | 0.0 /100 | #324 | Tragic 6.5% |
| Americans | 0.0 /100 | #325 | Tragic 6.5% |
Demographics Similar to Dutch by Disability Age 5 to 17
In terms of disability age 5 to 17, the demographic groups most similar to Dutch are Cheyenne (6.0%, a difference of 0.11%), Japanese (6.1%, a difference of 0.11%), Alaska Native (6.0%, a difference of 0.22%), Finnish (6.0%, a difference of 0.27%), and Immigrants from Zaire (6.0%, a difference of 0.30%).
| Demographics | Rating | Rank | Disability Age 5 to 17 |
| Sioux | 0.4 /100 | #268 | Tragic 6.0% |
| Liberians | 0.4 /100 | #269 | Tragic 6.0% |
| Immigrants | Somalia | 0.4 /100 | #270 | Tragic 6.0% |
| Immigrants | Zaire | 0.2 /100 | #271 | Tragic 6.0% |
| Finns | 0.2 /100 | #272 | Tragic 6.0% |
| Alaska Natives | 0.2 /100 | #273 | Tragic 6.0% |
| Cheyenne | 0.2 /100 | #274 | Tragic 6.0% |
| Dutch | 0.2 /100 | #275 | Tragic 6.0% |
| Japanese | 0.1 /100 | #276 | Tragic 6.1% |
| Puget Sound Salish | 0.1 /100 | #277 | Tragic 6.1% |
| Immigrants | Liberia | 0.1 /100 | #278 | Tragic 6.1% |
| Immigrants | Jamaica | 0.1 /100 | #279 | Tragic 6.1% |
| Portuguese | 0.1 /100 | #280 | Tragic 6.1% |
| Scottish | 0.0 /100 | #281 | Tragic 6.1% |
| Germans | 0.0 /100 | #282 | Tragic 6.1% |