Comanche vs Bulgarian Disability Age 5 to 17
COMPARE
Comanche
Bulgarian
Disability Age 5 to 17
Disability Age 5 to 17 Comparison
Comanche
Bulgarians
6.4%
DISABILITY AGE 5 TO 17
0.0/ 100
METRIC RATING
318th/ 347
METRIC RANK
5.2%
DISABILITY AGE 5 TO 17
99.4/ 100
METRIC RATING
85th/ 347
METRIC RANK
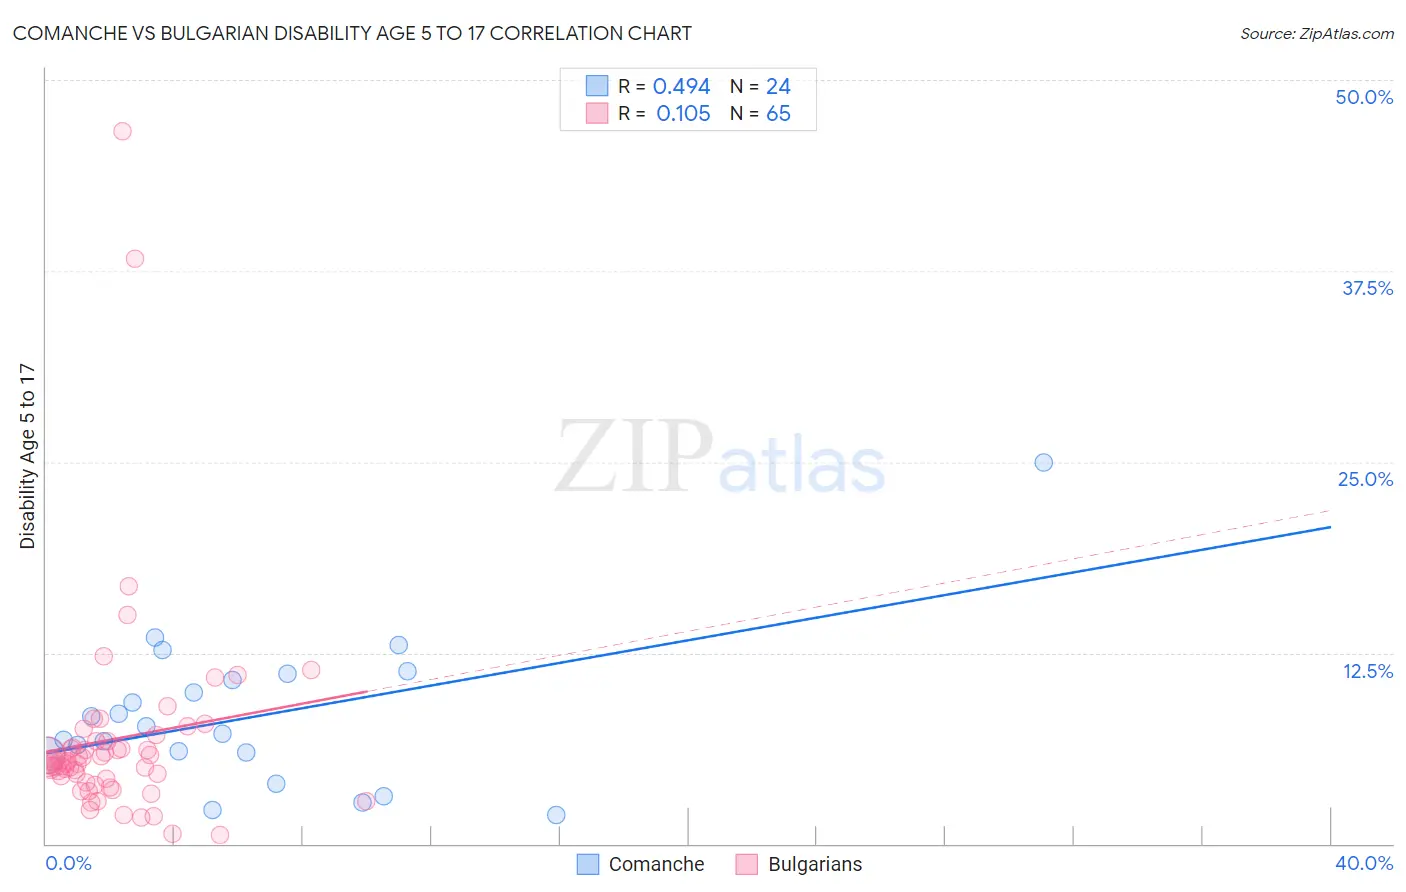
Comanche vs Bulgarian Disability Age 5 to 17 Correlation Chart
The statistical analysis conducted on geographies consisting of 109,534,984 people shows a moderate positive correlation between the proportion of Comanche and percentage of population with a disability between the ages 5 and 17 in the United States with a correlation coefficient (R) of 0.494 and weighted average of 6.4%. Similarly, the statistical analysis conducted on geographies consisting of 204,463,021 people shows a poor positive correlation between the proportion of Bulgarians and percentage of population with a disability between the ages 5 and 17 in the United States with a correlation coefficient (R) of 0.105 and weighted average of 5.2%, a difference of 22.9%.
Disability Age 5 to 17 Correlation Summary
| Measurement | Comanche | Bulgarian |
| Minimum | 1.9% | 0.57% |
| Maximum | 25.0% | 46.7% |
| Range | 23.1% | 46.1% |
| Mean | 8.3% | 6.9% |
| Median | 7.4% | 5.4% |
| Interquartile 25% (IQ1) | 5.9% | 4.1% |
| Interquartile 75% (IQ3) | 10.9% | 6.7% |
| Interquartile Range (IQR) | 5.1% | 2.6% |
| Standard Deviation (Sample) | 4.9% | 7.1% |
| Standard Deviation (Population) | 4.8% | 7.0% |
Similar Demographics by Disability Age 5 to 17
Demographics Similar to Comanche by Disability Age 5 to 17
In terms of disability age 5 to 17, the demographic groups most similar to Comanche are Kiowa (6.4%, a difference of 0.030%), Immigrants from Dominican Republic (6.4%, a difference of 0.16%), Immigrants from Portugal (6.4%, a difference of 0.34%), French (6.4%, a difference of 0.51%), and Delaware (6.5%, a difference of 0.55%).
| Demographics | Rating | Rank | Disability Age 5 to 17 |
| Immigrants | Dominica | 0.0 /100 | #311 | Tragic 6.3% |
| Bermudans | 0.0 /100 | #312 | Tragic 6.4% |
| Apache | 0.0 /100 | #313 | Tragic 6.4% |
| French | 0.0 /100 | #314 | Tragic 6.4% |
| Immigrants | Portugal | 0.0 /100 | #315 | Tragic 6.4% |
| Immigrants | Dominican Republic | 0.0 /100 | #316 | Tragic 6.4% |
| Kiowa | 0.0 /100 | #317 | Tragic 6.4% |
| Comanche | 0.0 /100 | #318 | Tragic 6.4% |
| Delaware | 0.0 /100 | #319 | Tragic 6.5% |
| Africans | 0.0 /100 | #320 | Tragic 6.5% |
| Tohono O'odham | 0.0 /100 | #321 | Tragic 6.5% |
| Slovaks | 0.0 /100 | #322 | Tragic 6.5% |
| Osage | 0.0 /100 | #323 | Tragic 6.5% |
| Dominicans | 0.0 /100 | #324 | Tragic 6.5% |
| Americans | 0.0 /100 | #325 | Tragic 6.5% |
Demographics Similar to Bulgarians by Disability Age 5 to 17
In terms of disability age 5 to 17, the demographic groups most similar to Bulgarians are Immigrants from St. Vincent and the Grenadines (5.2%, a difference of 0.040%), Immigrants from Nicaragua (5.2%, a difference of 0.070%), Eastern European (5.2%, a difference of 0.080%), Immigrants from Croatia (5.2%, a difference of 0.12%), and Immigrants from Spain (5.2%, a difference of 0.12%).
| Demographics | Rating | Rank | Disability Age 5 to 17 |
| Immigrants | Cuba | 99.6 /100 | #78 | Exceptional 5.2% |
| Afghans | 99.6 /100 | #79 | Exceptional 5.2% |
| Sri Lankans | 99.6 /100 | #80 | Exceptional 5.2% |
| Native Hawaiians | 99.6 /100 | #81 | Exceptional 5.2% |
| Immigrants | Sweden | 99.5 /100 | #82 | Exceptional 5.2% |
| Immigrants | France | 99.5 /100 | #83 | Exceptional 5.2% |
| Immigrants | Nicaragua | 99.5 /100 | #84 | Exceptional 5.2% |
| Bulgarians | 99.4 /100 | #85 | Exceptional 5.2% |
| Immigrants | St. Vincent and the Grenadines | 99.4 /100 | #86 | Exceptional 5.2% |
| Eastern Europeans | 99.4 /100 | #87 | Exceptional 5.2% |
| Immigrants | Croatia | 99.4 /100 | #88 | Exceptional 5.2% |
| Immigrants | Spain | 99.4 /100 | #89 | Exceptional 5.2% |
| Immigrants | Kuwait | 99.4 /100 | #90 | Exceptional 5.3% |
| Mongolians | 99.2 /100 | #91 | Exceptional 5.3% |
| Luxembourgers | 99.2 /100 | #92 | Exceptional 5.3% |