Greenbush, WI Map & Demographics
Greenbush Map
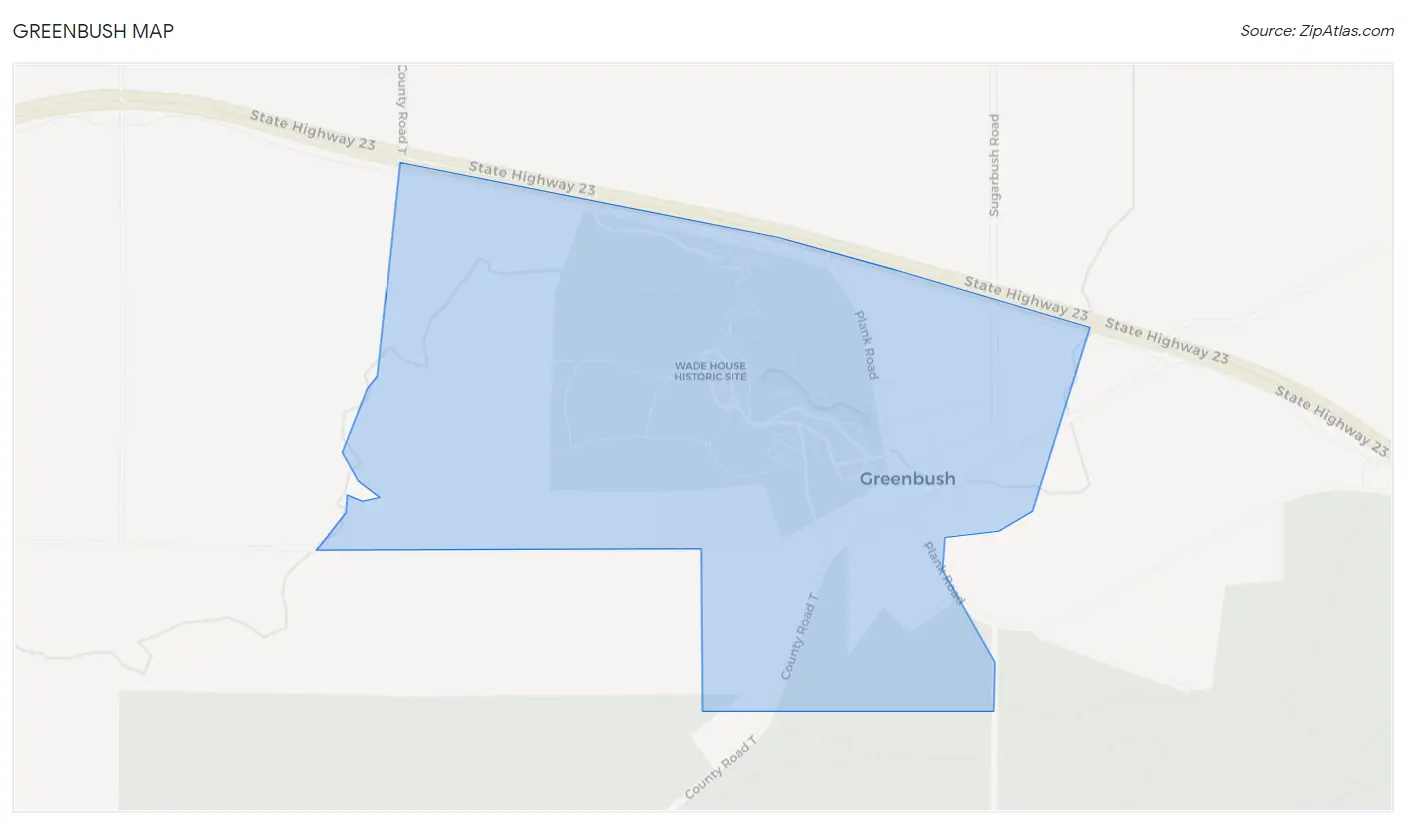
Greenbush Overview
$42,088
PER CAPITA INCOME
$99,167
AVG FAMILY INCOME
26.4%
WAGE / INCOME GAP [ % ]
73.6¢/ $1
WAGE / INCOME GAP [ $ ]
0.28
INEQUALITY / GINI INDEX
137
TOTAL POPULATION
87
MALE POPULATION
50
FEMALE POPULATION
174.00
MALES / 100 FEMALES
57.47
FEMALES / 100 MALES
40.6
MEDIAN AGE
2.4
AVG FAMILY SIZE
1.7
AVG HOUSEHOLD SIZE
110
LABOR FORCE [ PEOPLE ]
85.9%
PERCENT IN LABOR FORCE
1.8%
UNEMPLOYMENT RATE
Greenbush Area Codes
Income in Greenbush
Income Overview in Greenbush
| Characteristic | Number | Measure |
| Per Capita Income | 137 | $42,088 |
| Median Family Income | 34 | $99,167 |
| Mean Family Income | 34 | $99,403 |
| Median Household Income | 82 | $0 |
| Mean Household Income | 82 | $72,104 |
| Income Deficit | 34 | $0 |
| Wage / Income Gap (%) | 137 | 26.43% |
| Wage / Income Gap ($) | 137 | 73.57¢ per $1 |
| Gini / Inequality Index | 137 | 0.28 |
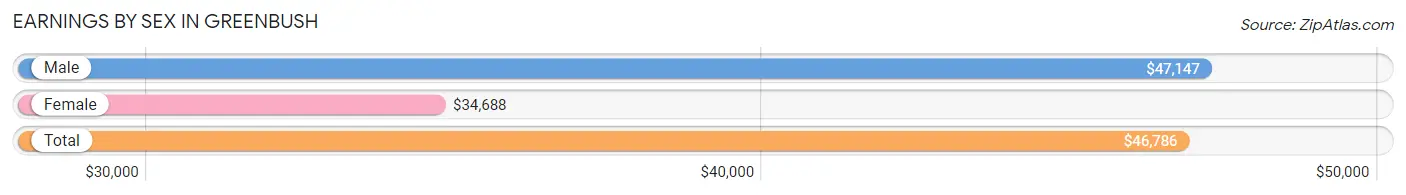
Earnings by Sex in Greenbush
Average Earnings in Greenbush are $46,786, $47,147 for men and $34,688 for women, a difference of 26.4%.
| Sex | Number | Average Earnings |
| Male | 73 (67.6%) | $47,147 |
| Female | 35 (32.4%) | $34,688 |
| Total | 108 (100.0%) | $46,786 |
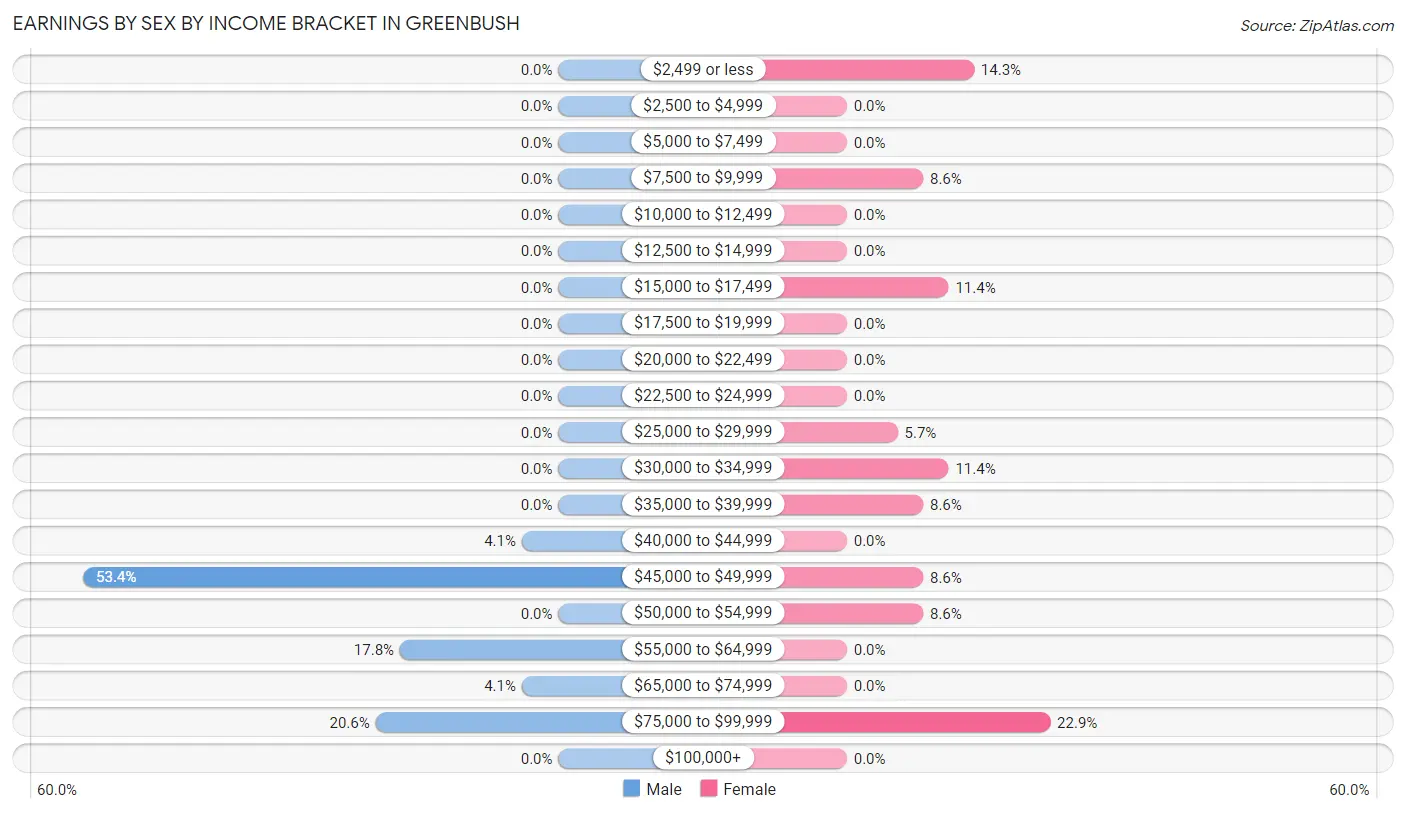
Earnings by Sex by Income Bracket in Greenbush
The most common earnings brackets in Greenbush are $45,000 to $49,999 for men (39 | 53.4%) and $75,000 to $99,999 for women (8 | 22.9%).
| Income | Male | Female |
| $2,499 or less | 0 (0.0%) | 5 (14.3%) |
| $2,500 to $4,999 | 0 (0.0%) | 0 (0.0%) |
| $5,000 to $7,499 | 0 (0.0%) | 0 (0.0%) |
| $7,500 to $9,999 | 0 (0.0%) | 3 (8.6%) |
| $10,000 to $12,499 | 0 (0.0%) | 0 (0.0%) |
| $12,500 to $14,999 | 0 (0.0%) | 0 (0.0%) |
| $15,000 to $17,499 | 0 (0.0%) | 4 (11.4%) |
| $17,500 to $19,999 | 0 (0.0%) | 0 (0.0%) |
| $20,000 to $22,499 | 0 (0.0%) | 0 (0.0%) |
| $22,500 to $24,999 | 0 (0.0%) | 0 (0.0%) |
| $25,000 to $29,999 | 0 (0.0%) | 2 (5.7%) |
| $30,000 to $34,999 | 0 (0.0%) | 4 (11.4%) |
| $35,000 to $39,999 | 0 (0.0%) | 3 (8.6%) |
| $40,000 to $44,999 | 3 (4.1%) | 0 (0.0%) |
| $45,000 to $49,999 | 39 (53.4%) | 3 (8.6%) |
| $50,000 to $54,999 | 0 (0.0%) | 3 (8.6%) |
| $55,000 to $64,999 | 13 (17.8%) | 0 (0.0%) |
| $65,000 to $74,999 | 3 (4.1%) | 0 (0.0%) |
| $75,000 to $99,999 | 15 (20.5%) | 8 (22.9%) |
| $100,000+ | 0 (0.0%) | 0 (0.0%) |
| Total | 73 (100.0%) | 35 (100.0%) |
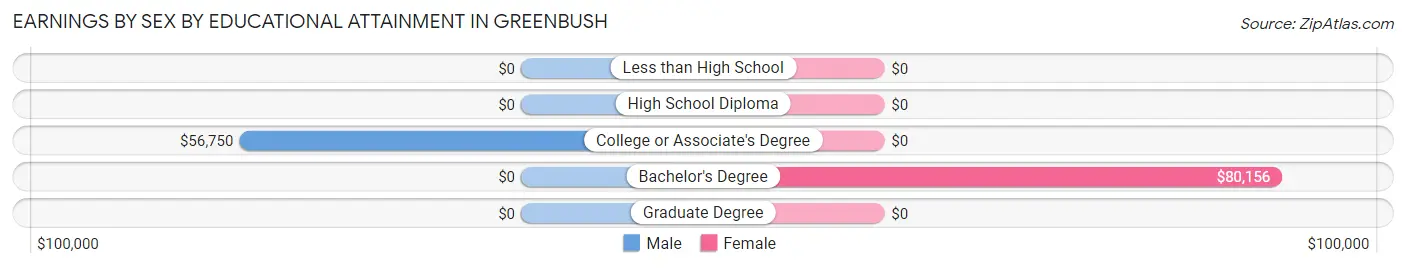
Earnings by Sex by Educational Attainment in Greenbush
Average earnings in Greenbush are $47,147 for men and $36,667 for women, a difference of 22.2%. Men with an educational attainment of college or associate's degree enjoy the highest average annual earnings of $56,750, while those with college or associate's degree education earn the least with $56,750. Women with an educational attainment of bachelor's degree earn the most with the average annual earnings of $80,156, while those with bachelor's degree education have the smallest earnings of $80,156.
| Educational Attainment | Male Income | Female Income |
| Less than High School | - | - |
| High School Diploma | - | - |
| College or Associate's Degree | $56,750 | $0 |
| Bachelor's Degree | - | - |
| Graduate Degree | - | - |
| Total | $47,147 | $36,667 |
Family Income in Greenbush
Family Income Brackets in Greenbush
According to the Greenbush family income data, there are 16 families falling into the $100,000 to $149,999 income range, which is the most common income bracket and makes up 47.1% of all families.
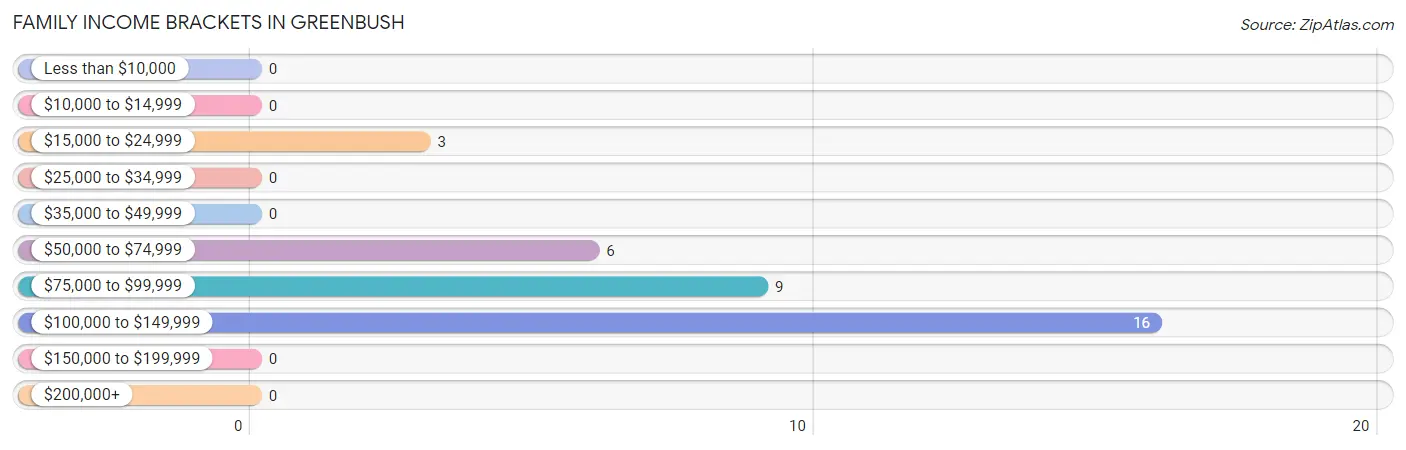
| Income Bracket | # Families | % Families |
| Less than $10,000 | 0 | 0.0% |
| $10,000 to $14,999 | 0 | 0.0% |
| $15,000 to $24,999 | 3 | 8.8% |
| $25,000 to $34,999 | 0 | 0.0% |
| $35,000 to $49,999 | 0 | 0.0% |
| $50,000 to $74,999 | 6 | 17.6% |
| $75,000 to $99,999 | 9 | 26.5% |
| $100,000 to $149,999 | 16 | 47.1% |
| $150,000 to $199,999 | 0 | 0.0% |
| $200,000+ | 0 | 0.0% |
Family Income by Famaliy Size in Greenbush
2-person families (21 | 61.8%) account for the highest median family income in Greenbush with $126,875 per family, while 2-person families (21 | 61.8%) have the highest median income of $63,438 per family member.
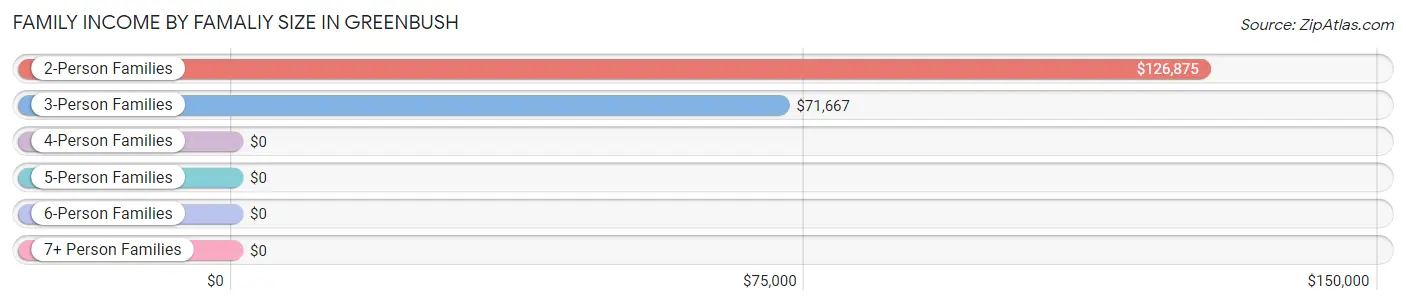
| Income Bracket | # Families | Median Income |
| 2-Person Families | 21 (61.8%) | $126,875 |
| 3-Person Families | 10 (29.4%) | $71,667 |
| 4-Person Families | 3 (8.8%) | $0 |
| 5-Person Families | 0 (0.0%) | $0 |
| 6-Person Families | 0 (0.0%) | $0 |
| 7+ Person Families | 0 (0.0%) | $0 |
| Total | 34 (100.0%) | $99,167 |
Family Income by Number of Earners in Greenbush
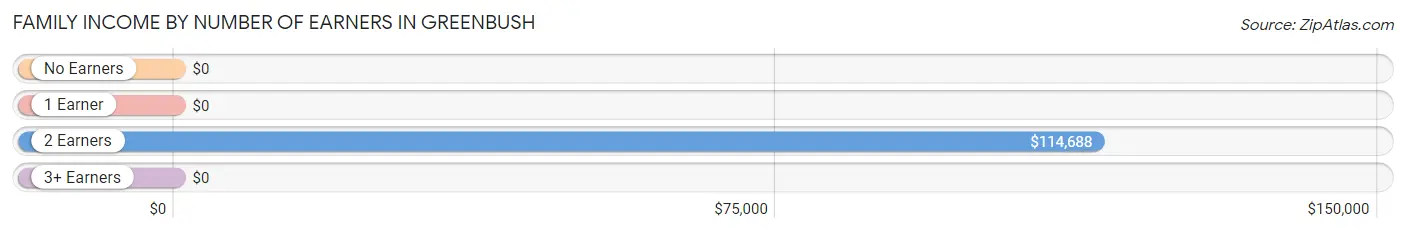
| Number of Earners | # Families | Median Income |
| No Earners | 3 (8.8%) | $0 |
| 1 Earner | 6 (17.6%) | $0 |
| 2 Earners | 25 (73.5%) | $114,688 |
| 3+ Earners | 0 (0.0%) | $0 |
| Total | 34 (100.0%) | $99,167 |
Household Income in Greenbush
Household Income Brackets in Greenbush
With 39 households falling in the category, the $35,000 to $49,999 income range is the most frequent in Greenbush, accounting for 47.6% of all households.
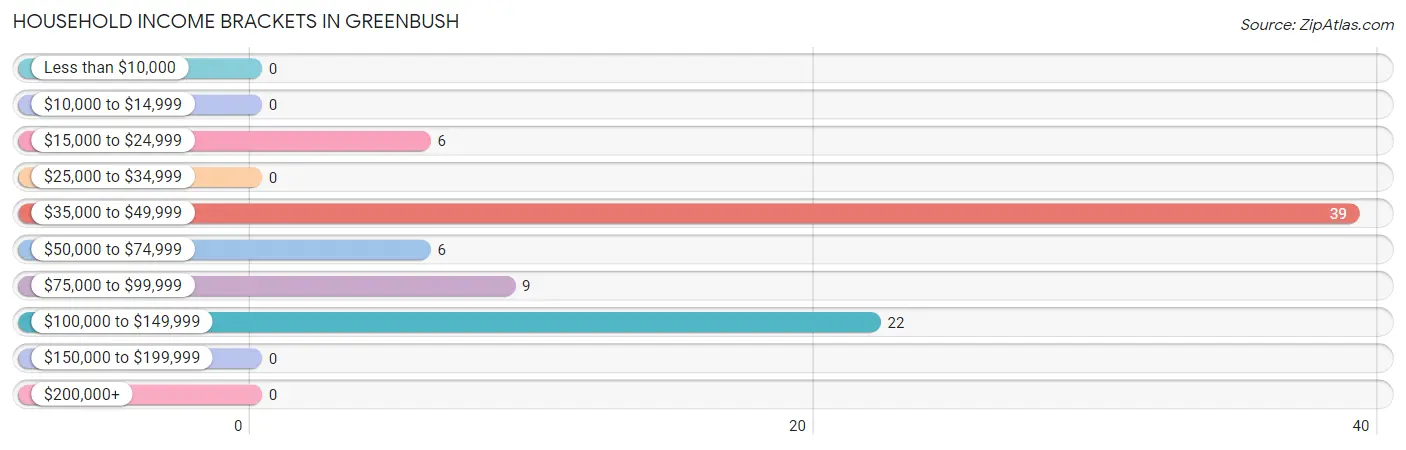
| Income Bracket | # Households | % Households |
| Less than $10,000 | 0 | 0.0% |
| $10,000 to $14,999 | 0 | 0.0% |
| $15,000 to $24,999 | 6 | 7.3% |
| $25,000 to $34,999 | 0 | 0.0% |
| $35,000 to $49,999 | 39 | 47.6% |
| $50,000 to $74,999 | 6 | 7.3% |
| $75,000 to $99,999 | 9 | 11.0% |
| $100,000 to $149,999 | 22 | 26.8% |
| $150,000 to $199,999 | 0 | 0.0% |
| $200,000+ | 0 | 0.0% |
Household Income by Householder Age in Greenbush
The median household income in Greenbush is $0, with the highest median household income of $126,875 found in the 45 to 64 years age bracket for the primary householder. A total of 21 households (25.6%) fall into this category.
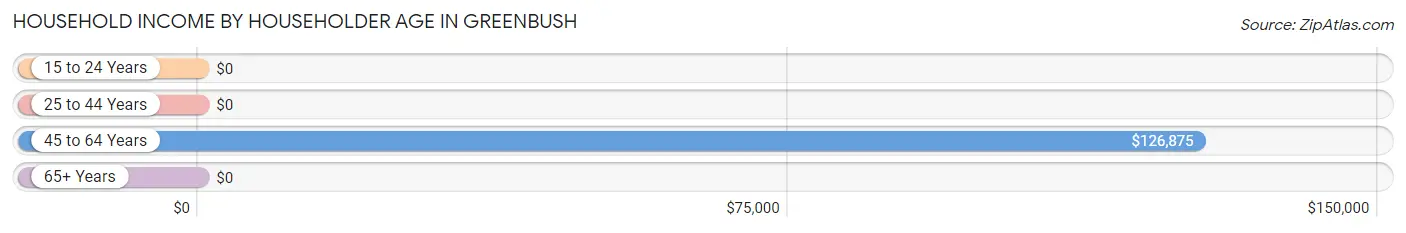
| Income Bracket | # Households | Median Income |
| 15 to 24 Years | 0 (0.0%) | $0 |
| 25 to 44 Years | 55 (67.1%) | $0 |
| 45 to 64 Years | 21 (25.6%) | $126,875 |
| 65+ Years | 6 (7.3%) | $0 |
| Total | 82 (100.0%) | $0 |
Poverty in Greenbush
Income Below Poverty by Sex and Age in Greenbush
With 6.9% poverty level for males and 6.0% for females among the residents of Greenbush, 16 and 17 year old males and 45 to 54 year old females are the most vulnerable to poverty, with 3 males (100.0%) and 3 females (27.3%) in their respective age groups living below the poverty level.
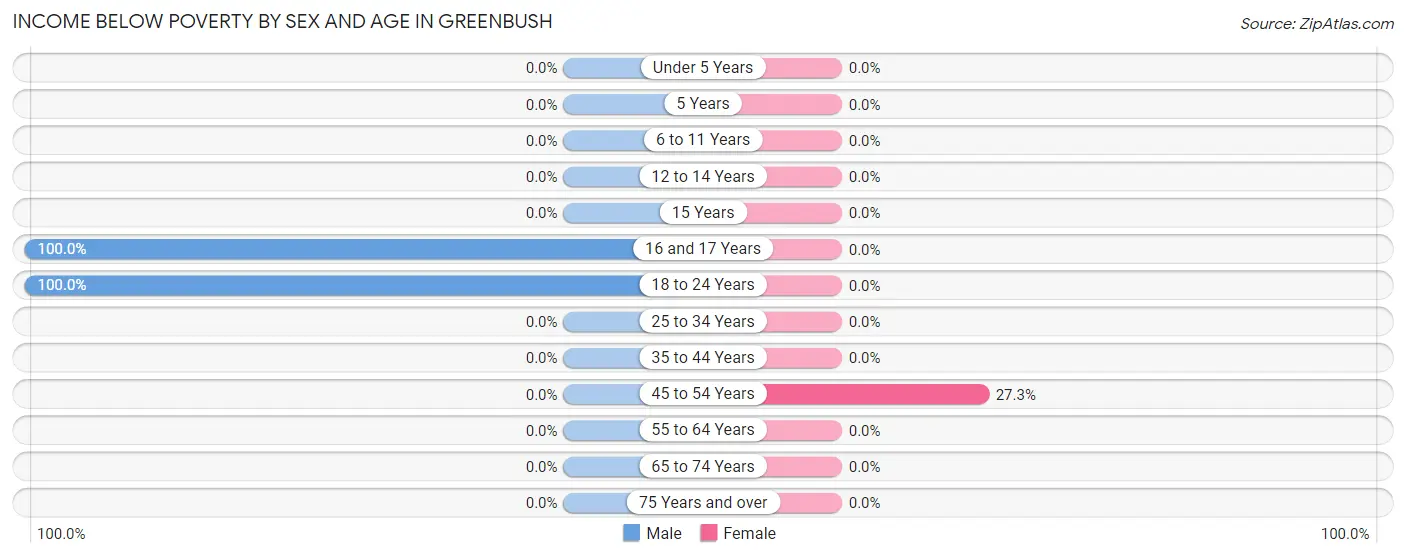
| Age Bracket | Male | Female |
| Under 5 Years | 0 (0.0%) | 0 (0.0%) |
| 5 Years | 0 (0.0%) | 0 (0.0%) |
| 6 to 11 Years | 0 (0.0%) | 0 (0.0%) |
| 12 to 14 Years | 0 (0.0%) | 0 (0.0%) |
| 15 Years | 0 (0.0%) | 0 (0.0%) |
| 16 and 17 Years | 3 (100.0%) | 0 (0.0%) |
| 18 to 24 Years | 3 (100.0%) | 0 (0.0%) |
| 25 to 34 Years | 0 (0.0%) | 0 (0.0%) |
| 35 to 44 Years | 0 (0.0%) | 0 (0.0%) |
| 45 to 54 Years | 0 (0.0%) | 3 (27.3%) |
| 55 to 64 Years | 0 (0.0%) | 0 (0.0%) |
| 65 to 74 Years | 0 (0.0%) | 0 (0.0%) |
| 75 Years and over | 0 (0.0%) | 0 (0.0%) |
| Total | 6 (6.9%) | 3 (6.0%) |
Income Above Poverty by Sex and Age in Greenbush
According to the poverty statistics in Greenbush, males aged under 5 years and females aged 12 to 14 years are the age groups that are most secure financially, with 100.0% of males and 100.0% of females in these age groups living above the poverty line.
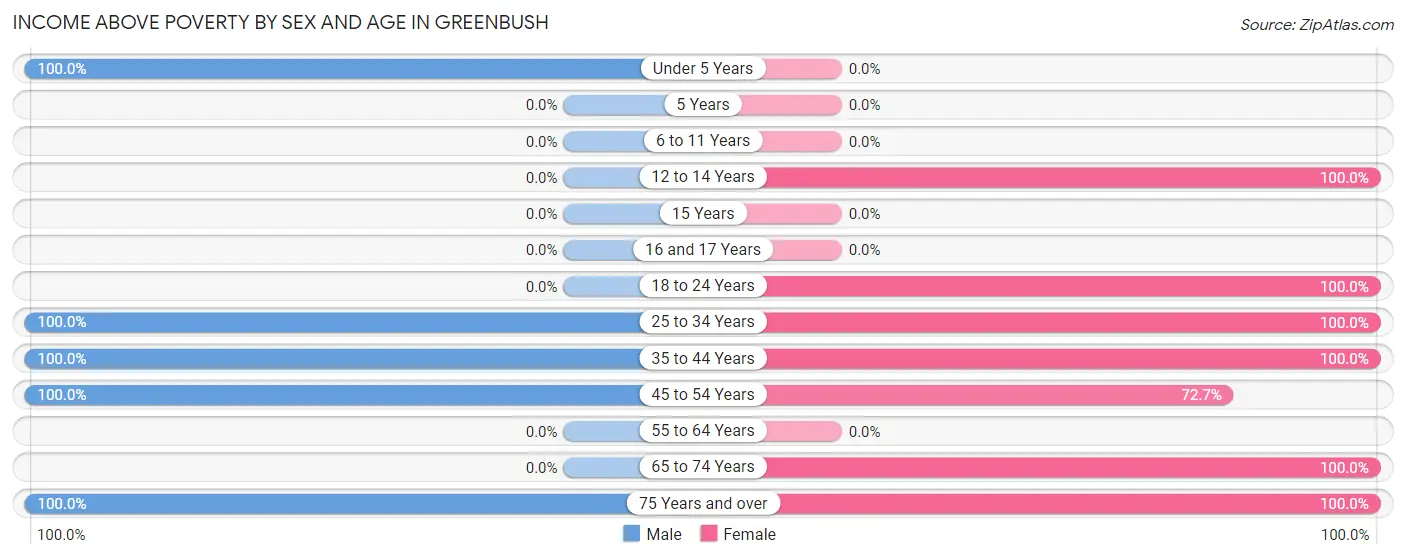
| Age Bracket | Male | Female |
| Under 5 Years | 5 (100.0%) | 0 (0.0%) |
| 5 Years | 0 (0.0%) | 0 (0.0%) |
| 6 to 11 Years | 0 (0.0%) | 0 (0.0%) |
| 12 to 14 Years | 0 (0.0%) | 4 (100.0%) |
| 15 Years | 0 (0.0%) | 0 (0.0%) |
| 16 and 17 Years | 0 (0.0%) | 0 (0.0%) |
| 18 to 24 Years | 0 (0.0%) | 5 (100.0%) |
| 25 to 34 Years | 3 (100.0%) | 15 (100.0%) |
| 35 to 44 Years | 49 (100.0%) | 9 (100.0%) |
| 45 to 54 Years | 21 (100.0%) | 8 (72.7%) |
| 55 to 64 Years | 0 (0.0%) | 0 (0.0%) |
| 65 to 74 Years | 0 (0.0%) | 3 (100.0%) |
| 75 Years and over | 3 (100.0%) | 3 (100.0%) |
| Total | 81 (93.1%) | 47 (94.0%) |
Income Below Poverty Among Married-Couple Families in Greenbush
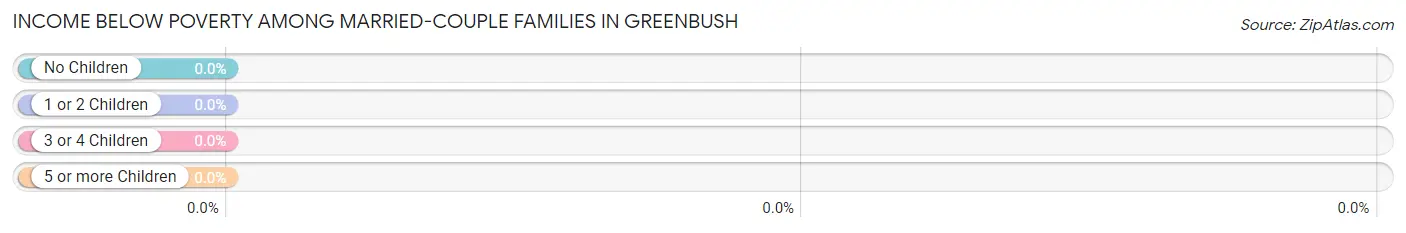
| Children | Above Poverty | Below Poverty |
| No Children | 24 (100.0%) | 0 (0.0%) |
| 1 or 2 Children | 7 (100.0%) | 0 (0.0%) |
| 3 or 4 Children | 0 (0.0%) | 0 (0.0%) |
| 5 or more Children | 0 (0.0%) | 0 (0.0%) |
| Total | 31 (100.0%) | 0 (0.0%) |
Income Below Poverty Among Single-Parent Households in Greenbush
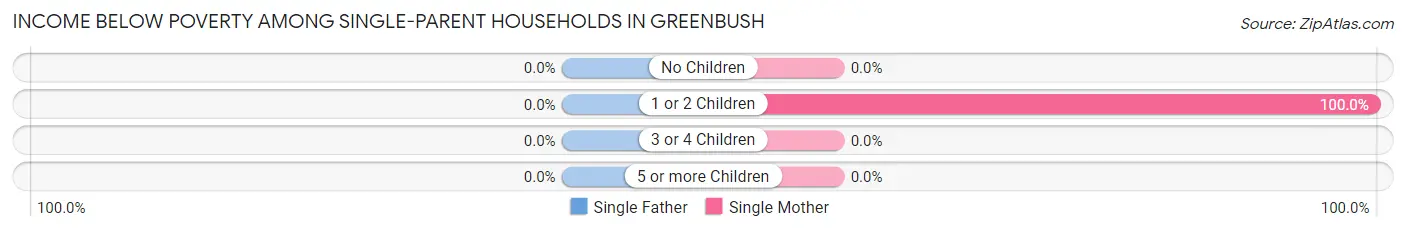
| Children | Single Father | Single Mother |
| No Children | 0 (0.0%) | 0 (0.0%) |
| 1 or 2 Children | 0 (0.0%) | 3 (100.0%) |
| 3 or 4 Children | 0 (0.0%) | 0 (0.0%) |
| 5 or more Children | 0 (0.0%) | 0 (0.0%) |
| Total | 0 (0.0%) | 3 (100.0%) |
Income Below Poverty Among Married-Couple vs Single-Parent Households in Greenbush
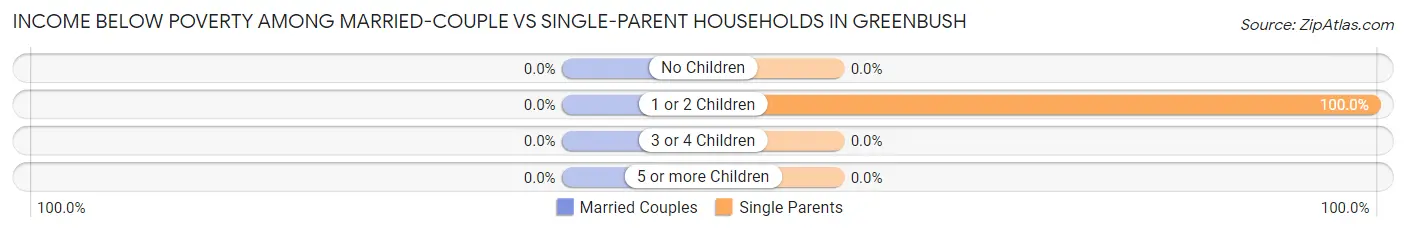
| Children | Married-Couple Families | Single-Parent Households |
| No Children | 0 (0.0%) | 0 (0.0%) |
| 1 or 2 Children | 0 (0.0%) | 3 (100.0%) |
| 3 or 4 Children | 0 (0.0%) | 0 (0.0%) |
| 5 or more Children | 0 (0.0%) | 0 (0.0%) |
| Total | 0 (0.0%) | 3 (100.0%) |
Race in Greenbush
The most populous races in Greenbush are White / Caucasian (129 | 94.2%), and Asian (8 | 5.8%).
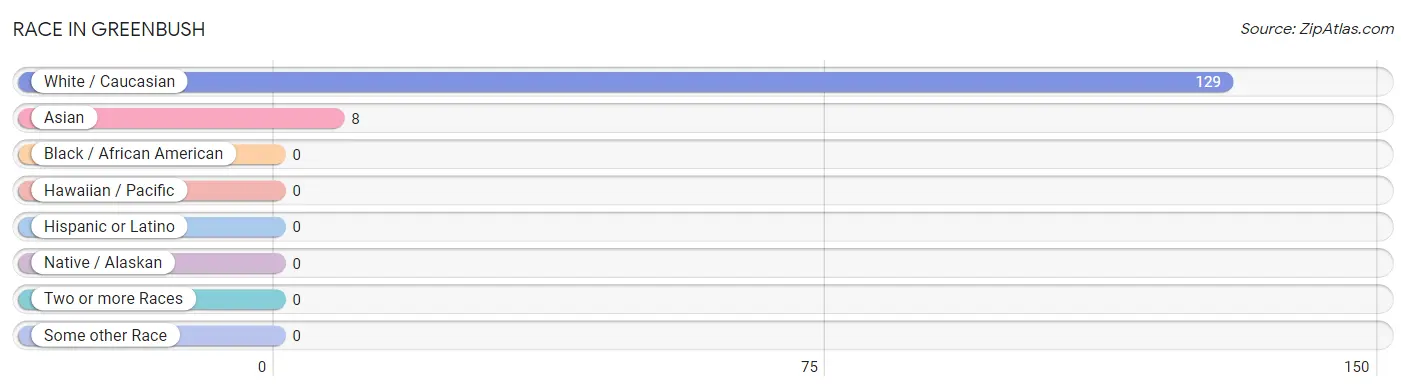
| Race | # Population | % Population |
| Asian | 8 | 5.8% |
| Black / African American | 0 | 0.0% |
| Hawaiian / Pacific | 0 | 0.0% |
| Hispanic or Latino | 0 | 0.0% |
| Native / Alaskan | 0 | 0.0% |
| White / Caucasian | 129 | 94.2% |
| Two or more Races | 0 | 0.0% |
| Some other Race | 0 | 0.0% |
| Total | 137 | 100.0% |
Ancestry in Greenbush
The most populous ancestries reported in Greenbush are German (98 | 71.5%), American (21 | 15.3%), Dutch (12 | 8.8%), Thai (8 | 5.8%), and English (7 | 5.1%), together accounting for 106.6% of all Greenbush residents.
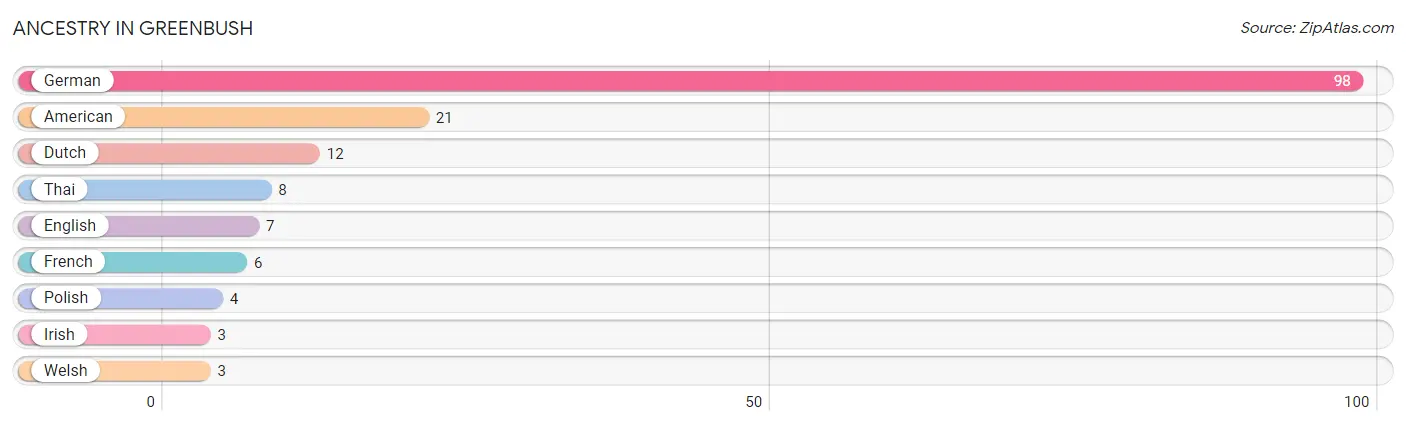
| Ancestry | # Population | % Population |
| American | 21 | 15.3% |
| Dutch | 12 | 8.8% |
| English | 7 | 5.1% |
| French | 6 | 4.4% |
| German | 98 | 71.5% |
| Irish | 3 | 2.2% |
| Polish | 4 | 2.9% |
| Thai | 8 | 5.8% |
| Welsh | 3 | 2.2% | View All 9 Rows |
Immigrants in Greenbush

| Immigration Origin | # Population | % Population | View All 0 Rows |
Sex and Age in Greenbush
Sex and Age in Greenbush
The most populous age groups in Greenbush are 40 to 44 Years (43 | 49.4%) for men and 30 to 34 Years (15 | 30.0%) for women.
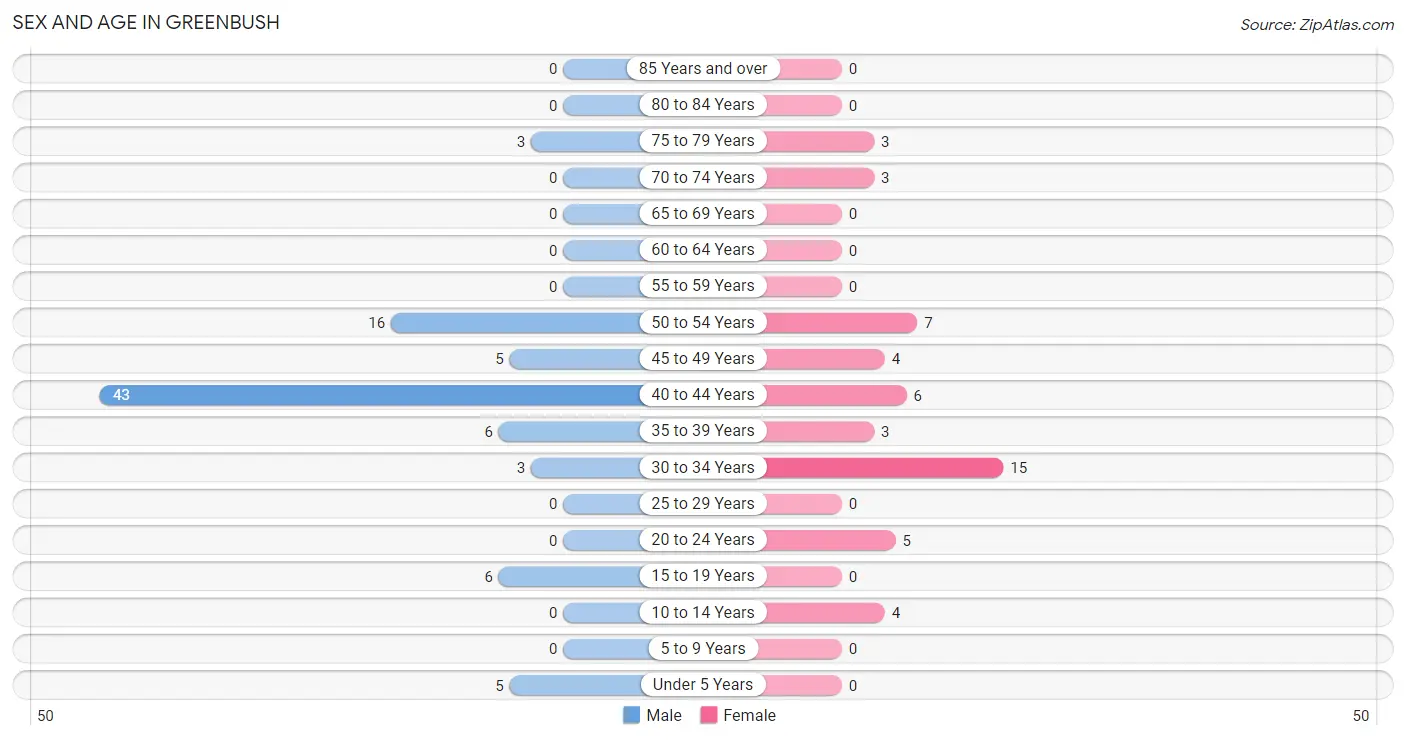
| Age Bracket | Male | Female |
| Under 5 Years | 5 (5.8%) | 0 (0.0%) |
| 5 to 9 Years | 0 (0.0%) | 0 (0.0%) |
| 10 to 14 Years | 0 (0.0%) | 4 (8.0%) |
| 15 to 19 Years | 6 (6.9%) | 0 (0.0%) |
| 20 to 24 Years | 0 (0.0%) | 5 (10.0%) |
| 25 to 29 Years | 0 (0.0%) | 0 (0.0%) |
| 30 to 34 Years | 3 (3.5%) | 15 (30.0%) |
| 35 to 39 Years | 6 (6.9%) | 3 (6.0%) |
| 40 to 44 Years | 43 (49.4%) | 6 (12.0%) |
| 45 to 49 Years | 5 (5.8%) | 4 (8.0%) |
| 50 to 54 Years | 16 (18.4%) | 7 (14.0%) |
| 55 to 59 Years | 0 (0.0%) | 0 (0.0%) |
| 60 to 64 Years | 0 (0.0%) | 0 (0.0%) |
| 65 to 69 Years | 0 (0.0%) | 0 (0.0%) |
| 70 to 74 Years | 0 (0.0%) | 3 (6.0%) |
| 75 to 79 Years | 3 (3.5%) | 3 (6.0%) |
| 80 to 84 Years | 0 (0.0%) | 0 (0.0%) |
| 85 Years and over | 0 (0.0%) | 0 (0.0%) |
| Total | 87 (100.0%) | 50 (100.0%) |
Families and Households in Greenbush
Median Family Size in Greenbush
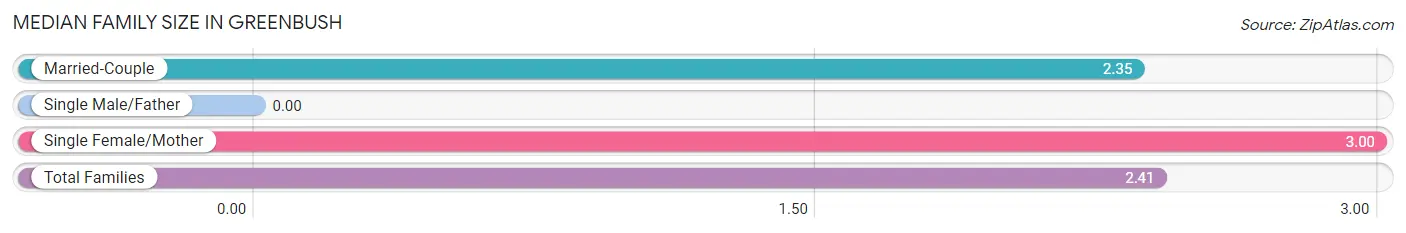
| Family Type | # Families | Family Size |
| Married-Couple | 31 (91.2%) | 2.35 |
| Single Male/Father | 0 (0.0%) | - |
| Single Female/Mother | 3 (8.8%) | 3.00 |
| Total Families | 34 (100.0%) | 2.41 |
Median Household Size in Greenbush
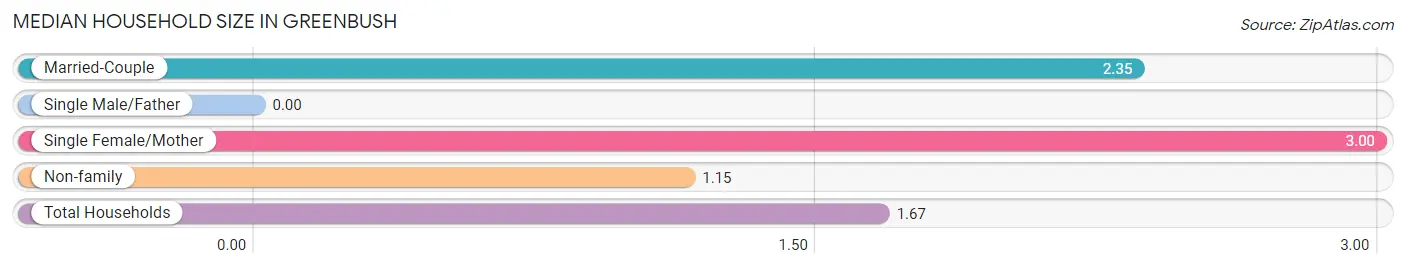
| Household Type | # Households | Household Size |
| Married-Couple | 31 (37.8%) | 2.35 |
| Single Male/Father | 0 (0.0%) | - |
| Single Female/Mother | 3 (3.7%) | 3.00 |
| Non-family | 48 (58.5%) | 1.15 |
| Total Households | 82 (100.0%) | 1.67 |
Household Size by Marriage Status in Greenbush
Out of a total of 82 households in Greenbush, 34 (41.5%) are family households, while 48 (58.5%) are nonfamily households. The most numerous type of family households are 2-person households, comprising 21, and the most common type of nonfamily households are 1-person households, comprising 42.
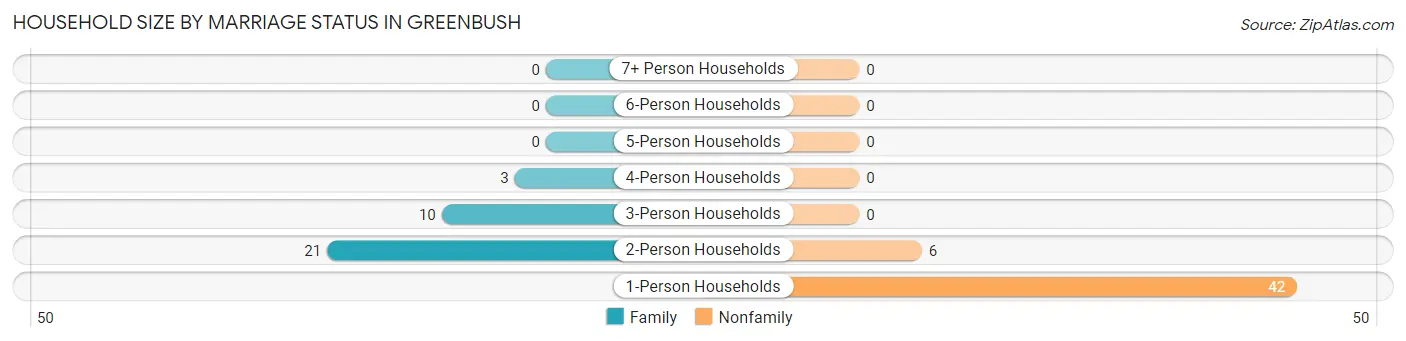
| Household Size | Family Households | Nonfamily Households |
| 1-Person Households | - | 42 (51.2%) |
| 2-Person Households | 21 (25.6%) | 6 (7.3%) |
| 3-Person Households | 10 (12.2%) | 0 (0.0%) |
| 4-Person Households | 3 (3.7%) | 0 (0.0%) |
| 5-Person Households | 0 (0.0%) | 0 (0.0%) |
| 6-Person Households | 0 (0.0%) | 0 (0.0%) |
| 7+ Person Households | 0 (0.0%) | 0 (0.0%) |
| Total | 34 (41.5%) | 48 (58.5%) |
Female Fertility in Greenbush
Fertility by Age in Greenbush
| Age Bracket | Women with Births | Births / 1,000 Women |
| 15 to 19 years | 0 (0.0%) | 0.0 |
| 20 to 34 years | 0 (0.0%) | 0.0 |
| 35 to 50 years | 0 (0.0%) | 0.0 |
| Total | 0 (0.0%) | 0.0 |
Fertility by Age by Marriage Status in Greenbush
| Age Bracket | Married | Unmarried |
| 15 to 19 years | 0 (0.0%) | 0 (0.0%) |
| 20 to 34 years | 0 (0.0%) | 0 (0.0%) |
| 35 to 50 years | 0 (0.0%) | 0 (0.0%) |
| Total | 0 (0.0%) | 0 (0.0%) |
Fertility by Education in Greenbush
| Educational Attainment | Women with Births | Births / 1,000 Women |
| Less than High School | 0 (0.0%) | 0.0 |
| High School Diploma | 0 (0.0%) | 0.0 |
| College or Associate's Degree | 0 (0.0%) | 0.0 |
| Bachelor's Degree | 0 (0.0%) | 0.0 |
| Graduate Degree | 0 (0.0%) | 0.0 |
| Total | 0 (0.0%) | 0.0 |
Fertility by Education by Marriage Status in Greenbush
| Educational Attainment | Married | Unmarried |
| Less than High School | 0 (0.0%) | 0 (0.0%) |
| High School Diploma | 0 (0.0%) | 0 (0.0%) |
| College or Associate's Degree | 0 (0.0%) | 0 (0.0%) |
| Bachelor's Degree | 0 (0.0%) | 0 (0.0%) |
| Graduate Degree | 0 (0.0%) | 0 (0.0%) |
| Total | 0 (0.0%) | 0 (0.0%) |
Employment Characteristics in Greenbush
Employment by Class of Employer in Greenbush
Among the 108 employed individuals in Greenbush, private company employees (63 | 58.3%), self-employed (incorporated) (39 | 36.1%), and local government employees (4 | 3.7%) make up the most common classes of employment.
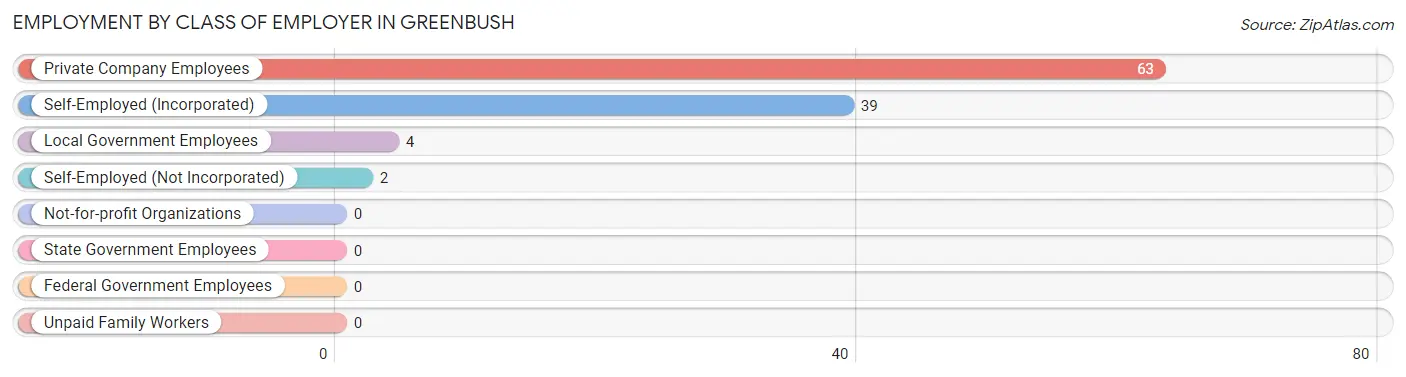
| Employer Class | # Employees | % Employees |
| Private Company Employees | 63 | 58.3% |
| Self-Employed (Incorporated) | 39 | 36.1% |
| Self-Employed (Not Incorporated) | 2 | 1.8% |
| Not-for-profit Organizations | 0 | 0.0% |
| Local Government Employees | 4 | 3.7% |
| State Government Employees | 0 | 0.0% |
| Federal Government Employees | 0 | 0.0% |
| Unpaid Family Workers | 0 | 0.0% |
| Total | 108 | 100.0% |
Employment Status by Age in Greenbush
According to the labor force statistics for Greenbush, out of the total population over 16 years of age (128), 85.9% or 110 individuals are in the labor force, with 1.8% or 2 of them unemployed. The age group with the highest labor force participation rate is 20 to 24 years, with 100.0% or 5 individuals in the labor force. Within the labor force, the 45 to 54 years age range has the highest percentage of unemployed individuals, with 6.3% or 2 of them being unemployed.
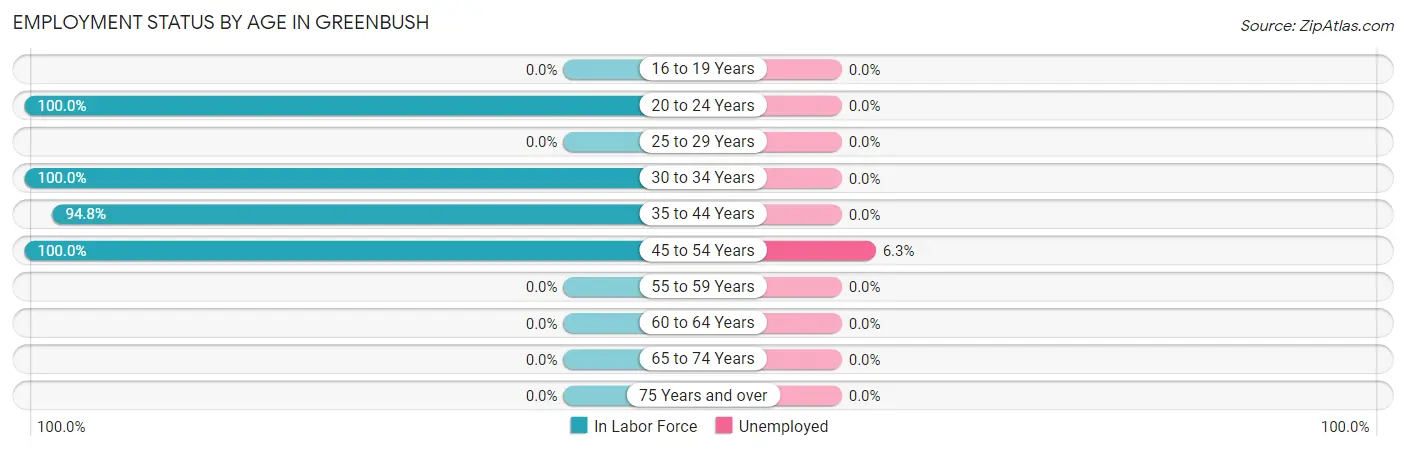
| Age Bracket | In Labor Force | Unemployed |
| 16 to 19 Years | 0 (0.0%) | 0 (0.0%) |
| 20 to 24 Years | 5 (100.0%) | 0 (0.0%) |
| 25 to 29 Years | 0 (0.0%) | 0 (0.0%) |
| 30 to 34 Years | 18 (100.0%) | 0 (0.0%) |
| 35 to 44 Years | 55 (94.8%) | 0 (0.0%) |
| 45 to 54 Years | 32 (100.0%) | 2 (6.3%) |
| 55 to 59 Years | 0 (0.0%) | 0 (0.0%) |
| 60 to 64 Years | 0 (0.0%) | 0 (0.0%) |
| 65 to 74 Years | 0 (0.0%) | 0 (0.0%) |
| 75 Years and over | 0 (0.0%) | 0 (0.0%) |
| Total | 110 (85.9%) | 2 (1.8%) |
Employment Status by Educational Attainment in Greenbush
According to labor force statistics for Greenbush, 97.2% of individuals (105) out of the total population between 25 and 64 years of age (108) are in the labor force, with 1.9% or 2 of them being unemployed. The group with the highest labor force participation rate are those with the educational attainment of less than high school, with 100.0% or 3 individuals in the labor force. Within the labor force, individuals with high school diploma education have the highest percentage of unemployment, with 4.1% or 2 of them being unemployed.
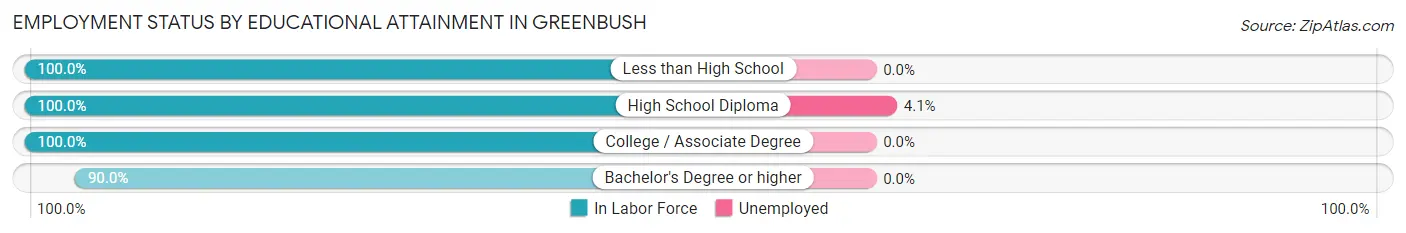
| Educational Attainment | In Labor Force | Unemployed |
| Less than High School | 3 (100.0%) | 0 (0.0%) |
| High School Diploma | 49 (100.0%) | 2 (4.1%) |
| College / Associate Degree | 26 (100.0%) | 0 (0.0%) |
| Bachelor's Degree or higher | 27 (90.0%) | 0 (0.0%) |
| Total | 105 (97.2%) | 2 (1.9%) |
Employment Occupations by Sex in Greenbush
Management, Business, Science and Arts Occupations
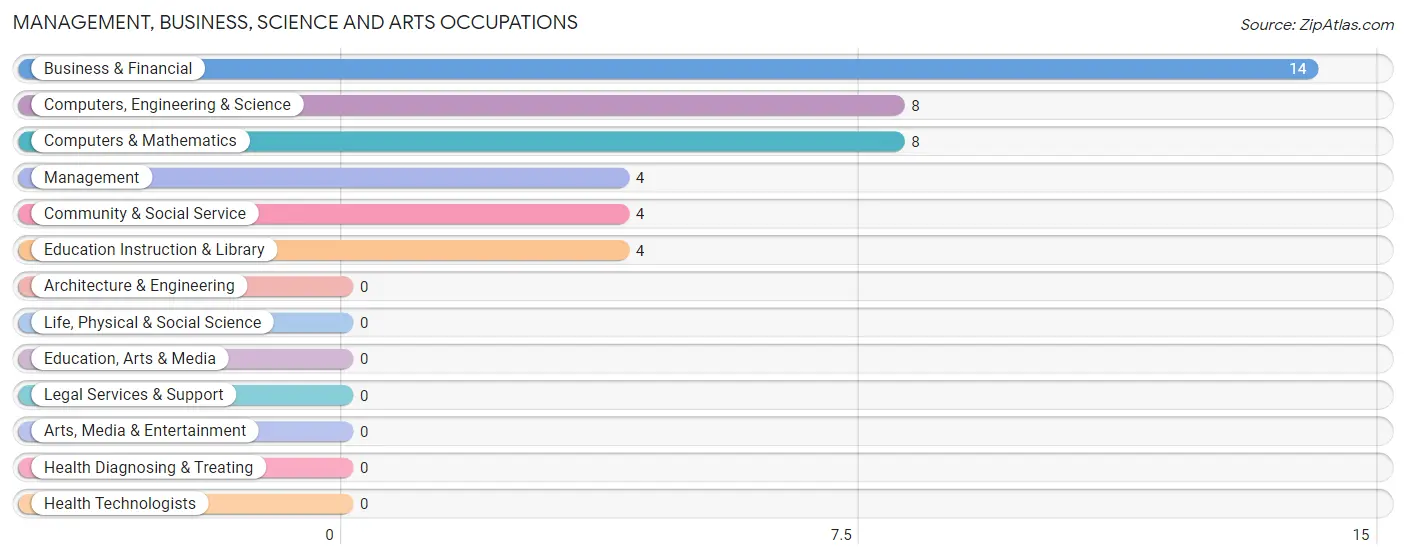
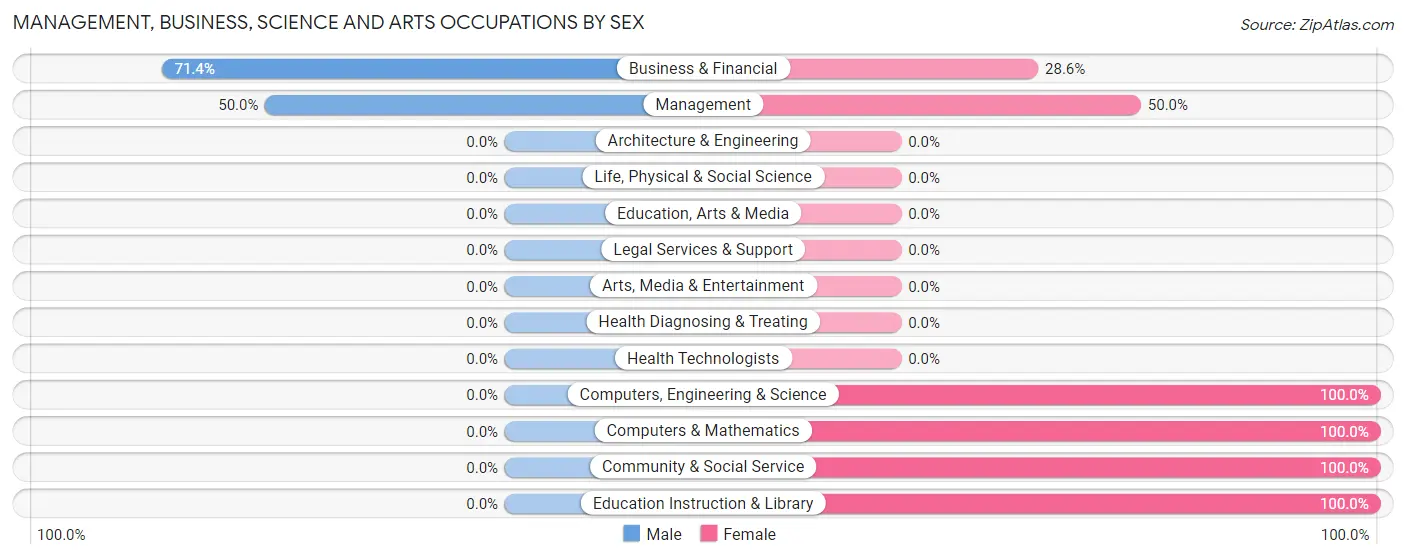
The most common Management, Business, Science and Arts occupations in Greenbush are Business & Financial (14 | 13.0%), Computers, Engineering & Science (8 | 7.4%), Computers & Mathematics (8 | 7.4%), Management (4 | 3.7%), and Community & Social Service (4 | 3.7%).
Management, Business, Science and Arts Occupations by Sex
Within the Management, Business, Science and Arts occupations in Greenbush, the most male-oriented occupations are Business & Financial (71.4%), and Management (50.0%), while the most female-oriented occupations are Computers, Engineering & Science (100.0%), Computers & Mathematics (100.0%), and Community & Social Service (100.0%).
| Occupation | Male | Female |
| Management | 2 (50.0%) | 2 (50.0%) |
| Business & Financial | 10 (71.4%) | 4 (28.6%) |
| Computers, Engineering & Science | 0 (0.0%) | 8 (100.0%) |
| Computers & Mathematics | 0 (0.0%) | 8 (100.0%) |
| Architecture & Engineering | 0 (0.0%) | 0 (0.0%) |
| Life, Physical & Social Science | 0 (0.0%) | 0 (0.0%) |
| Community & Social Service | 0 (0.0%) | 4 (100.0%) |
| Education, Arts & Media | 0 (0.0%) | 0 (0.0%) |
| Legal Services & Support | 0 (0.0%) | 0 (0.0%) |
| Education Instruction & Library | 0 (0.0%) | 4 (100.0%) |
| Arts, Media & Entertainment | 0 (0.0%) | 0 (0.0%) |
| Health Diagnosing & Treating | 0 (0.0%) | 0 (0.0%) |
| Health Technologists | 0 (0.0%) | 0 (0.0%) |
| Total (Category) | 12 (40.0%) | 18 (60.0%) |
| Total (Overall) | 73 (67.6%) | 35 (32.4%) |
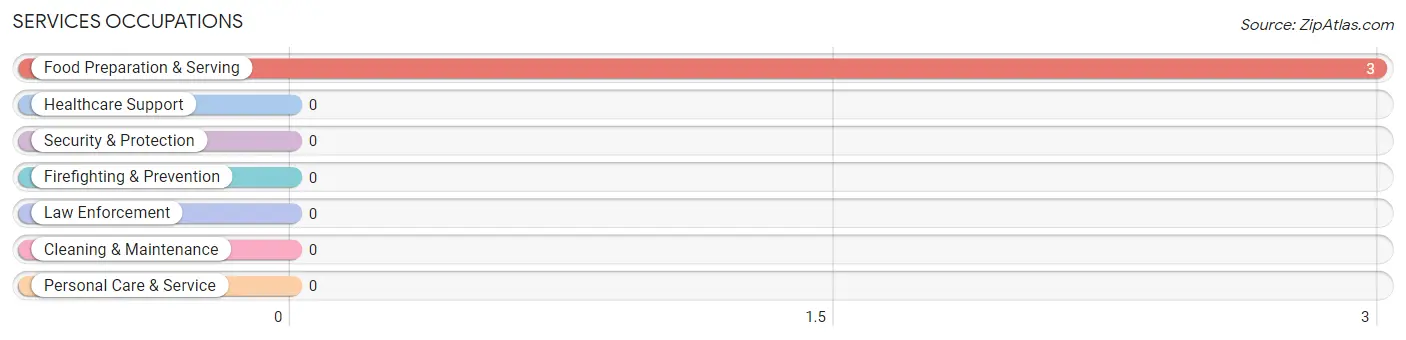
Services Occupations
The most common Services occupations in Greenbush are , and Food Preparation & Serving (3 | 2.8%).
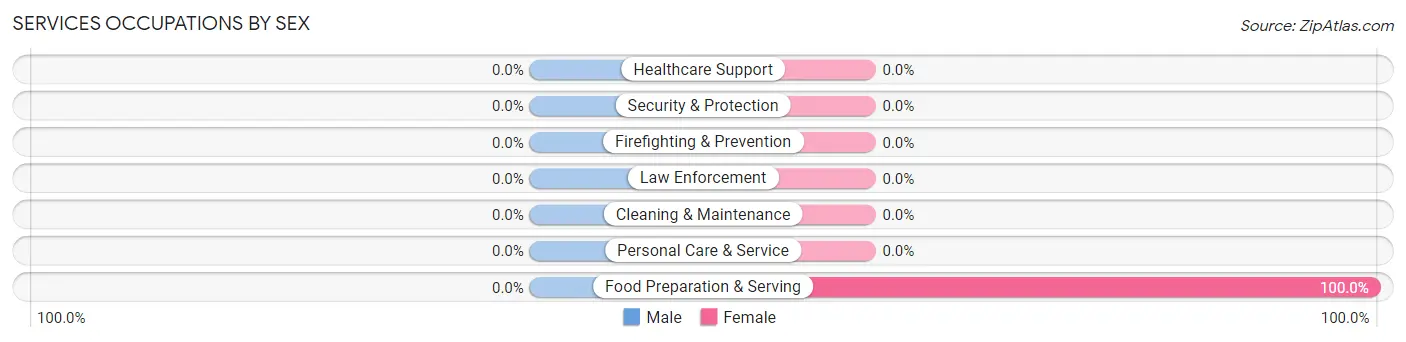
Services Occupations by Sex
| Occupation | Male | Female |
| Healthcare Support | 0 (0.0%) | 0 (0.0%) |
| Security & Protection | 0 (0.0%) | 0 (0.0%) |
| Firefighting & Prevention | 0 (0.0%) | 0 (0.0%) |
| Law Enforcement | 0 (0.0%) | 0 (0.0%) |
| Food Preparation & Serving | 0 (0.0%) | 3 (100.0%) |
| Cleaning & Maintenance | 0 (0.0%) | 0 (0.0%) |
| Personal Care & Service | 0 (0.0%) | 0 (0.0%) |
| Total (Category) | 0 (0.0%) | 3 (100.0%) |
| Total (Overall) | 73 (67.6%) | 35 (32.4%) |
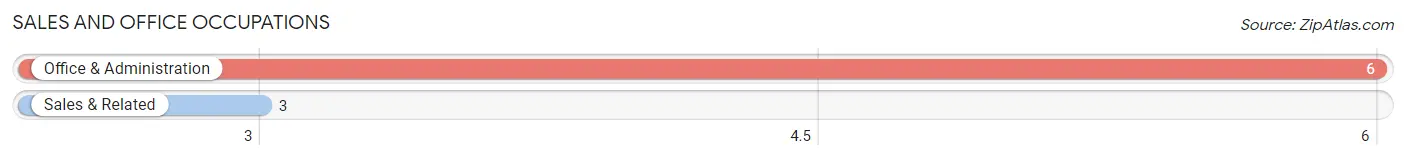
Sales and Office Occupations
The most common Sales and Office occupations in Greenbush are Office & Administration (6 | 5.6%), and Sales & Related (3 | 2.8%).
Sales and Office Occupations by Sex

| Occupation | Male | Female |
| Sales & Related | 3 (100.0%) | 0 (0.0%) |
| Office & Administration | 3 (50.0%) | 3 (50.0%) |
| Total (Category) | 6 (66.7%) | 3 (33.3%) |
| Total (Overall) | 73 (67.6%) | 35 (32.4%) |
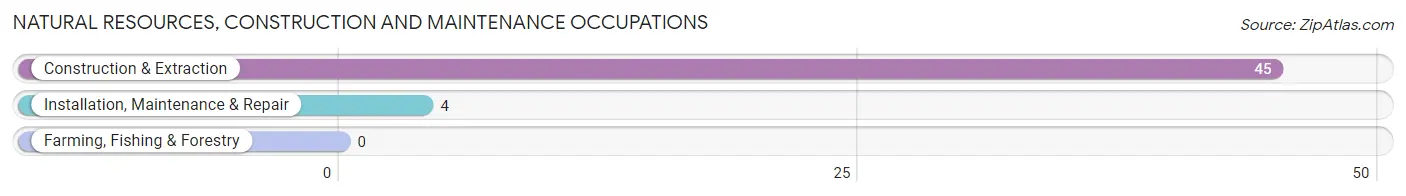
Natural Resources, Construction and Maintenance Occupations
The most common Natural Resources, Construction and Maintenance occupations in Greenbush are Construction & Extraction (45 | 41.7%), and Installation, Maintenance & Repair (4 | 3.7%).
Natural Resources, Construction and Maintenance Occupations by Sex
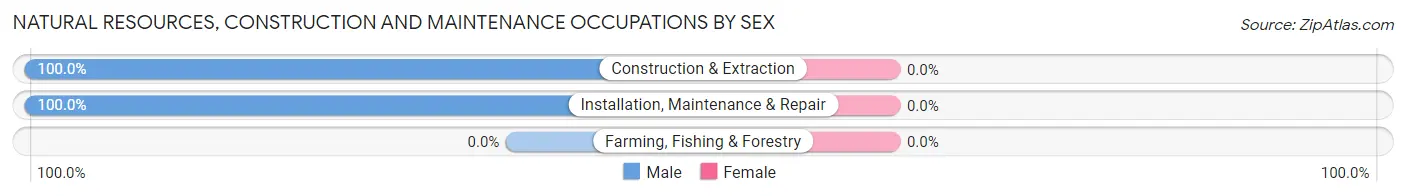
| Occupation | Male | Female |
| Farming, Fishing & Forestry | 0 (0.0%) | 0 (0.0%) |
| Construction & Extraction | 45 (100.0%) | 0 (0.0%) |
| Installation, Maintenance & Repair | 4 (100.0%) | 0 (0.0%) |
| Total (Category) | 49 (100.0%) | 0 (0.0%) |
| Total (Overall) | 73 (67.6%) | 35 (32.4%) |
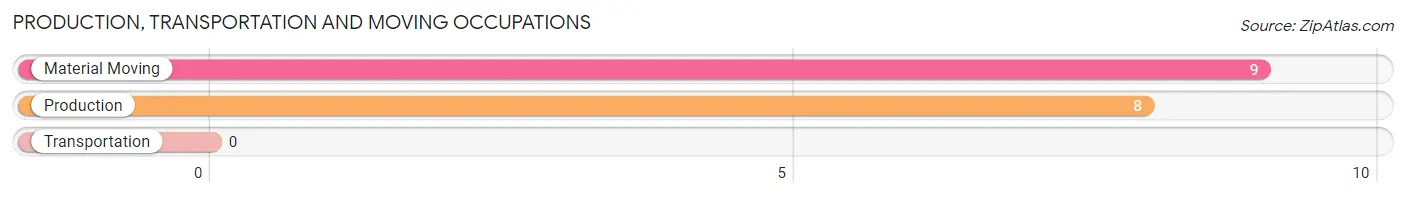
Production, Transportation and Moving Occupations
The most common Production, Transportation and Moving occupations in Greenbush are Material Moving (9 | 8.3%), and Production (8 | 7.4%).
Production, Transportation and Moving Occupations by Sex
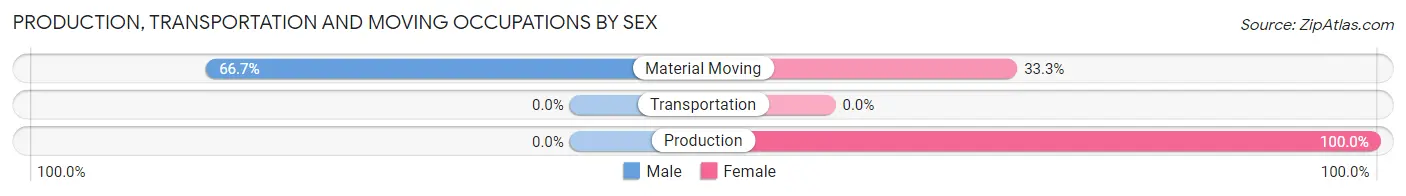
| Occupation | Male | Female |
| Production | 0 (0.0%) | 8 (100.0%) |
| Transportation | 0 (0.0%) | 0 (0.0%) |
| Material Moving | 6 (66.7%) | 3 (33.3%) |
| Total (Category) | 6 (35.3%) | 11 (64.7%) |
| Total (Overall) | 73 (67.6%) | 35 (32.4%) |
Employment Industries by Sex in Greenbush
Employment Industries in Greenbush
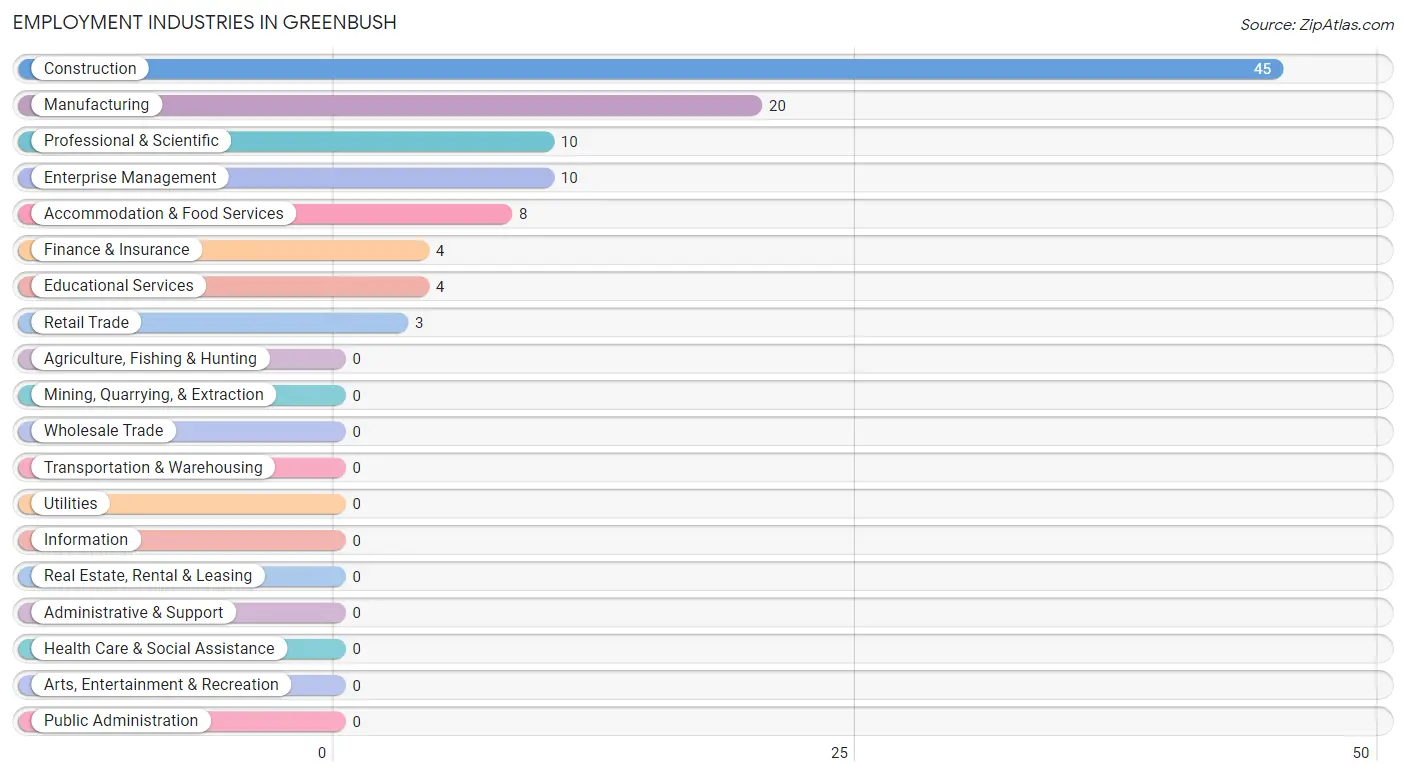
The major employment industries in Greenbush include Construction (45 | 41.7%), Manufacturing (20 | 18.5%), Professional & Scientific (10 | 9.3%), Enterprise Management (10 | 9.3%), and Accommodation & Food Services (8 | 7.4%).
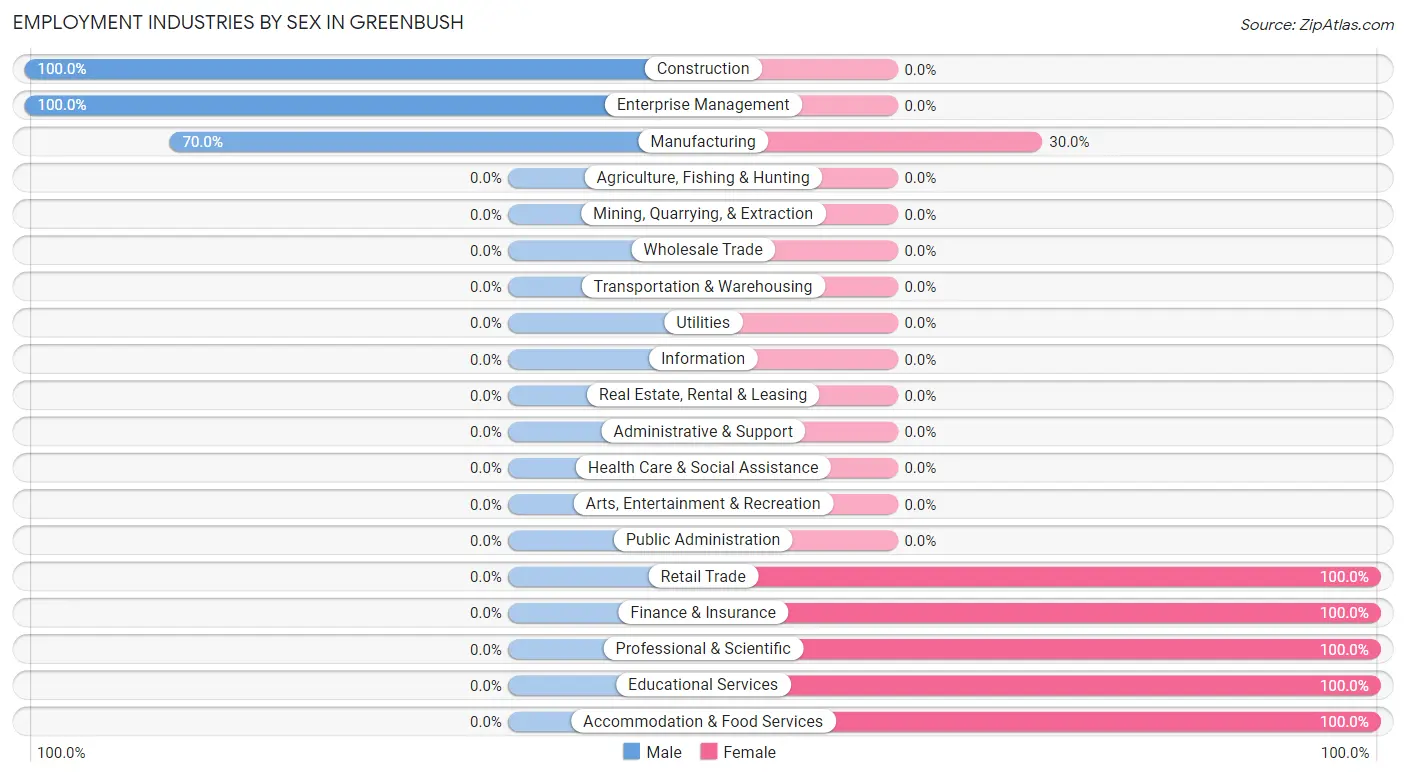
Employment Industries by Sex in Greenbush
The Greenbush industries that see more men than women are Construction (100.0%), Enterprise Management (100.0%), and Manufacturing (70.0%), whereas the industries that tend to have a higher number of women are Retail Trade (100.0%), Finance & Insurance (100.0%), and Professional & Scientific (100.0%).
| Industry | Male | Female |
| Agriculture, Fishing & Hunting | 0 (0.0%) | 0 (0.0%) |
| Mining, Quarrying, & Extraction | 0 (0.0%) | 0 (0.0%) |
| Construction | 45 (100.0%) | 0 (0.0%) |
| Manufacturing | 14 (70.0%) | 6 (30.0%) |
| Wholesale Trade | 0 (0.0%) | 0 (0.0%) |
| Retail Trade | 0 (0.0%) | 3 (100.0%) |
| Transportation & Warehousing | 0 (0.0%) | 0 (0.0%) |
| Utilities | 0 (0.0%) | 0 (0.0%) |
| Information | 0 (0.0%) | 0 (0.0%) |
| Finance & Insurance | 0 (0.0%) | 4 (100.0%) |
| Real Estate, Rental & Leasing | 0 (0.0%) | 0 (0.0%) |
| Professional & Scientific | 0 (0.0%) | 10 (100.0%) |
| Enterprise Management | 10 (100.0%) | 0 (0.0%) |
| Administrative & Support | 0 (0.0%) | 0 (0.0%) |
| Educational Services | 0 (0.0%) | 4 (100.0%) |
| Health Care & Social Assistance | 0 (0.0%) | 0 (0.0%) |
| Arts, Entertainment & Recreation | 0 (0.0%) | 0 (0.0%) |
| Accommodation & Food Services | 0 (0.0%) | 8 (100.0%) |
| Public Administration | 0 (0.0%) | 0 (0.0%) |
| Total | 73 (67.6%) | 35 (32.4%) |
Education in Greenbush
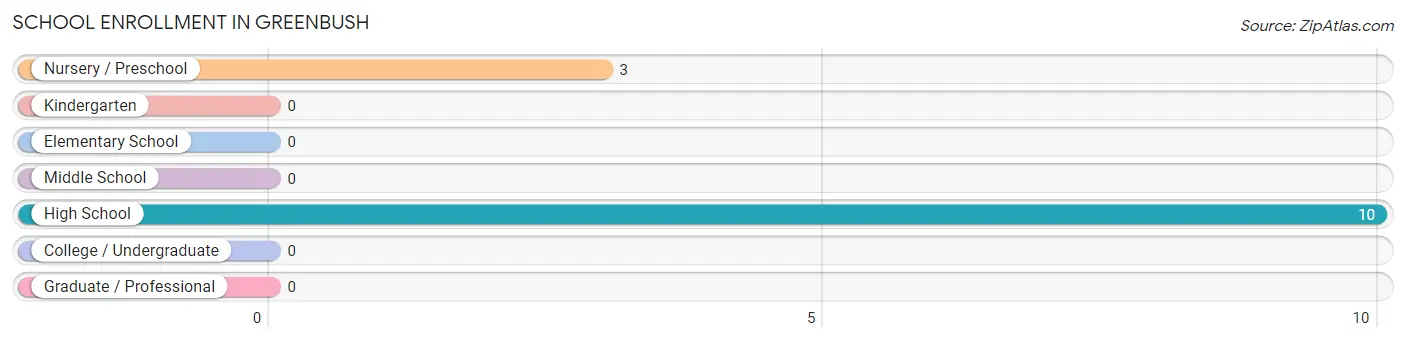
School Enrollment in Greenbush
The most common levels of schooling among the 13 students in Greenbush are high school (10 | 76.9%), and nursery / preschool (3 | 23.1%).
| School Level | # Students | % Students |
| Nursery / Preschool | 3 | 23.1% |
| Kindergarten | 0 | 0.0% |
| Elementary School | 0 | 0.0% |
| Middle School | 0 | 0.0% |
| High School | 10 | 76.9% |
| College / Undergraduate | 0 | 0.0% |
| Graduate / Professional | 0 | 0.0% |
| Total | 13 | 100.0% |
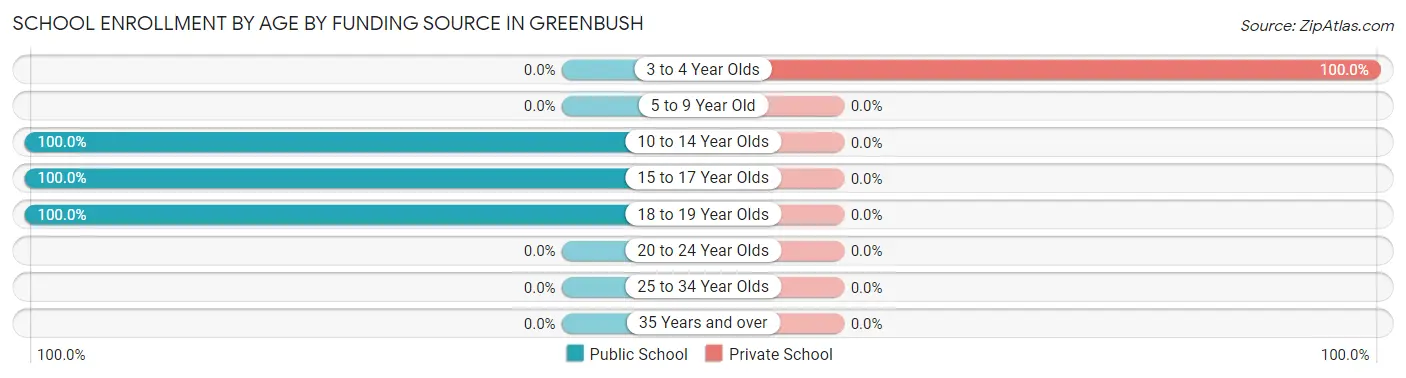
School Enrollment by Age by Funding Source in Greenbush
Out of a total of 13 students who are enrolled in schools in Greenbush, 3 (23.1%) attend a private institution, while the remaining 10 (76.9%) are enrolled in public schools. The age group of 3 to 4 year olds has the highest likelihood of being enrolled in private schools, with 3 (100.0% in the age bracket) enrolled. Conversely, the age group of 10 to 14 year olds has the lowest likelihood of being enrolled in a private school, with 4 (100.0% in the age bracket) attending a public institution.
| Age Bracket | Public School | Private School |
| 3 to 4 Year Olds | 0 (0.0%) | 3 (100.0%) |
| 5 to 9 Year Old | 0 (0.0%) | 0 (0.0%) |
| 10 to 14 Year Olds | 4 (100.0%) | 0 (0.0%) |
| 15 to 17 Year Olds | 3 (100.0%) | 0 (0.0%) |
| 18 to 19 Year Olds | 3 (100.0%) | 0 (0.0%) |
| 20 to 24 Year Olds | 0 (0.0%) | 0 (0.0%) |
| 25 to 34 Year Olds | 0 (0.0%) | 0 (0.0%) |
| 35 Years and over | 0 (0.0%) | 0 (0.0%) |
| Total | 10 (76.9%) | 3 (23.1%) |
Educational Attainment by Field of Study in Greenbush
Computers & mathematics (8 | 26.7%), business (8 | 26.7%), social sciences (4 | 13.3%), education (4 | 13.3%), and bio, nature & agricultural (3 | 10.0%) are the most common fields of study among 30 individuals in Greenbush who have obtained a bachelor's degree or higher.
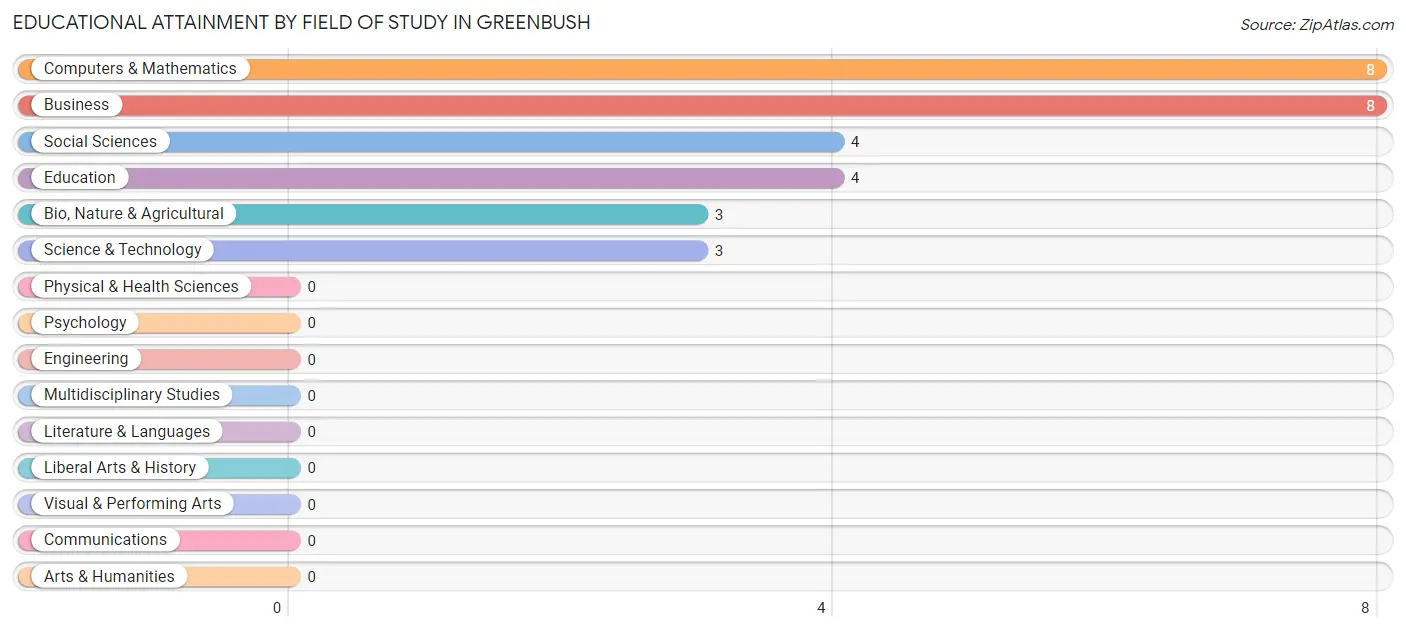
| Field of Study | # Graduates | % Graduates |
| Computers & Mathematics | 8 | 26.7% |
| Bio, Nature & Agricultural | 3 | 10.0% |
| Physical & Health Sciences | 0 | 0.0% |
| Psychology | 0 | 0.0% |
| Social Sciences | 4 | 13.3% |
| Engineering | 0 | 0.0% |
| Multidisciplinary Studies | 0 | 0.0% |
| Science & Technology | 3 | 10.0% |
| Business | 8 | 26.7% |
| Education | 4 | 13.3% |
| Literature & Languages | 0 | 0.0% |
| Liberal Arts & History | 0 | 0.0% |
| Visual & Performing Arts | 0 | 0.0% |
| Communications | 0 | 0.0% |
| Arts & Humanities | 0 | 0.0% |
| Total | 30 | 100.0% |
Transportation & Commute in Greenbush
Vehicle Availability by Sex in Greenbush
The most prevalent vehicle ownership categories in Greenbush are males with 3 vehicles (44, accounting for 60.3%) and females with 3 vehicles (5, making up 125.7%).
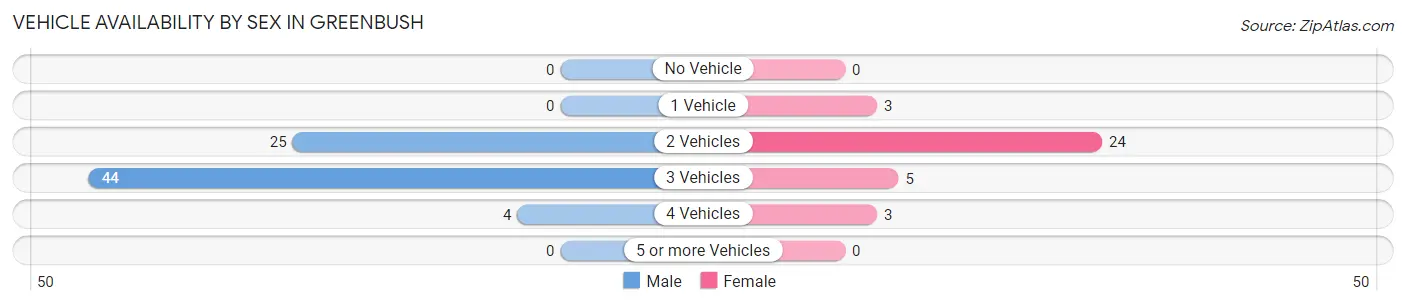
| Vehicles Available | Male | Female |
| No Vehicle | 0 (0.0%) | 0 (0.0%) |
| 1 Vehicle | 0 (0.0%) | 3 (8.6%) |
| 2 Vehicles | 25 (34.3%) | 24 (68.6%) |
| 3 Vehicles | 44 (60.3%) | 5 (14.3%) |
| 4 Vehicles | 4 (5.5%) | 3 (8.6%) |
| 5 or more Vehicles | 0 (0.0%) | 0 (0.0%) |
| Total | 73 (100.0%) | 35 (100.0%) |
Commute Time in Greenbush
The most frequently occuring commute durations in Greenbush are 20 to 24 minutes (23 commuters, 33.3%), 25 to 29 minutes (19 commuters, 27.5%), and 5 to 9 minutes (8 commuters, 11.6%).
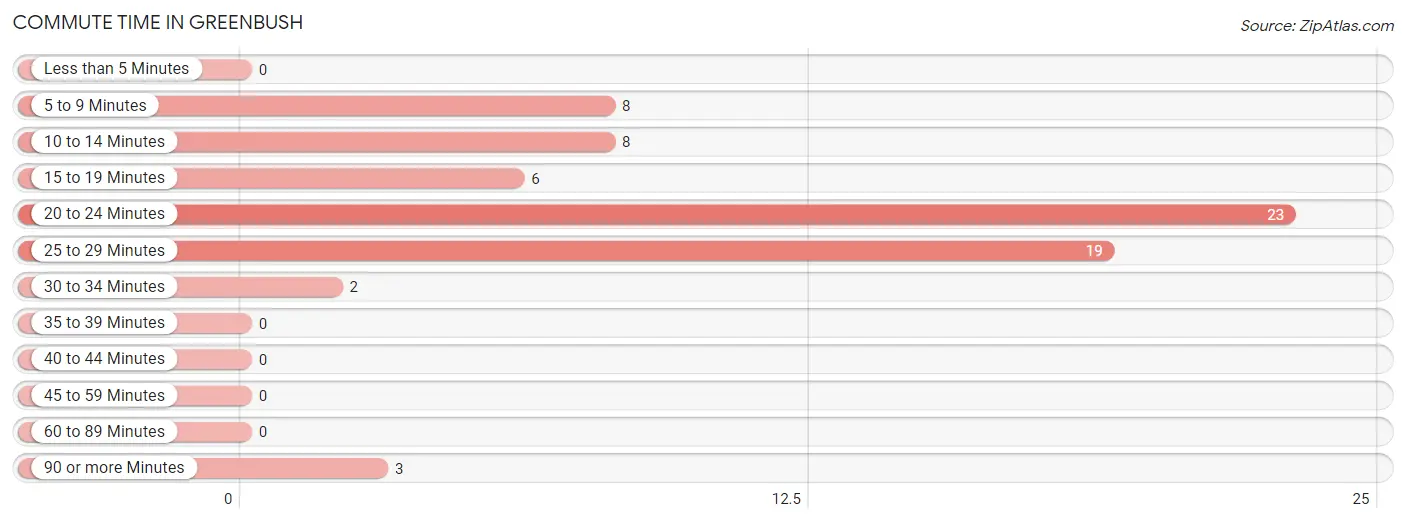
| Commute Time | # Commuters | % Commuters |
| Less than 5 Minutes | 0 | 0.0% |
| 5 to 9 Minutes | 8 | 11.6% |
| 10 to 14 Minutes | 8 | 11.6% |
| 15 to 19 Minutes | 6 | 8.7% |
| 20 to 24 Minutes | 23 | 33.3% |
| 25 to 29 Minutes | 19 | 27.5% |
| 30 to 34 Minutes | 2 | 2.9% |
| 35 to 39 Minutes | 0 | 0.0% |
| 40 to 44 Minutes | 0 | 0.0% |
| 45 to 59 Minutes | 0 | 0.0% |
| 60 to 89 Minutes | 0 | 0.0% |
| 90 or more Minutes | 3 | 4.3% |
Commute Time by Sex in Greenbush
The most common commute times in Greenbush are 20 to 24 minutes (17 commuters, 50.0%) for males and 25 to 29 minutes (16 commuters, 45.7%) for females.
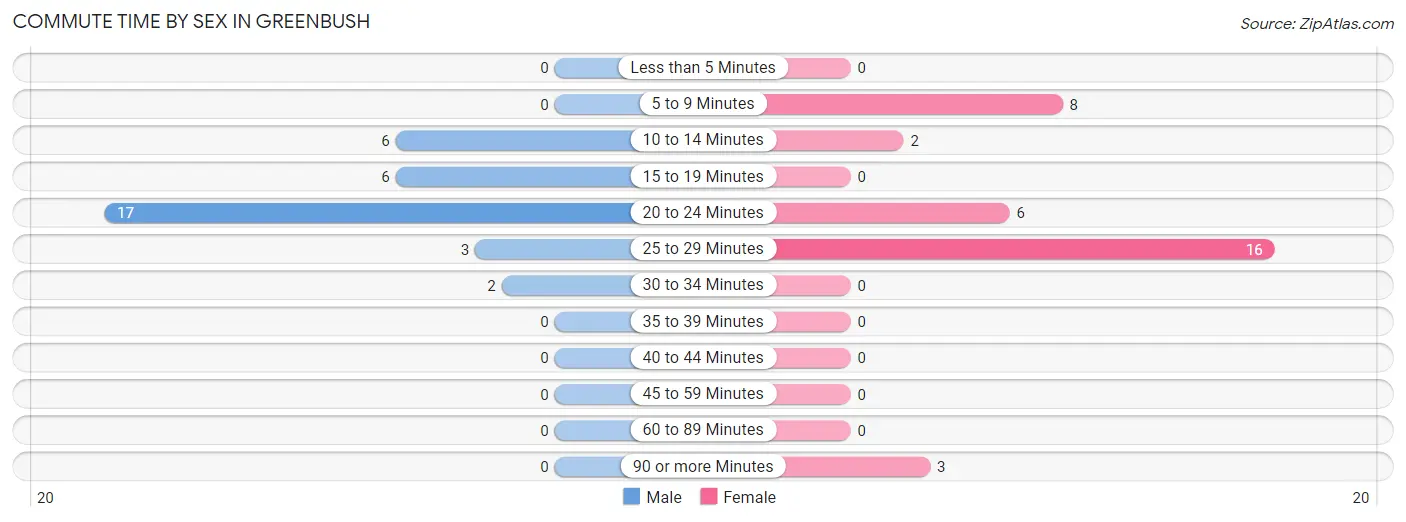
| Commute Time | Male | Female |
| Less than 5 Minutes | 0 (0.0%) | 0 (0.0%) |
| 5 to 9 Minutes | 0 (0.0%) | 8 (22.9%) |
| 10 to 14 Minutes | 6 (17.6%) | 2 (5.7%) |
| 15 to 19 Minutes | 6 (17.6%) | 0 (0.0%) |
| 20 to 24 Minutes | 17 (50.0%) | 6 (17.1%) |
| 25 to 29 Minutes | 3 (8.8%) | 16 (45.7%) |
| 30 to 34 Minutes | 2 (5.9%) | 0 (0.0%) |
| 35 to 39 Minutes | 0 (0.0%) | 0 (0.0%) |
| 40 to 44 Minutes | 0 (0.0%) | 0 (0.0%) |
| 45 to 59 Minutes | 0 (0.0%) | 0 (0.0%) |
| 60 to 89 Minutes | 0 (0.0%) | 0 (0.0%) |
| 90 or more Minutes | 0 (0.0%) | 3 (8.6%) |
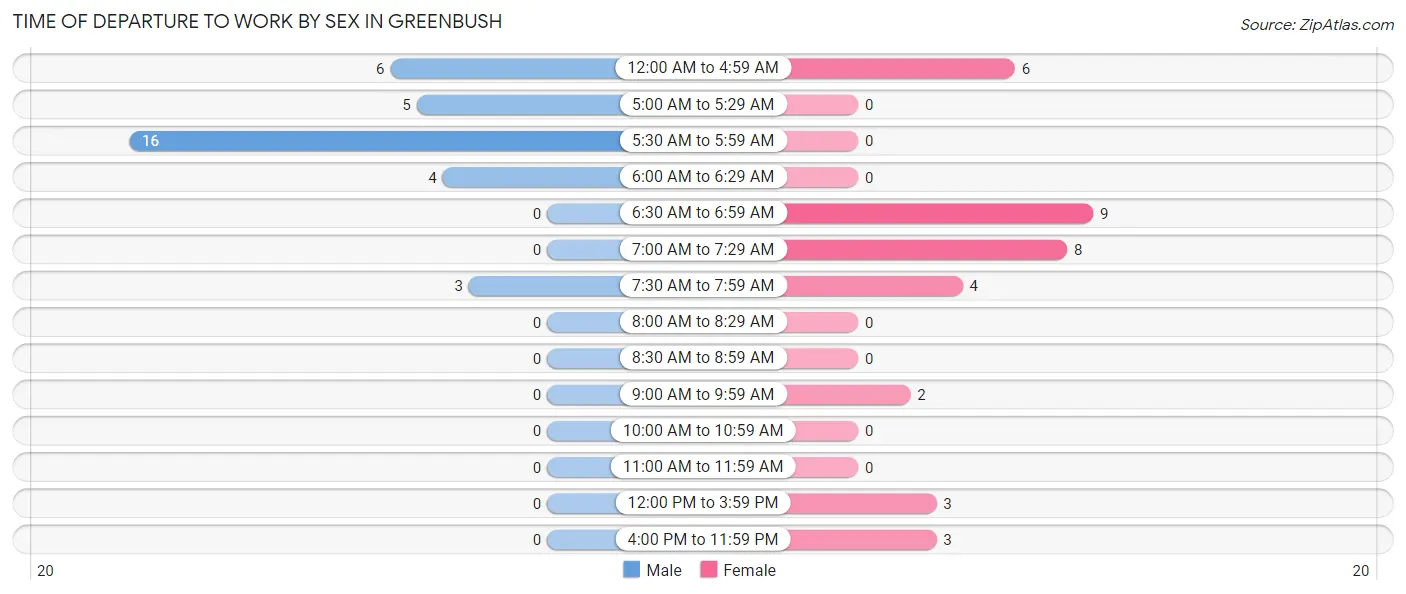
Time of Departure to Work by Sex in Greenbush
The most frequent times of departure to work in Greenbush are 5:30 AM to 5:59 AM (16, 47.1%) for males and 6:30 AM to 6:59 AM (9, 25.7%) for females.
| Time of Departure | Male | Female |
| 12:00 AM to 4:59 AM | 6 (17.6%) | 6 (17.1%) |
| 5:00 AM to 5:29 AM | 5 (14.7%) | 0 (0.0%) |
| 5:30 AM to 5:59 AM | 16 (47.1%) | 0 (0.0%) |
| 6:00 AM to 6:29 AM | 4 (11.8%) | 0 (0.0%) |
| 6:30 AM to 6:59 AM | 0 (0.0%) | 9 (25.7%) |
| 7:00 AM to 7:29 AM | 0 (0.0%) | 8 (22.9%) |
| 7:30 AM to 7:59 AM | 3 (8.8%) | 4 (11.4%) |
| 8:00 AM to 8:29 AM | 0 (0.0%) | 0 (0.0%) |
| 8:30 AM to 8:59 AM | 0 (0.0%) | 0 (0.0%) |
| 9:00 AM to 9:59 AM | 0 (0.0%) | 2 (5.7%) |
| 10:00 AM to 10:59 AM | 0 (0.0%) | 0 (0.0%) |
| 11:00 AM to 11:59 AM | 0 (0.0%) | 0 (0.0%) |
| 12:00 PM to 3:59 PM | 0 (0.0%) | 3 (8.6%) |
| 4:00 PM to 11:59 PM | 0 (0.0%) | 3 (8.6%) |
| Total | 34 (100.0%) | 35 (100.0%) |
Housing Occupancy in Greenbush
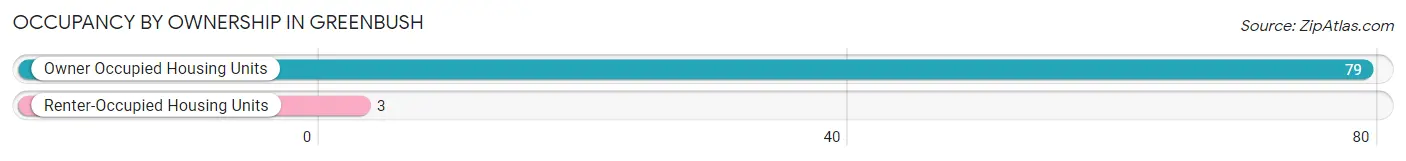
Occupancy by Ownership in Greenbush
Of the total 82 dwellings in Greenbush, owner-occupied units account for 79 (96.3%), while renter-occupied units make up 3 (3.7%).
| Occupancy | # Housing Units | % Housing Units |
| Owner Occupied Housing Units | 79 | 96.3% |
| Renter-Occupied Housing Units | 3 | 3.7% |
| Total Occupied Housing Units | 82 | 100.0% |
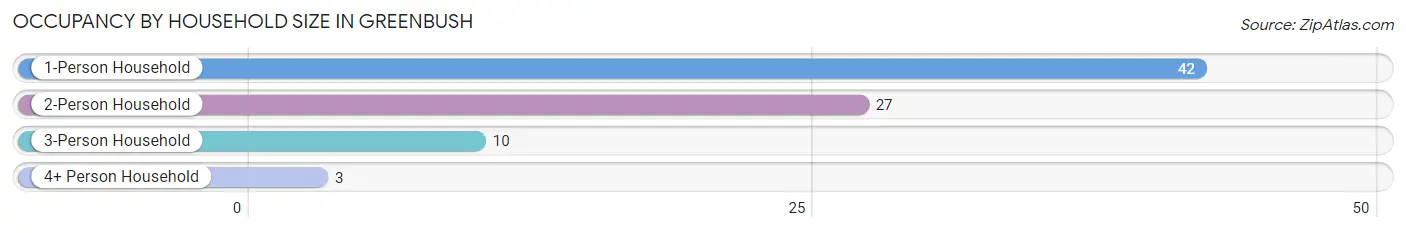
Occupancy by Household Size in Greenbush
| Household Size | # Housing Units | % Housing Units |
| 1-Person Household | 42 | 51.2% |
| 2-Person Household | 27 | 32.9% |
| 3-Person Household | 10 | 12.2% |
| 4+ Person Household | 3 | 3.7% |
| Total Housing Units | 82 | 100.0% |
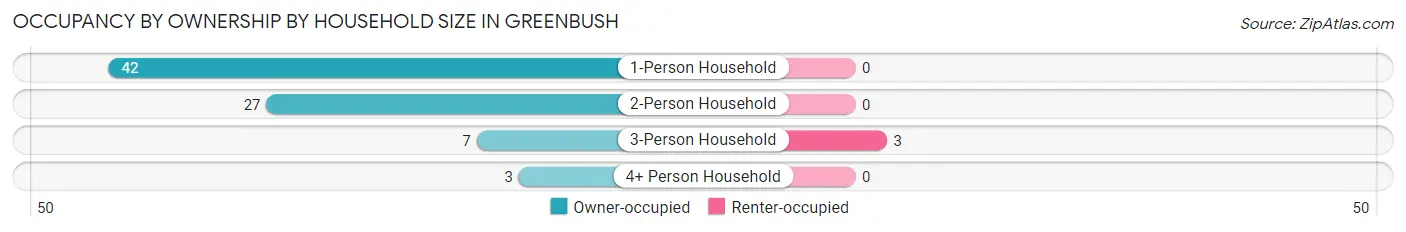
Occupancy by Ownership by Household Size in Greenbush
| Household Size | Owner-occupied | Renter-occupied |
| 1-Person Household | 42 (100.0%) | 0 (0.0%) |
| 2-Person Household | 27 (100.0%) | 0 (0.0%) |
| 3-Person Household | 7 (70.0%) | 3 (30.0%) |
| 4+ Person Household | 3 (100.0%) | 0 (0.0%) |
| Total Housing Units | 79 (96.3%) | 3 (3.7%) |
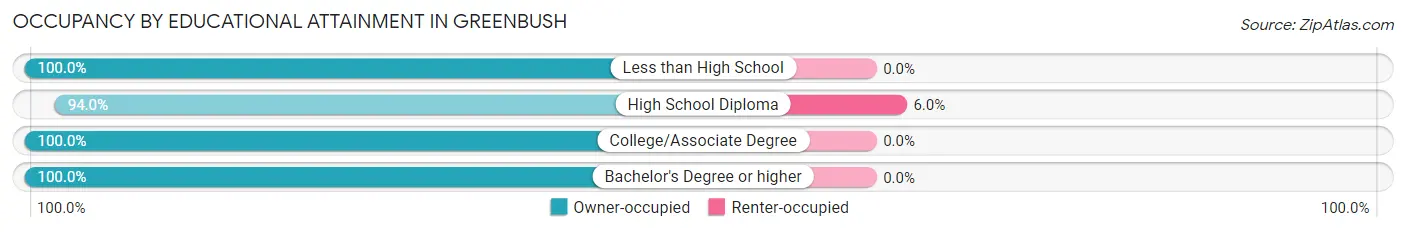
Occupancy by Educational Attainment in Greenbush
| Household Size | Owner-occupied | Renter-occupied |
| Less than High School | 3 (100.0%) | 0 (0.0%) |
| High School Diploma | 47 (94.0%) | 3 (6.0%) |
| College/Associate Degree | 23 (100.0%) | 0 (0.0%) |
| Bachelor's Degree or higher | 6 (100.0%) | 0 (0.0%) |
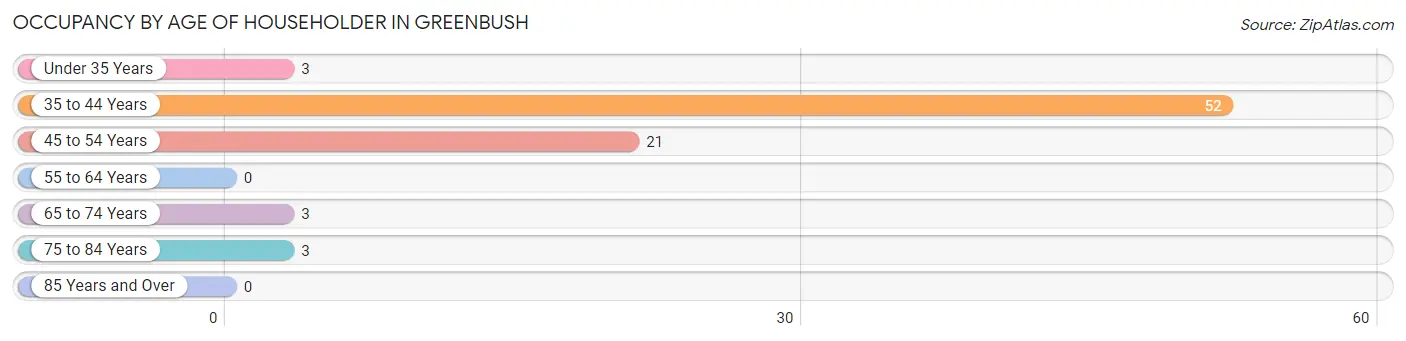
Occupancy by Age of Householder in Greenbush
| Age Bracket | # Households | % Households |
| Under 35 Years | 3 | 3.7% |
| 35 to 44 Years | 52 | 63.4% |
| 45 to 54 Years | 21 | 25.6% |
| 55 to 64 Years | 0 | 0.0% |
| 65 to 74 Years | 3 | 3.7% |
| 75 to 84 Years | 3 | 3.7% |
| 85 Years and Over | 0 | 0.0% |
| Total | 82 | 100.0% |
Housing Finances in Greenbush
Median Income by Occupancy in Greenbush
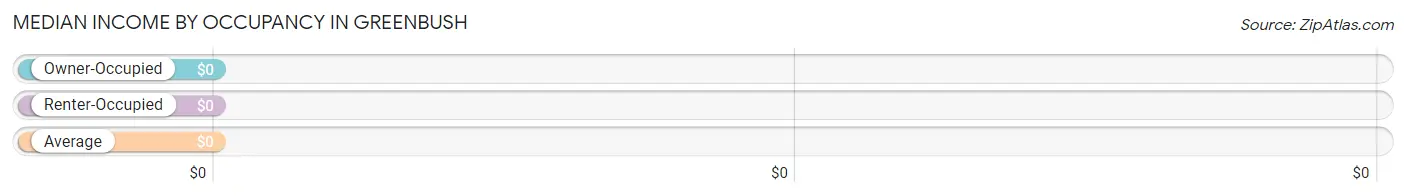
| Occupancy Type | # Households | Median Income |
| Owner-Occupied | 79 (96.3%) | $0 |
| Renter-Occupied | 3 (3.7%) | $0 |
| Average | 82 (100.0%) | $0 |
Occupancy by Householder Income Bracket in Greenbush
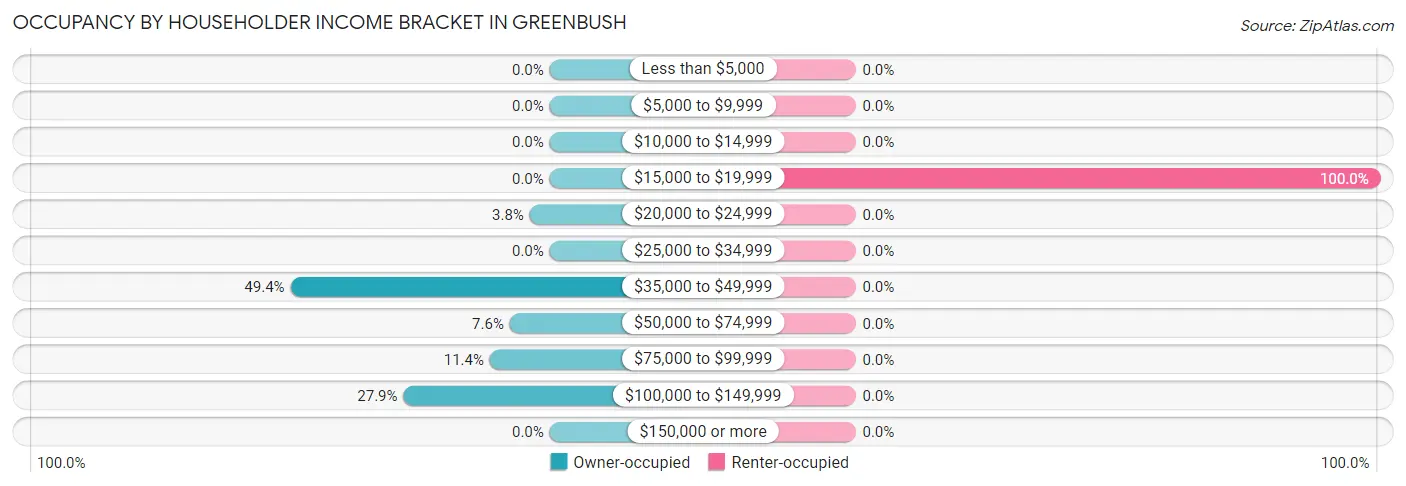
| Income Bracket | Owner-occupied | Renter-occupied |
| Less than $5,000 | 0 (0.0%) | 0 (0.0%) |
| $5,000 to $9,999 | 0 (0.0%) | 0 (0.0%) |
| $10,000 to $14,999 | 0 (0.0%) | 0 (0.0%) |
| $15,000 to $19,999 | 0 (0.0%) | 3 (100.0%) |
| $20,000 to $24,999 | 3 (3.8%) | 0 (0.0%) |
| $25,000 to $34,999 | 0 (0.0%) | 0 (0.0%) |
| $35,000 to $49,999 | 39 (49.4%) | 0 (0.0%) |
| $50,000 to $74,999 | 6 (7.6%) | 0 (0.0%) |
| $75,000 to $99,999 | 9 (11.4%) | 0 (0.0%) |
| $100,000 to $149,999 | 22 (27.9%) | 0 (0.0%) |
| $150,000 or more | 0 (0.0%) | 0 (0.0%) |
| Total | 79 (100.0%) | 3 (100.0%) |
Monthly Housing Cost Tiers in Greenbush
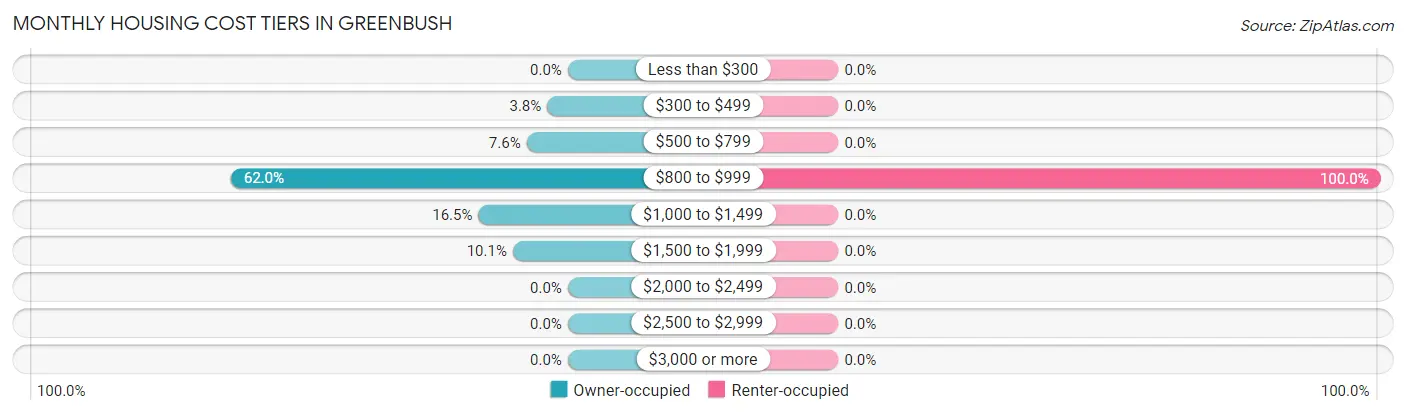
| Monthly Cost | Owner-occupied | Renter-occupied |
| Less than $300 | 0 (0.0%) | 0 (0.0%) |
| $300 to $499 | 3 (3.8%) | 0 (0.0%) |
| $500 to $799 | 6 (7.6%) | 0 (0.0%) |
| $800 to $999 | 49 (62.0%) | 3 (100.0%) |
| $1,000 to $1,499 | 13 (16.5%) | 0 (0.0%) |
| $1,500 to $1,999 | 8 (10.1%) | 0 (0.0%) |
| $2,000 to $2,499 | 0 (0.0%) | 0 (0.0%) |
| $2,500 to $2,999 | 0 (0.0%) | 0 (0.0%) |
| $3,000 or more | 0 (0.0%) | 0 (0.0%) |
| Total | 79 (100.0%) | 3 (100.0%) |
Physical Housing Characteristics in Greenbush
Housing Structures in Greenbush
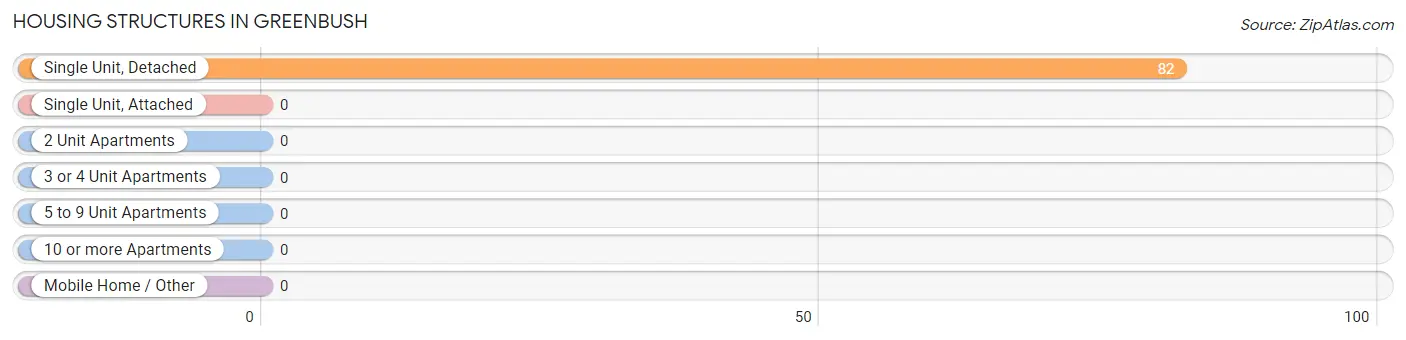
| Structure Type | # Housing Units | % Housing Units |
| Single Unit, Detached | 82 | 100.0% |
| Single Unit, Attached | 0 | 0.0% |
| 2 Unit Apartments | 0 | 0.0% |
| 3 or 4 Unit Apartments | 0 | 0.0% |
| 5 to 9 Unit Apartments | 0 | 0.0% |
| 10 or more Apartments | 0 | 0.0% |
| Mobile Home / Other | 0 | 0.0% |
| Total | 82 | 100.0% |
Housing Structures by Occupancy in Greenbush
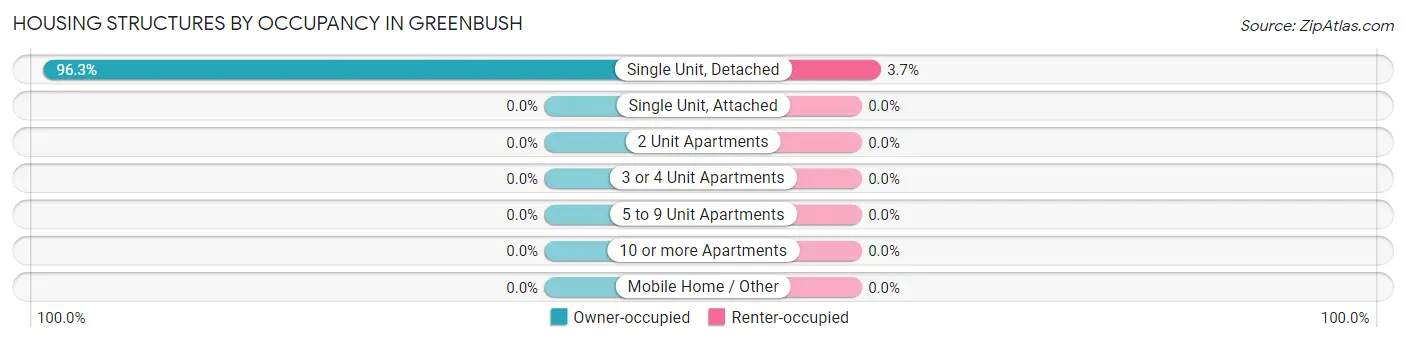
| Structure Type | Owner-occupied | Renter-occupied |
| Single Unit, Detached | 79 (96.3%) | 3 (3.7%) |
| Single Unit, Attached | 0 (0.0%) | 0 (0.0%) |
| 2 Unit Apartments | 0 (0.0%) | 0 (0.0%) |
| 3 or 4 Unit Apartments | 0 (0.0%) | 0 (0.0%) |
| 5 to 9 Unit Apartments | 0 (0.0%) | 0 (0.0%) |
| 10 or more Apartments | 0 (0.0%) | 0 (0.0%) |
| Mobile Home / Other | 0 (0.0%) | 0 (0.0%) |
| Total | 79 (96.3%) | 3 (3.7%) |
Housing Structures by Number of Rooms in Greenbush
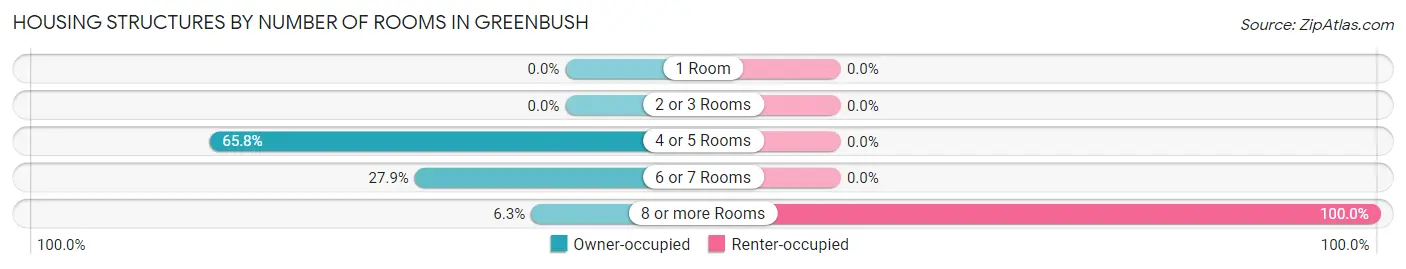
| Number of Rooms | Owner-occupied | Renter-occupied |
| 1 Room | 0 (0.0%) | 0 (0.0%) |
| 2 or 3 Rooms | 0 (0.0%) | 0 (0.0%) |
| 4 or 5 Rooms | 52 (65.8%) | 0 (0.0%) |
| 6 or 7 Rooms | 22 (27.9%) | 0 (0.0%) |
| 8 or more Rooms | 5 (6.3%) | 3 (100.0%) |
| Total | 79 (100.0%) | 3 (100.0%) |
Housing Structure by Heating Type in Greenbush
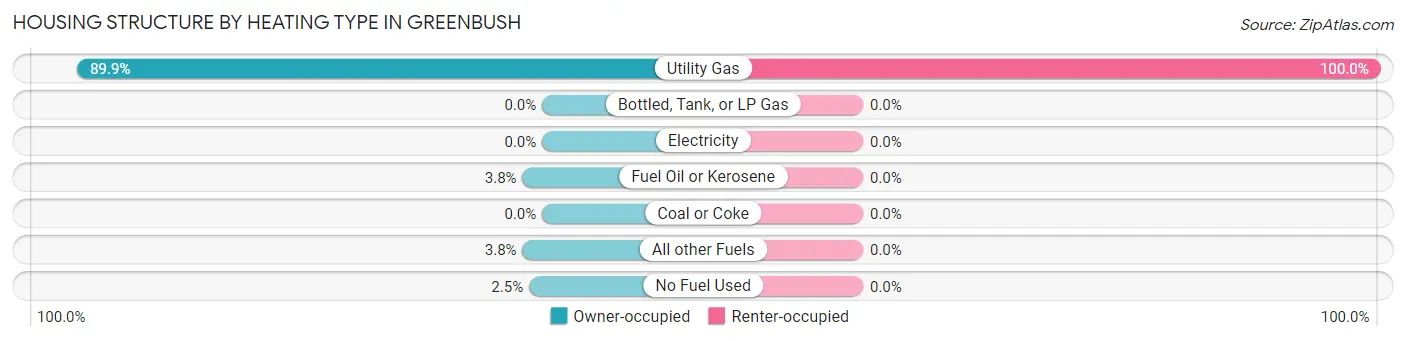
| Heating Type | Owner-occupied | Renter-occupied |
| Utility Gas | 71 (89.9%) | 3 (100.0%) |
| Bottled, Tank, or LP Gas | 0 (0.0%) | 0 (0.0%) |
| Electricity | 0 (0.0%) | 0 (0.0%) |
| Fuel Oil or Kerosene | 3 (3.8%) | 0 (0.0%) |
| Coal or Coke | 0 (0.0%) | 0 (0.0%) |
| All other Fuels | 3 (3.8%) | 0 (0.0%) |
| No Fuel Used | 2 (2.5%) | 0 (0.0%) |
| Total | 79 (100.0%) | 3 (100.0%) |
Household Vehicle Usage in Greenbush
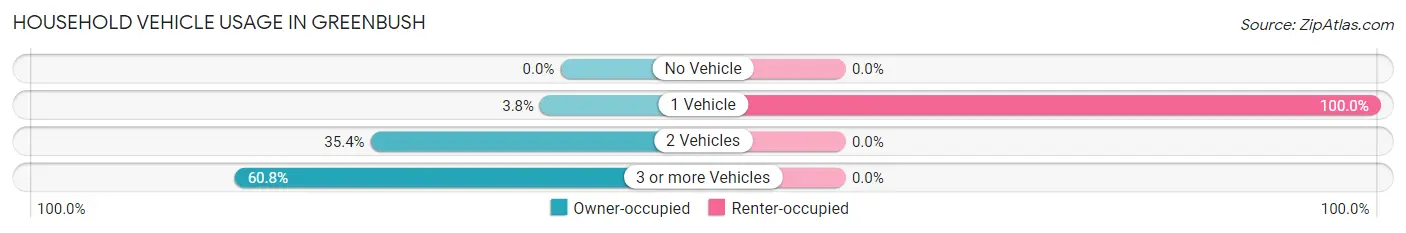
| Vehicles per Household | Owner-occupied | Renter-occupied |
| No Vehicle | 0 (0.0%) | 0 (0.0%) |
| 1 Vehicle | 3 (3.8%) | 3 (100.0%) |
| 2 Vehicles | 28 (35.4%) | 0 (0.0%) |
| 3 or more Vehicles | 48 (60.8%) | 0 (0.0%) |
| Total | 79 (100.0%) | 3 (100.0%) |
Real Estate & Mortgages in Greenbush
Real Estate and Mortgage Overview in Greenbush
| Characteristic | Without Mortgage | With Mortgage |
| Housing Units | 9 | 70 |
| Median Property Value | $187,500 | $139,900 |
| Median Household Income | - | - |
| Monthly Housing Costs | $525 | $0 |
| Real Estate Taxes | $2,750 | $0 |
Property Value by Mortgage Status in Greenbush
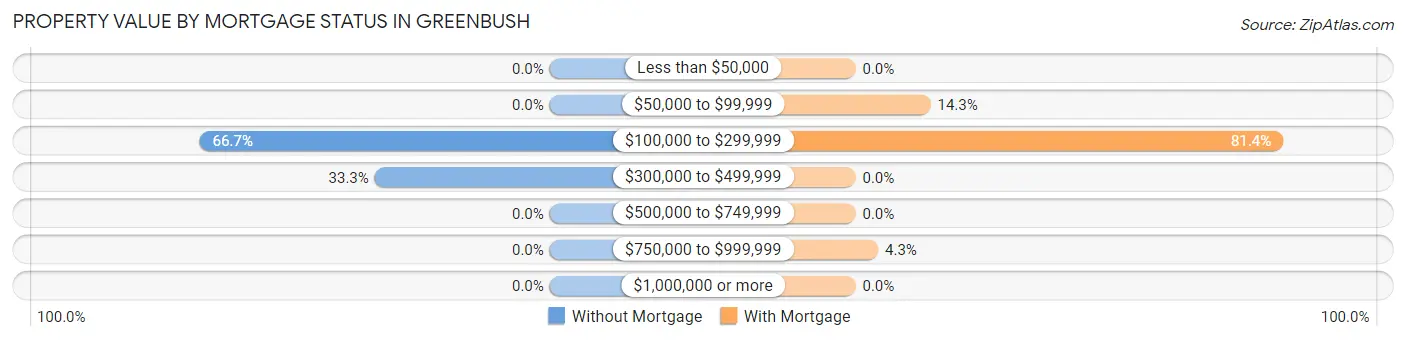
| Property Value | Without Mortgage | With Mortgage |
| Less than $50,000 | 0 (0.0%) | 0 (0.0%) |
| $50,000 to $99,999 | 0 (0.0%) | 10 (14.3%) |
| $100,000 to $299,999 | 6 (66.7%) | 57 (81.4%) |
| $300,000 to $499,999 | 3 (33.3%) | 0 (0.0%) |
| $500,000 to $749,999 | 0 (0.0%) | 0 (0.0%) |
| $750,000 to $999,999 | 0 (0.0%) | 3 (4.3%) |
| $1,000,000 or more | 0 (0.0%) | 0 (0.0%) |
| Total | 9 (100.0%) | 70 (100.0%) |
Household Income by Mortgage Status in Greenbush
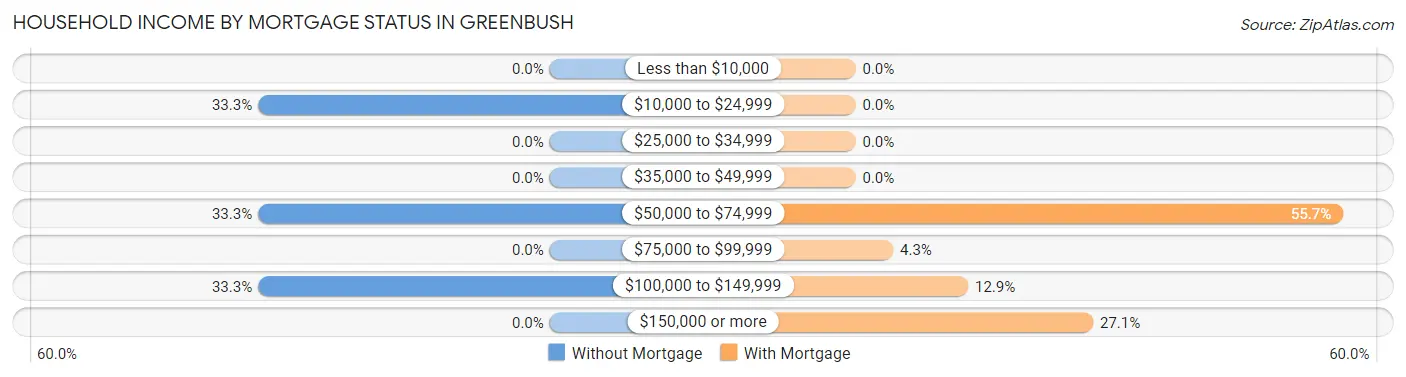
| Household Income | Without Mortgage | With Mortgage |
| Less than $10,000 | 0 (0.0%) | 0 (0.0%) |
| $10,000 to $24,999 | 3 (33.3%) | 0 (0.0%) |
| $25,000 to $34,999 | 0 (0.0%) | 0 (0.0%) |
| $35,000 to $49,999 | 0 (0.0%) | 0 (0.0%) |
| $50,000 to $74,999 | 3 (33.3%) | 39 (55.7%) |
| $75,000 to $99,999 | 0 (0.0%) | 3 (4.3%) |
| $100,000 to $149,999 | 3 (33.3%) | 9 (12.9%) |
| $150,000 or more | 0 (0.0%) | 19 (27.1%) |
| Total | 9 (100.0%) | 70 (100.0%) |
Property Value to Household Income Ratio in Greenbush
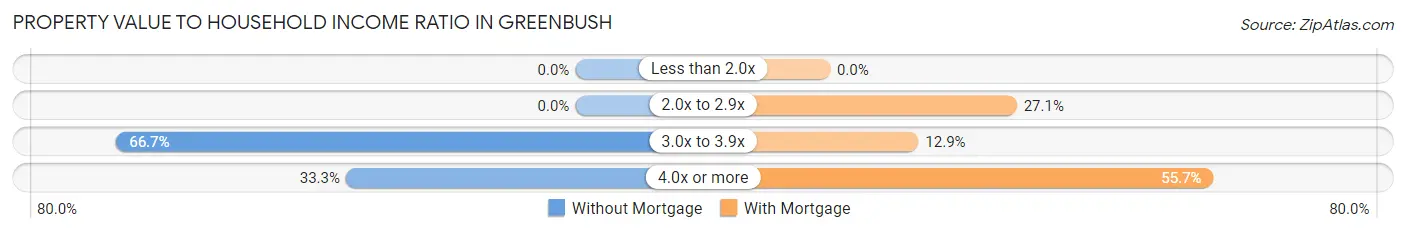
| Value-to-Income Ratio | Without Mortgage | With Mortgage |
| Less than 2.0x | 0 (0.0%) | 0 (0.0%) |
| 2.0x to 2.9x | 0 (0.0%) | 19 (27.1%) |
| 3.0x to 3.9x | 6 (66.7%) | 9 (12.9%) |
| 4.0x or more | 3 (33.3%) | 39 (55.7%) |
| Total | 9 (100.0%) | 70 (100.0%) |
Real Estate Taxes by Mortgage Status in Greenbush
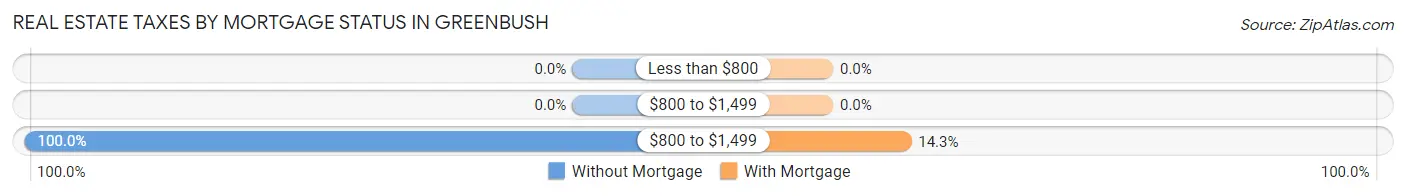
| Property Taxes | Without Mortgage | With Mortgage |
| Less than $800 | 0 (0.0%) | 0 (0.0%) |
| $800 to $1,499 | 0 (0.0%) | 0 (0.0%) |
| $800 to $1,499 | 9 (100.0%) | 10 (14.3%) |
| Total | 9 (100.0%) | 70 (100.0%) |
Health & Disability in Greenbush
Health Insurance Coverage by Age in Greenbush
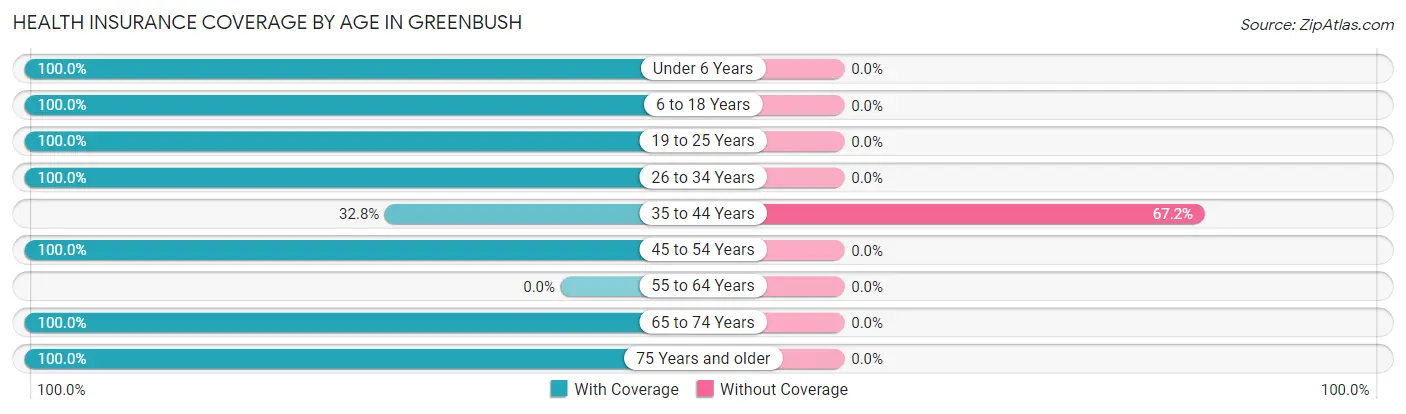
| Age Bracket | With Coverage | Without Coverage |
| Under 6 Years | 5 (100.0%) | 0 (0.0%) |
| 6 to 18 Years | 10 (100.0%) | 0 (0.0%) |
| 19 to 25 Years | 5 (100.0%) | 0 (0.0%) |
| 26 to 34 Years | 18 (100.0%) | 0 (0.0%) |
| 35 to 44 Years | 19 (32.8%) | 39 (67.2%) |
| 45 to 54 Years | 32 (100.0%) | 0 (0.0%) |
| 55 to 64 Years | 0 (0.0%) | 0 (0.0%) |
| 65 to 74 Years | 3 (100.0%) | 0 (0.0%) |
| 75 Years and older | 6 (100.0%) | 0 (0.0%) |
| Total | 98 (71.5%) | 39 (28.5%) |
Health Insurance Coverage by Citizenship Status in Greenbush
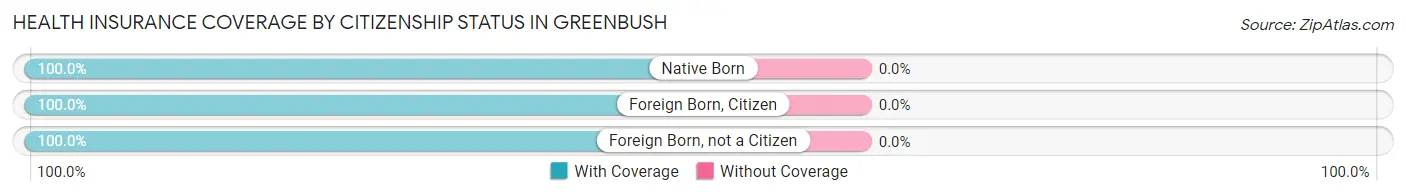
| Citizenship Status | With Coverage | Without Coverage |
| Native Born | 5 (100.0%) | 0 (0.0%) |
| Foreign Born, Citizen | 10 (100.0%) | 0 (0.0%) |
| Foreign Born, not a Citizen | 5 (100.0%) | 0 (0.0%) |
Health Insurance Coverage by Household Income in Greenbush
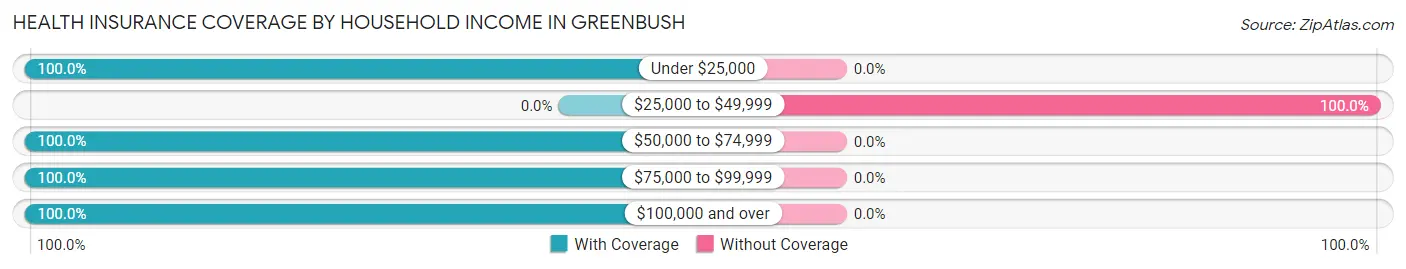
| Household Income | With Coverage | Without Coverage |
| Under $25,000 | 12 (100.0%) | 0 (0.0%) |
| $25,000 to $49,999 | 0 (0.0%) | 39 (100.0%) |
| $50,000 to $74,999 | 16 (100.0%) | 0 (0.0%) |
| $75,000 to $99,999 | 24 (100.0%) | 0 (0.0%) |
| $100,000 and over | 46 (100.0%) | 0 (0.0%) |
Public vs Private Health Insurance Coverage by Age in Greenbush
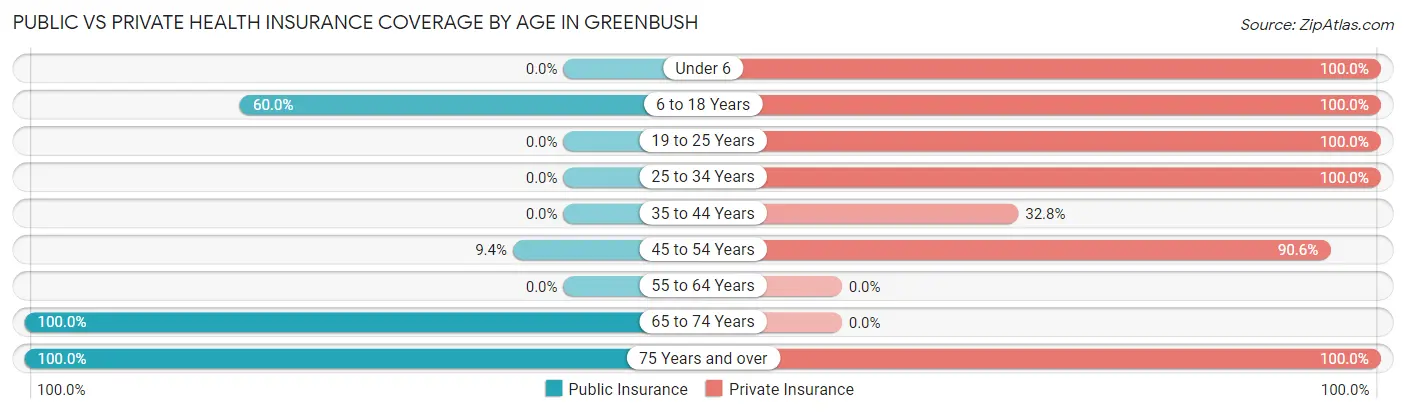
| Age Bracket | Public Insurance | Private Insurance |
| Under 6 | 0 (0.0%) | 5 (100.0%) |
| 6 to 18 Years | 6 (60.0%) | 10 (100.0%) |
| 19 to 25 Years | 0 (0.0%) | 5 (100.0%) |
| 25 to 34 Years | 0 (0.0%) | 18 (100.0%) |
| 35 to 44 Years | 0 (0.0%) | 19 (32.8%) |
| 45 to 54 Years | 3 (9.4%) | 29 (90.6%) |
| 55 to 64 Years | 0 (0.0%) | 0 (0.0%) |
| 65 to 74 Years | 3 (100.0%) | 0 (0.0%) |
| 75 Years and over | 6 (100.0%) | 6 (100.0%) |
| Total | 18 (13.1%) | 92 (67.1%) |
Disability Status by Sex by Age in Greenbush
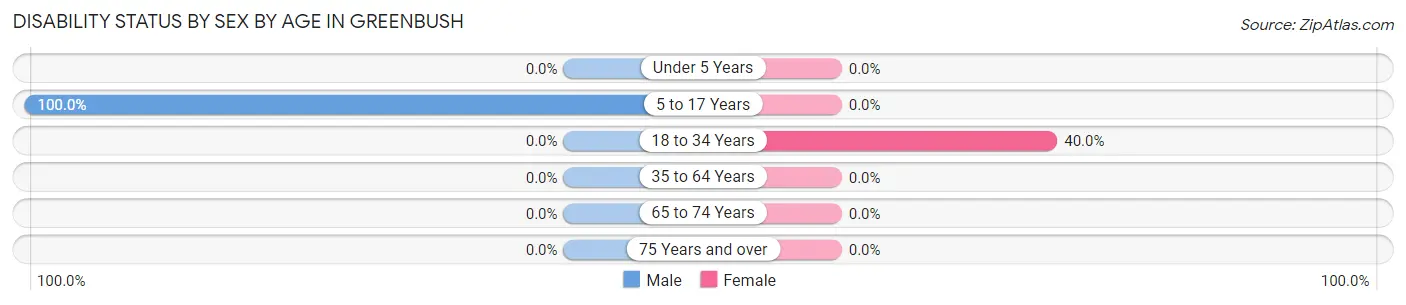
| Age Bracket | Male | Female |
| Under 5 Years | 0 (0.0%) | 0 (0.0%) |
| 5 to 17 Years | 3 (100.0%) | 0 (0.0%) |
| 18 to 34 Years | 0 (0.0%) | 8 (40.0%) |
| 35 to 64 Years | 0 (0.0%) | 0 (0.0%) |
| 65 to 74 Years | 0 (0.0%) | 0 (0.0%) |
| 75 Years and over | 0 (0.0%) | 0 (0.0%) |
Disability Class by Sex by Age in Greenbush
Disability Class: Hearing Difficulty
| Age Bracket | Male | Female |
| Under 5 Years | 0 (0.0%) | 0 (0.0%) |
| 5 to 17 Years | 0 (0.0%) | 0 (0.0%) |
| 18 to 34 Years | 0 (0.0%) | 0 (0.0%) |
| 35 to 64 Years | 0 (0.0%) | 0 (0.0%) |
| 65 to 74 Years | 0 (0.0%) | 0 (0.0%) |
| 75 Years and over | 0 (0.0%) | 0 (0.0%) |
Disability Class: Vision Difficulty
| Age Bracket | Male | Female |
| Under 5 Years | 0 (0.0%) | 0 (0.0%) |
| 5 to 17 Years | 0 (0.0%) | 0 (0.0%) |
| 18 to 34 Years | 0 (0.0%) | 0 (0.0%) |
| 35 to 64 Years | 0 (0.0%) | 0 (0.0%) |
| 65 to 74 Years | 0 (0.0%) | 0 (0.0%) |
| 75 Years and over | 0 (0.0%) | 0 (0.0%) |
Disability Class: Cognitive Difficulty
| Age Bracket | Male | Female |
| 5 to 17 Years | 0 (0.0%) | 0 (0.0%) |
| 18 to 34 Years | 0 (0.0%) | 3 (15.0%) |
| 35 to 64 Years | 0 (0.0%) | 0 (0.0%) |
| 65 to 74 Years | 0 (0.0%) | 0 (0.0%) |
| 75 Years and over | 0 (0.0%) | 0 (0.0%) |
Disability Class: Ambulatory Difficulty
| Age Bracket | Male | Female |
| 5 to 17 Years | 0 (0.0%) | 0 (0.0%) |
| 18 to 34 Years | 0 (0.0%) | 0 (0.0%) |
| 35 to 64 Years | 0 (0.0%) | 0 (0.0%) |
| 65 to 74 Years | 0 (0.0%) | 0 (0.0%) |
| 75 Years and over | 0 (0.0%) | 0 (0.0%) |
Disability Class: Self-Care Difficulty
| Age Bracket | Male | Female |
| 5 to 17 Years | 0 (0.0%) | 0 (0.0%) |
| 18 to 34 Years | 0 (0.0%) | 0 (0.0%) |
| 35 to 64 Years | 0 (0.0%) | 0 (0.0%) |
| 65 to 74 Years | 0 (0.0%) | 0 (0.0%) |
| 75 Years and over | 0 (0.0%) | 0 (0.0%) |
Technology Access in Greenbush
Computing Device Access in Greenbush
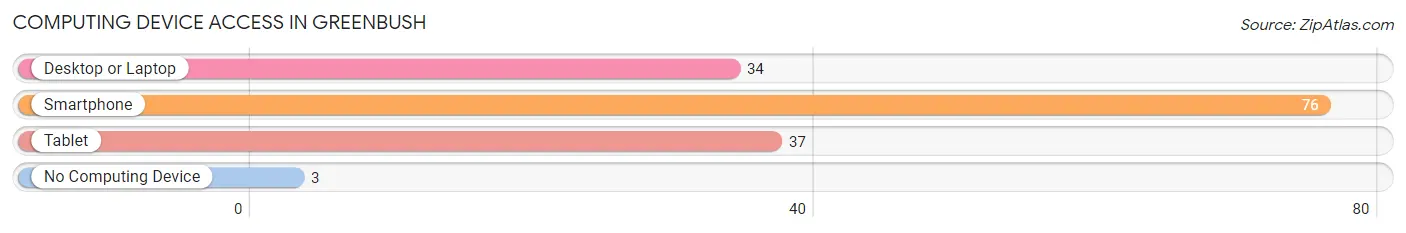
| Device Type | # Households | % Households |
| Desktop or Laptop | 34 | 41.5% |
| Smartphone | 76 | 92.7% |
| Tablet | 37 | 45.1% |
| No Computing Device | 3 | 3.7% |
| Total | 82 | 100.0% |
Internet Access in Greenbush
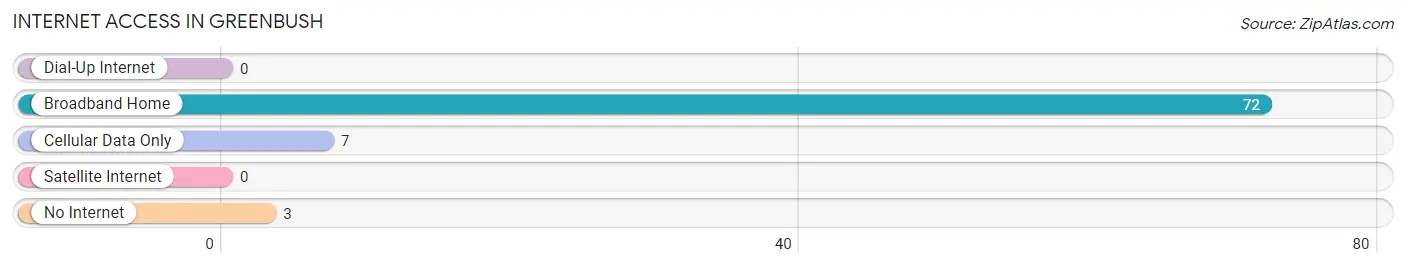
| Internet Type | # Households | % Households |
| Dial-Up Internet | 0 | 0.0% |
| Broadband Home | 72 | 87.8% |
| Cellular Data Only | 7 | 8.5% |
| Satellite Internet | 0 | 0.0% |
| No Internet | 3 | 3.7% |
| Total | 82 | 100.0% |
Greenbush Summary
History
The area now known as Greenbush, Wisconsin was first inhabited by the Potawatomi Native American tribe. The Potawatomi were a peaceful tribe that lived in the area for centuries before the arrival of European settlers. The first Europeans to settle in the area were French fur traders in the late 1700s. The area was then part of the Northwest Territory and was part of the Michigan Territory until 1836 when it became part of the Wisconsin Territory.
The first permanent settlers in the area were German immigrants who arrived in the 1840s. They established farms and businesses and the area began to grow. In 1848, the town of Greenbush was officially established and named after the nearby Greenbush Creek. The town was incorporated in 1856 and the first post office was established in 1857.
The town grew slowly but steadily over the next few decades. In the late 1800s, the railroad came to the area and the town began to grow more rapidly. The railroad brought new businesses and industries to the area and the population began to increase. By the early 1900s, the town had a population of over 1,000 people.
Geography
Greenbush is located in Sheboygan County, Wisconsin. It is situated on the western shore of Lake Michigan, about 25 miles north of Milwaukee. The town is bordered by the towns of Sheboygan Falls to the north, Cedar Grove to the east, and Oostburg to the south. The town covers an area of about 4.5 square miles and has a population of about 1,500 people.
The town is situated on a flat plain with rolling hills in the surrounding area. The terrain is mostly flat with some small hills and valleys. The town is located in a temperate climate with warm summers and cold winters. The average annual temperature is about 45 degrees Fahrenheit.
Economy
Greenbush’s economy is largely based on agriculture and manufacturing. The town is home to several large farms that produce a variety of crops, including corn, soybeans, and wheat. The town also has several small businesses, including restaurants, retail stores, and service providers.
The town is also home to several manufacturing companies, including a paper mill, a plastics factory, and a metal fabrication plant. These companies provide jobs for many of the town’s residents.
Demographics
As of the 2010 census, the population of Greenbush was 1,521 people. The racial makeup of the town was 97.3% White, 0.7% African American, 0.3% Native American, 0.3% Asian, 0.2% from other races, and 1.3% from two or more races. Hispanic or Latino of any race were 1.3% of the population.
The median household income in Greenbush was $50,938 and the median family income was $60,938. About 8.3% of families and 10.2% of the population were below the poverty line, including 14.3% of those under age 18 and 5.2% of those age 65 or over.
The town is served by the Sheboygan Area School District. The town has one elementary school, one middle school, and one high school. The town also has several private schools, including a Catholic school and a Lutheran school.
Common Questions
What is Per Capita Income in Greenbush?
Per Capita income in Greenbush is $42,088.
What is the Median Family Income in Greenbush?
Median Family Income in Greenbush is $99,167.
What is Income or Wage Gap in Greenbush?
Income or Wage Gap in Greenbush is 26.4%.
Women in Greenbush earn 73.6 cents for every dollar earned by a man.
What is Inequality or Gini Index in Greenbush?
Inequality or Gini Index in Greenbush is 0.28.
What is the Total Population of Greenbush?
Total Population of Greenbush is 137.
What is the Total Male Population of Greenbush?
Total Male Population of Greenbush is 87.
What is the Total Female Population of Greenbush?
Total Female Population of Greenbush is 50.
What is the Ratio of Males per 100 Females in Greenbush?
There are 174.00 Males per 100 Females in Greenbush.
What is the Ratio of Females per 100 Males in Greenbush?
There are 57.47 Females per 100 Males in Greenbush.
What is the Median Population Age in Greenbush?
Median Population Age in Greenbush is 40.6 Years.
What is the Average Family Size in Greenbush
Average Family Size in Greenbush is 2.4 People.
What is the Average Household Size in Greenbush
Average Household Size in Greenbush is 1.7 People.
How Large is the Labor Force in Greenbush?
There are 110 People in the Labor Forcein in Greenbush.
What is the Percentage of People in the Labor Force in Greenbush?
85.9% of People are in the Labor Force in Greenbush.
What is the Unemployment Rate in Greenbush?
Unemployment Rate in Greenbush is 1.8%.