Lime Ridge, WI Map & Demographics
Lime Ridge Map
Lime Ridge Overview
$34,540
PER CAPITA INCOME
$104,750
AVG FAMILY INCOME
$93,750
AVG HOUSEHOLD INCOME
42.0%
WAGE / INCOME GAP [ % ]
58.0¢/ $1
WAGE / INCOME GAP [ $ ]
0.31
INEQUALITY / GINI INDEX
186
TOTAL POPULATION
96
MALE POPULATION
90
FEMALE POPULATION
106.67
MALES / 100 FEMALES
93.75
FEMALES / 100 MALES
42.8
MEDIAN AGE
3.3
AVG FAMILY SIZE
2.9
AVG HOUSEHOLD SIZE
102
LABOR FORCE [ PEOPLE ]
68.0%
PERCENT IN LABOR FORCE
Lime Ridge Zip Codes
Lime Ridge Area Codes
Income in Lime Ridge
Income Overview in Lime Ridge
Per Capita Income in Lime Ridge is $34,540, while median incomes of families and households are $104,750 and $93,750 respectively.
| Characteristic | Number | Measure |
| Per Capita Income | 186 | $34,540 |
| Median Family Income | 51 | $104,750 |
| Mean Family Income | 51 | $101,992 |
| Median Household Income | 65 | $93,750 |
| Mean Household Income | 65 | $85,857 |
| Income Deficit | 51 | $0 |
| Wage / Income Gap (%) | 186 | 42.02% |
| Wage / Income Gap ($) | 186 | 57.98¢ per $1 |
| Gini / Inequality Index | 186 | 0.31 |
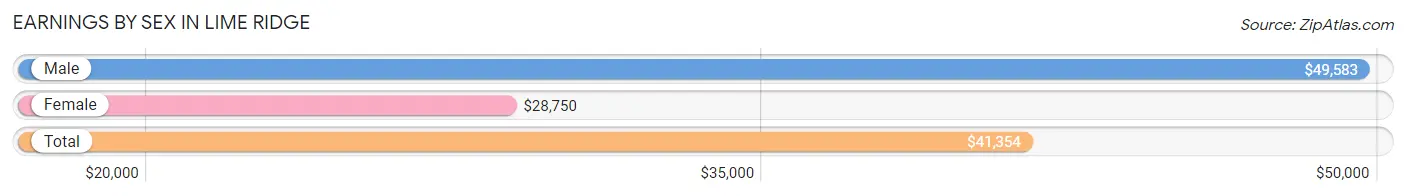
Earnings by Sex in Lime Ridge
Average Earnings in Lime Ridge are $41,354, $49,583 for men and $28,750 for women, a difference of 42.0%.
| Sex | Number | Average Earnings |
| Male | 62 (57.9%) | $49,583 |
| Female | 45 (42.1%) | $28,750 |
| Total | 107 (100.0%) | $41,354 |
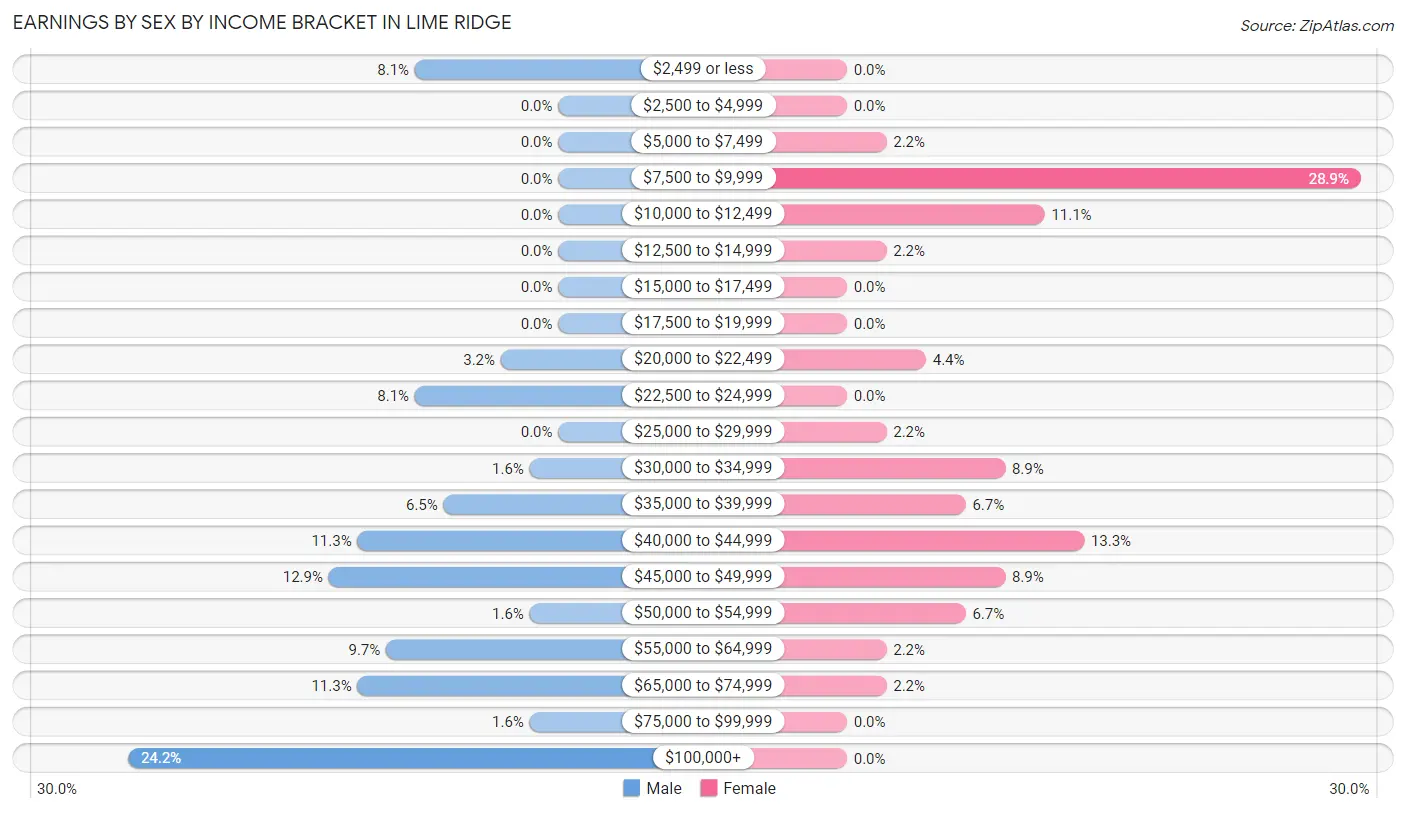
Earnings by Sex by Income Bracket in Lime Ridge
The most common earnings brackets in Lime Ridge are $100,000+ for men (15 | 24.2%) and $7,500 to $9,999 for women (13 | 28.9%).
| Income | Male | Female |
| $2,499 or less | 5 (8.1%) | 0 (0.0%) |
| $2,500 to $4,999 | 0 (0.0%) | 0 (0.0%) |
| $5,000 to $7,499 | 0 (0.0%) | 1 (2.2%) |
| $7,500 to $9,999 | 0 (0.0%) | 13 (28.9%) |
| $10,000 to $12,499 | 0 (0.0%) | 5 (11.1%) |
| $12,500 to $14,999 | 0 (0.0%) | 1 (2.2%) |
| $15,000 to $17,499 | 0 (0.0%) | 0 (0.0%) |
| $17,500 to $19,999 | 0 (0.0%) | 0 (0.0%) |
| $20,000 to $22,499 | 2 (3.2%) | 2 (4.4%) |
| $22,500 to $24,999 | 5 (8.1%) | 0 (0.0%) |
| $25,000 to $29,999 | 0 (0.0%) | 1 (2.2%) |
| $30,000 to $34,999 | 1 (1.6%) | 4 (8.9%) |
| $35,000 to $39,999 | 4 (6.5%) | 3 (6.7%) |
| $40,000 to $44,999 | 7 (11.3%) | 6 (13.3%) |
| $45,000 to $49,999 | 8 (12.9%) | 4 (8.9%) |
| $50,000 to $54,999 | 1 (1.6%) | 3 (6.7%) |
| $55,000 to $64,999 | 6 (9.7%) | 1 (2.2%) |
| $65,000 to $74,999 | 7 (11.3%) | 1 (2.2%) |
| $75,000 to $99,999 | 1 (1.6%) | 0 (0.0%) |
| $100,000+ | 15 (24.2%) | 0 (0.0%) |
| Total | 62 (100.0%) | 45 (100.0%) |
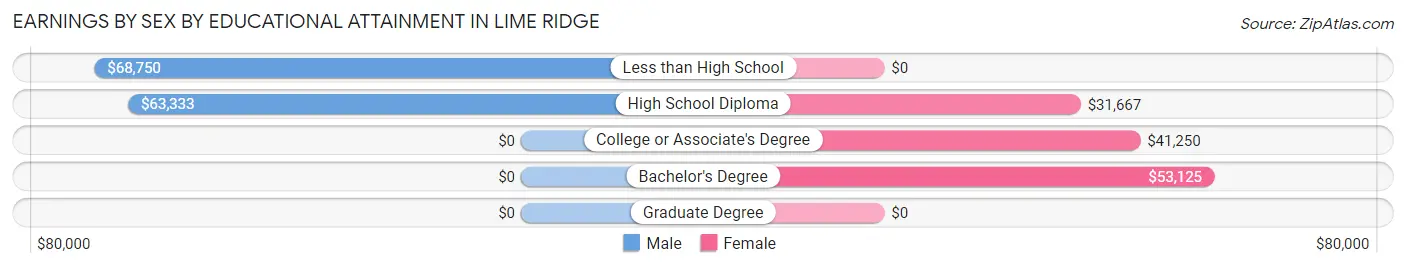
Earnings by Sex by Educational Attainment in Lime Ridge
Average earnings in Lime Ridge are $56,250 for men and $39,167 for women, a difference of 30.4%. Men with an educational attainment of less than high school enjoy the highest average annual earnings of $68,750, while those with high school diploma education earn the least with $63,333. Women with an educational attainment of bachelor's degree earn the most with the average annual earnings of $53,125, while those with high school diploma education have the smallest earnings of $31,667.
| Educational Attainment | Male Income | Female Income |
| Less than High School | $68,750 | $0 |
| High School Diploma | $63,333 | $31,667 |
| College or Associate's Degree | - | - |
| Bachelor's Degree | - | - |
| Graduate Degree | - | - |
| Total | $56,250 | $39,167 |
Family Income in Lime Ridge
Family Income Brackets in Lime Ridge
According to the Lime Ridge family income data, there are 30 families falling into the $100,000 to $149,999 income range, which is the most common income bracket and makes up 58.8% of all families.
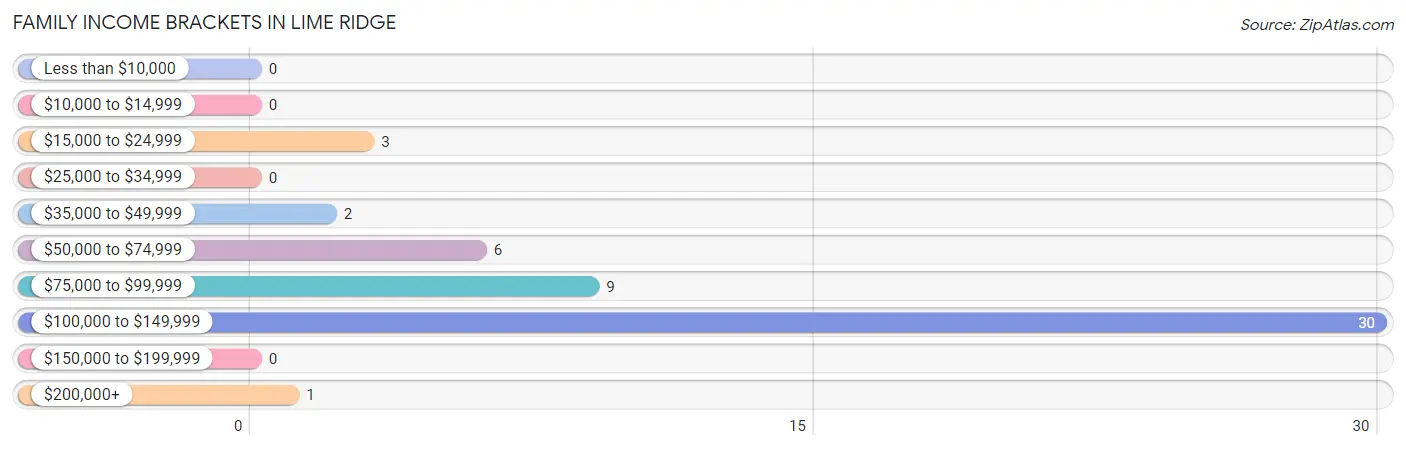
| Income Bracket | # Families | % Families |
| Less than $10,000 | 0 | 0.0% |
| $10,000 to $14,999 | 0 | 0.0% |
| $15,000 to $24,999 | 3 | 5.9% |
| $25,000 to $34,999 | 0 | 0.0% |
| $35,000 to $49,999 | 2 | 3.9% |
| $50,000 to $74,999 | 6 | 11.8% |
| $75,000 to $99,999 | 9 | 17.6% |
| $100,000 to $149,999 | 30 | 58.8% |
| $150,000 to $199,999 | 0 | 0.0% |
| $200,000+ | 1 | 2.0% |
Family Income by Famaliy Size in Lime Ridge
4-person families (18 | 35.3%) account for the highest median family income in Lime Ridge with $113,000 per family, while 2-person families (22 | 43.1%) have the highest median income of $51,875 per family member.
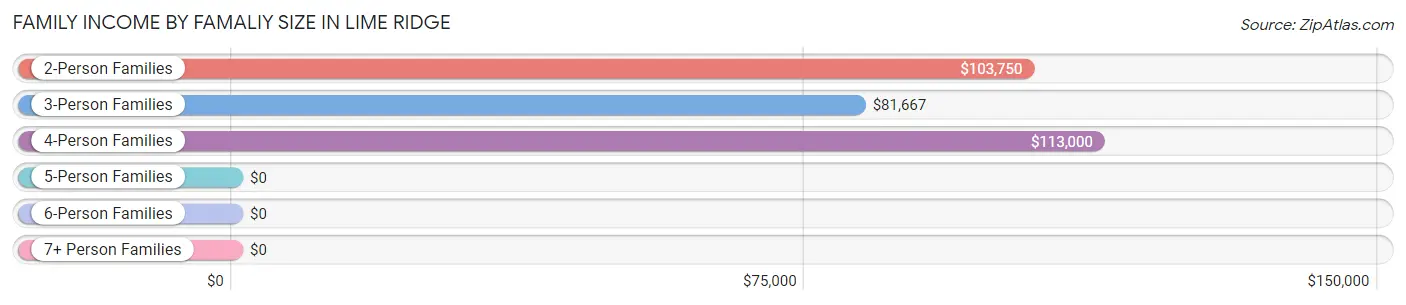
| Income Bracket | # Families | Median Income |
| 2-Person Families | 22 (43.1%) | $103,750 |
| 3-Person Families | 6 (11.8%) | $81,667 |
| 4-Person Families | 18 (35.3%) | $113,000 |
| 5-Person Families | 3 (5.9%) | $0 |
| 6-Person Families | 0 (0.0%) | $0 |
| 7+ Person Families | 2 (3.9%) | $0 |
| Total | 51 (100.0%) | $104,750 |
Family Income by Number of Earners in Lime Ridge
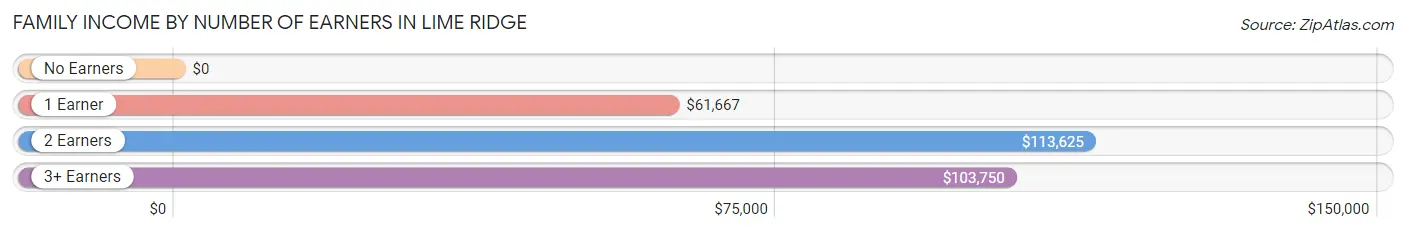
| Number of Earners | # Families | Median Income |
| No Earners | 3 (5.9%) | $0 |
| 1 Earner | 8 (15.7%) | $61,667 |
| 2 Earners | 33 (64.7%) | $113,625 |
| 3+ Earners | 7 (13.7%) | $103,750 |
| Total | 51 (100.0%) | $104,750 |
Household Income in Lime Ridge
Household Income Brackets in Lime Ridge
With 30 households falling in the category, the $100,000 to $149,999 income range is the most frequent in Lime Ridge, accounting for 46.2% of all households.
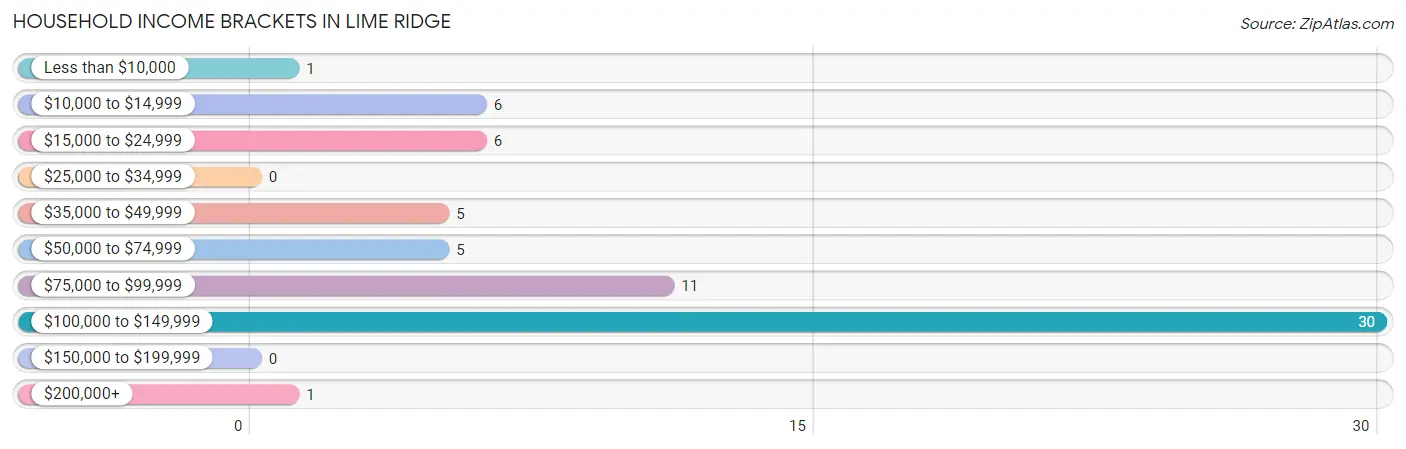
| Income Bracket | # Households | % Households |
| Less than $10,000 | 1 | 1.5% |
| $10,000 to $14,999 | 6 | 9.2% |
| $15,000 to $24,999 | 6 | 9.2% |
| $25,000 to $34,999 | 0 | 0.0% |
| $35,000 to $49,999 | 5 | 7.7% |
| $50,000 to $74,999 | 5 | 7.7% |
| $75,000 to $99,999 | 11 | 16.9% |
| $100,000 to $149,999 | 30 | 46.2% |
| $150,000 to $199,999 | 0 | 0.0% |
| $200,000+ | 1 | 1.5% |
Household Income by Householder Age in Lime Ridge
The median household income in Lime Ridge is $93,750, with the highest median household income of $113,250 found in the 25 to 44 years age bracket for the primary householder. A total of 26 households (40.0%) fall into this category.
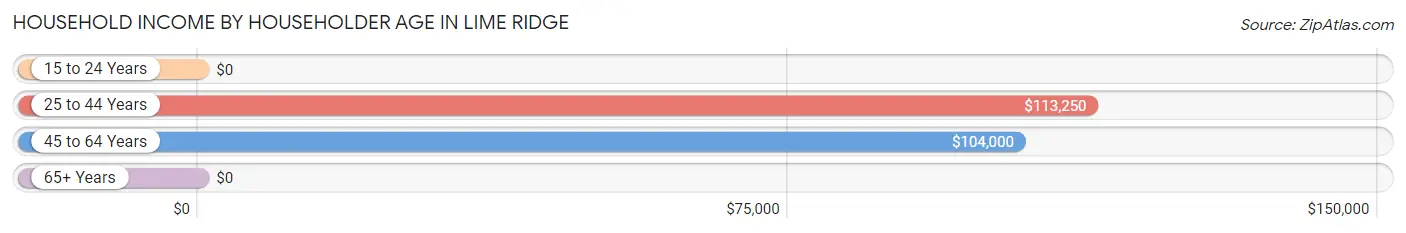
| Income Bracket | # Households | Median Income |
| 15 to 24 Years | 0 (0.0%) | $0 |
| 25 to 44 Years | 26 (40.0%) | $113,250 |
| 45 to 64 Years | 18 (27.7%) | $104,000 |
| 65+ Years | 21 (32.3%) | $0 |
| Total | 65 (100.0%) | $93,750 |
Poverty in Lime Ridge
Income Below Poverty by Sex and Age in Lime Ridge
With 7.3% poverty level for males and 2.2% for females among the residents of Lime Ridge, 65 to 74 year old males and 18 to 24 year old females are the most vulnerable to poverty, with 7 males (87.5%) and 2 females (15.4%) in their respective age groups living below the poverty level.
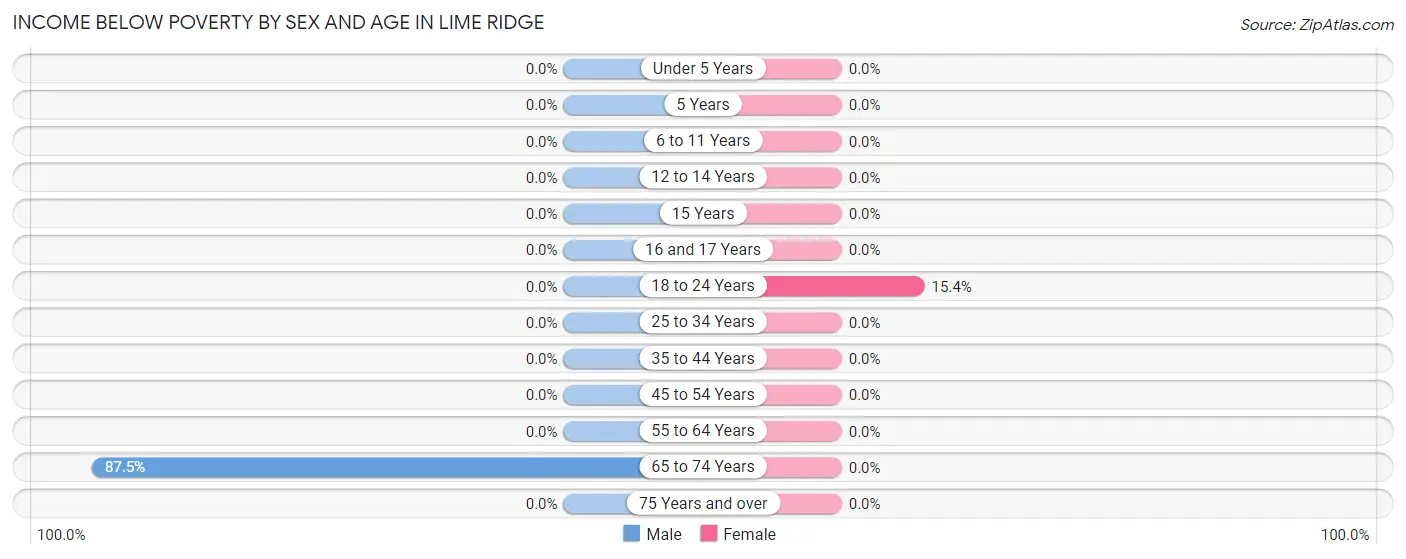
| Age Bracket | Male | Female |
| Under 5 Years | 0 (0.0%) | 0 (0.0%) |
| 5 Years | 0 (0.0%) | 0 (0.0%) |
| 6 to 11 Years | 0 (0.0%) | 0 (0.0%) |
| 12 to 14 Years | 0 (0.0%) | 0 (0.0%) |
| 15 Years | 0 (0.0%) | 0 (0.0%) |
| 16 and 17 Years | 0 (0.0%) | 0 (0.0%) |
| 18 to 24 Years | 0 (0.0%) | 2 (15.4%) |
| 25 to 34 Years | 0 (0.0%) | 0 (0.0%) |
| 35 to 44 Years | 0 (0.0%) | 0 (0.0%) |
| 45 to 54 Years | 0 (0.0%) | 0 (0.0%) |
| 55 to 64 Years | 0 (0.0%) | 0 (0.0%) |
| 65 to 74 Years | 7 (87.5%) | 0 (0.0%) |
| 75 Years and over | 0 (0.0%) | 0 (0.0%) |
| Total | 7 (7.3%) | 2 (2.2%) |
Income Above Poverty by Sex and Age in Lime Ridge
According to the poverty statistics in Lime Ridge, males aged under 5 years and females aged 6 to 11 years are the age groups that are most secure financially, with 100.0% of males and 100.0% of females in these age groups living above the poverty line.
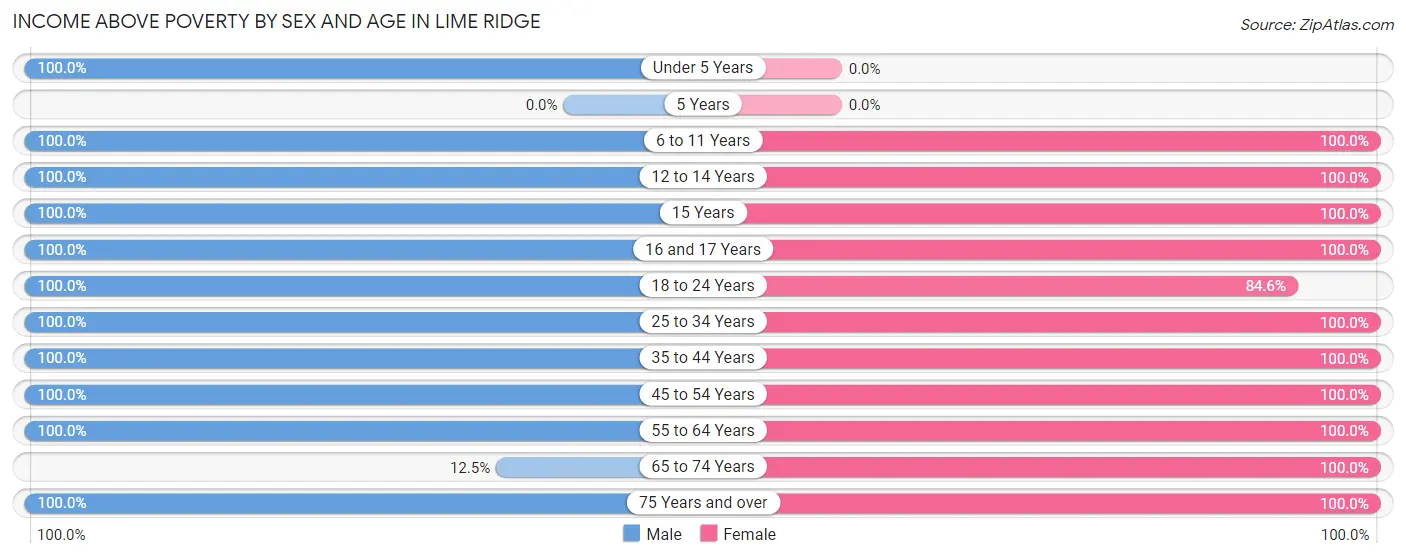
| Age Bracket | Male | Female |
| Under 5 Years | 2 (100.0%) | 0 (0.0%) |
| 5 Years | 0 (0.0%) | 0 (0.0%) |
| 6 to 11 Years | 9 (100.0%) | 1 (100.0%) |
| 12 to 14 Years | 7 (100.0%) | 6 (100.0%) |
| 15 Years | 2 (100.0%) | 9 (100.0%) |
| 16 and 17 Years | 1 (100.0%) | 3 (100.0%) |
| 18 to 24 Years | 6 (100.0%) | 11 (84.6%) |
| 25 to 34 Years | 3 (100.0%) | 3 (100.0%) |
| 35 to 44 Years | 22 (100.0%) | 19 (100.0%) |
| 45 to 54 Years | 19 (100.0%) | 20 (100.0%) |
| 55 to 64 Years | 6 (100.0%) | 3 (100.0%) |
| 65 to 74 Years | 1 (12.5%) | 6 (100.0%) |
| 75 Years and over | 11 (100.0%) | 7 (100.0%) |
| Total | 89 (92.7%) | 88 (97.8%) |
Income Below Poverty Among Married-Couple Families in Lime Ridge
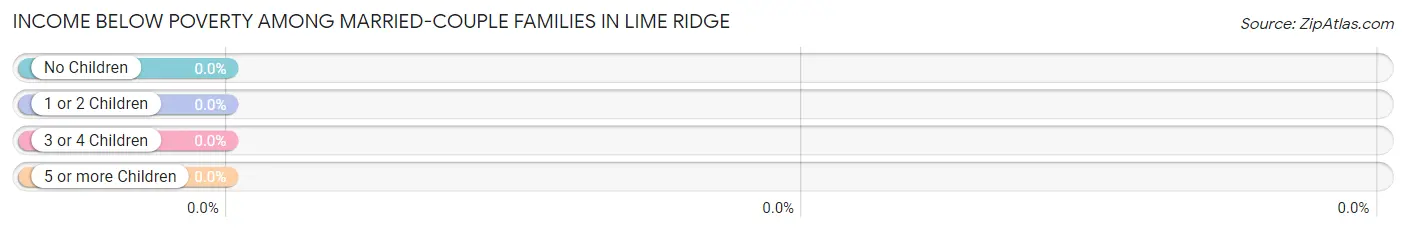
| Children | Above Poverty | Below Poverty |
| No Children | 22 (100.0%) | 0 (0.0%) |
| 1 or 2 Children | 20 (100.0%) | 0 (0.0%) |
| 3 or 4 Children | 3 (100.0%) | 0 (0.0%) |
| 5 or more Children | 2 (100.0%) | 0 (0.0%) |
| Total | 47 (100.0%) | 0 (0.0%) |
Income Below Poverty Among Single-Parent Households in Lime Ridge
| Children | Single Father | Single Mother |
| No Children | 0 (0.0%) | 0 (0.0%) |
| 1 or 2 Children | 0 (0.0%) | 0 (0.0%) |
| 3 or 4 Children | 0 (0.0%) | 0 (0.0%) |
| 5 or more Children | 0 (0.0%) | 0 (0.0%) |
| Total | 0 (0.0%) | 0 (0.0%) |
Income Below Poverty Among Married-Couple vs Single-Parent Households in Lime Ridge
| Children | Married-Couple Families | Single-Parent Households |
| No Children | 0 (0.0%) | 0 (0.0%) |
| 1 or 2 Children | 0 (0.0%) | 0 (0.0%) |
| 3 or 4 Children | 0 (0.0%) | 0 (0.0%) |
| 5 or more Children | 0 (0.0%) | 0 (0.0%) |
| Total | 0 (0.0%) | 0 (0.0%) |
Race in Lime Ridge
The most populous races in Lime Ridge are White / Caucasian (178 | 95.7%), and Two or more Races (8 | 4.3%).
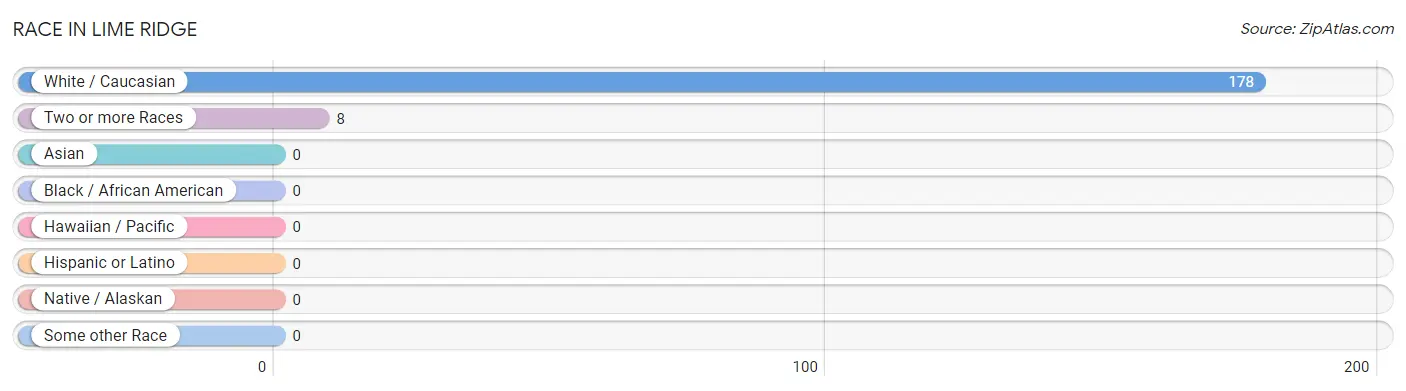
| Race | # Population | % Population |
| Asian | 0 | 0.0% |
| Black / African American | 0 | 0.0% |
| Hawaiian / Pacific | 0 | 0.0% |
| Hispanic or Latino | 0 | 0.0% |
| Native / Alaskan | 0 | 0.0% |
| White / Caucasian | 178 | 95.7% |
| Two or more Races | 8 | 4.3% |
| Some other Race | 0 | 0.0% |
| Total | 186 | 100.0% |
Ancestry in Lime Ridge
The most populous ancestries reported in Lime Ridge are German (70 | 37.6%), Irish (31 | 16.7%), Czech (25 | 13.4%), English (21 | 11.3%), and Norwegian (17 | 9.1%), together accounting for 88.2% of all Lime Ridge residents.
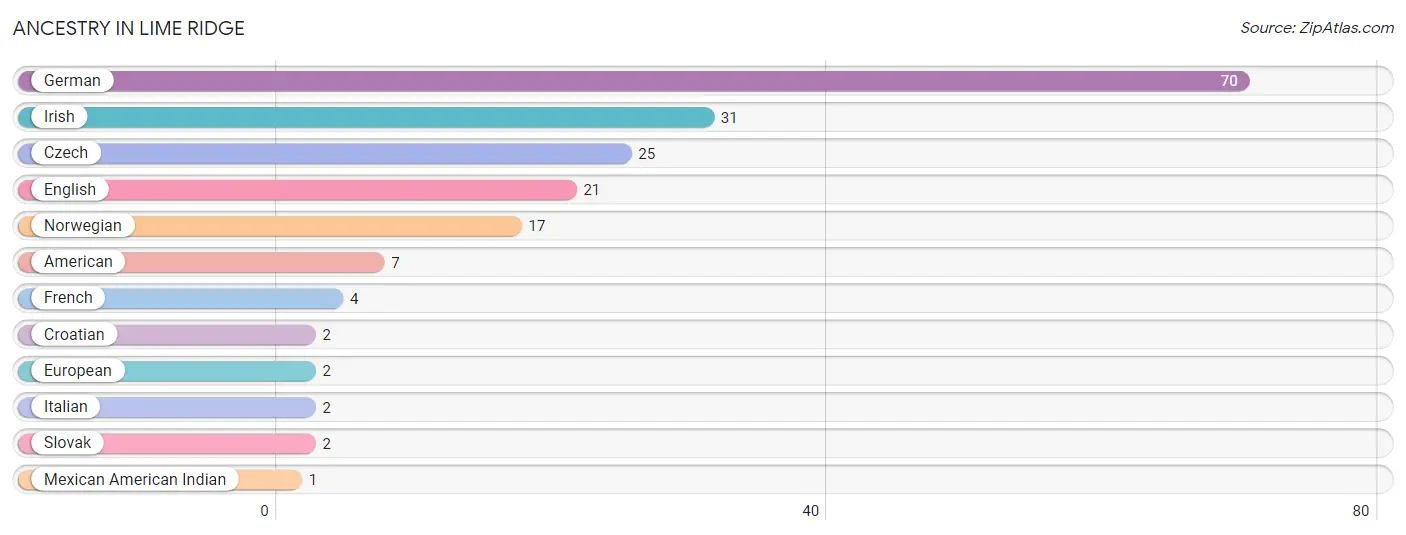
| Ancestry | # Population | % Population |
| American | 7 | 3.8% |
| Croatian | 2 | 1.1% |
| Czech | 25 | 13.4% |
| English | 21 | 11.3% |
| European | 2 | 1.1% |
| French | 4 | 2.1% |
| German | 70 | 37.6% |
| Irish | 31 | 16.7% |
| Italian | 2 | 1.1% |
| Mexican American Indian | 1 | 0.5% |
| Norwegian | 17 | 9.1% |
| Slovak | 2 | 1.1% | View All 12 Rows |
Immigrants in Lime Ridge

| Immigration Origin | # Population | % Population | View All 0 Rows |
Sex and Age in Lime Ridge
Sex and Age in Lime Ridge
The most populous age groups in Lime Ridge are 40 to 44 Years (17 | 17.7%) for men and 15 to 19 Years (23 | 25.6%) for women.
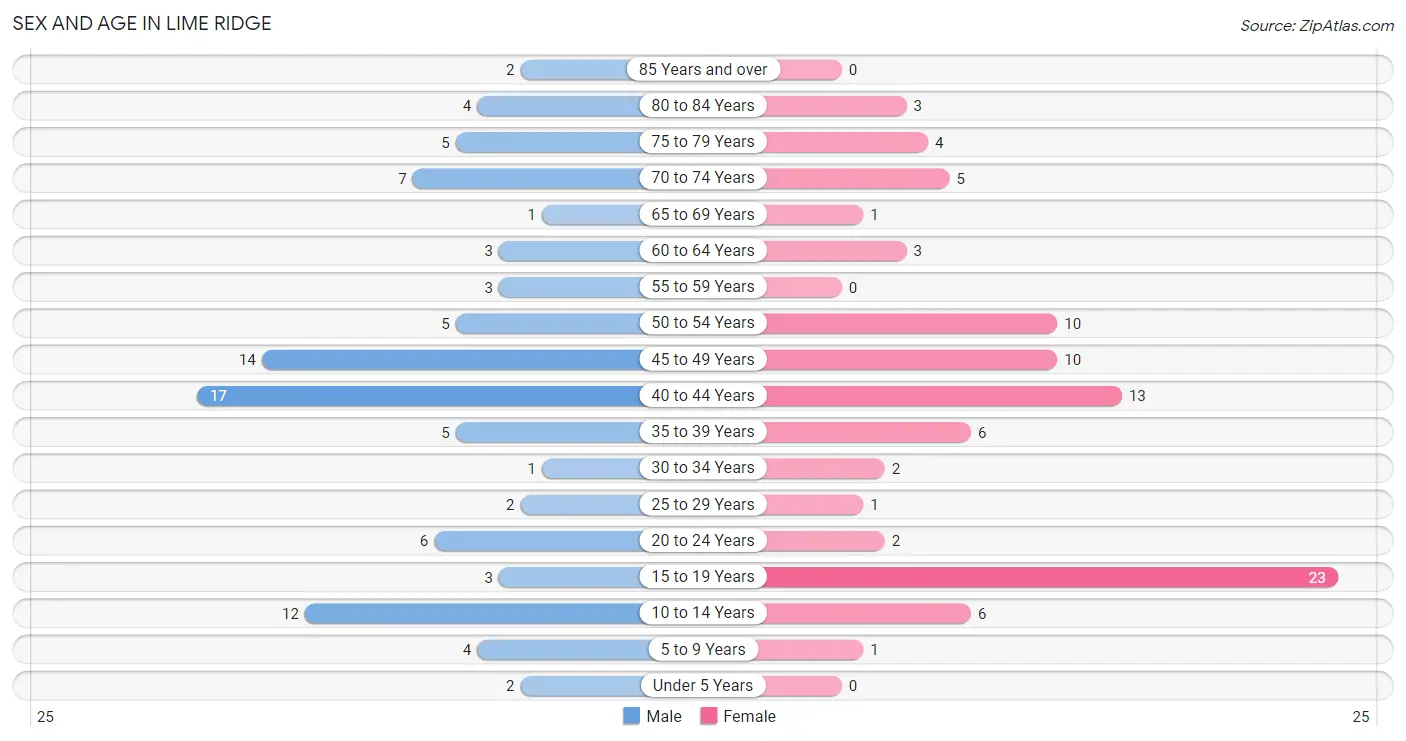
| Age Bracket | Male | Female |
| Under 5 Years | 2 (2.1%) | 0 (0.0%) |
| 5 to 9 Years | 4 (4.2%) | 1 (1.1%) |
| 10 to 14 Years | 12 (12.5%) | 6 (6.7%) |
| 15 to 19 Years | 3 (3.1%) | 23 (25.6%) |
| 20 to 24 Years | 6 (6.2%) | 2 (2.2%) |
| 25 to 29 Years | 2 (2.1%) | 1 (1.1%) |
| 30 to 34 Years | 1 (1.0%) | 2 (2.2%) |
| 35 to 39 Years | 5 (5.2%) | 6 (6.7%) |
| 40 to 44 Years | 17 (17.7%) | 13 (14.4%) |
| 45 to 49 Years | 14 (14.6%) | 10 (11.1%) |
| 50 to 54 Years | 5 (5.2%) | 10 (11.1%) |
| 55 to 59 Years | 3 (3.1%) | 0 (0.0%) |
| 60 to 64 Years | 3 (3.1%) | 3 (3.3%) |
| 65 to 69 Years | 1 (1.0%) | 1 (1.1%) |
| 70 to 74 Years | 7 (7.3%) | 5 (5.6%) |
| 75 to 79 Years | 5 (5.2%) | 4 (4.4%) |
| 80 to 84 Years | 4 (4.2%) | 3 (3.3%) |
| 85 Years and over | 2 (2.1%) | 0 (0.0%) |
| Total | 96 (100.0%) | 90 (100.0%) |
Families and Households in Lime Ridge
Median Family Size in Lime Ridge
The median family size in Lime Ridge is 3.31 persons per family, with single male/father families (1 | 2.0%) accounting for the largest median family size of 6 persons per family. On the other hand, single female/mother families (3 | 5.9%) represent the smallest median family size with 2.67 persons per family.
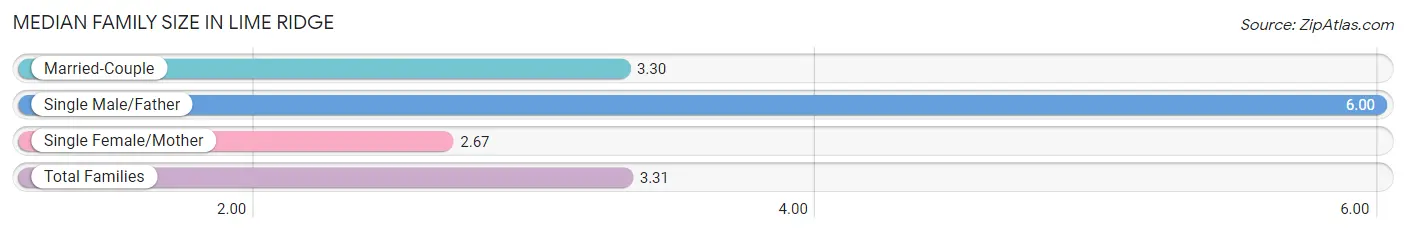
| Family Type | # Families | Family Size |
| Married-Couple | 47 (92.2%) | 3.30 |
| Single Male/Father | 1 (2.0%) | 6.00 |
| Single Female/Mother | 3 (5.9%) | 2.67 |
| Total Families | 51 (100.0%) | 3.31 |
Median Household Size in Lime Ridge
The median household size in Lime Ridge is 2.86 persons per household, with single male/father households (1 | 1.5%) accounting for the largest median household size of 8 persons per household. non-family households (14 | 21.5%) represent the smallest median household size with 1.07 persons per household.
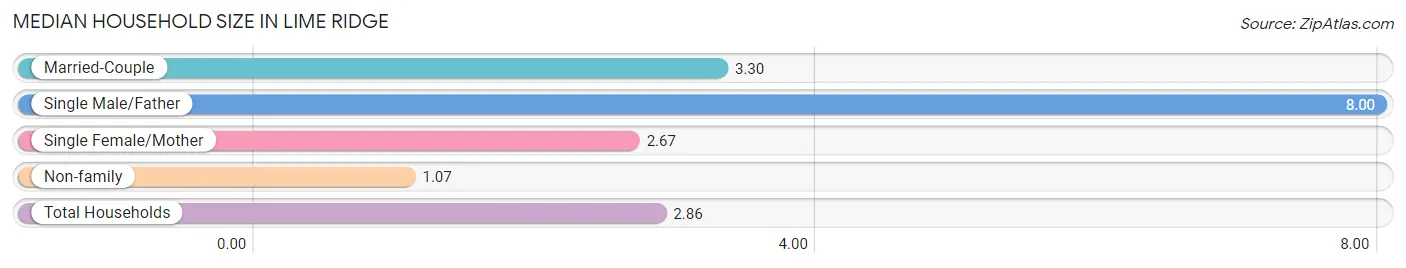
| Household Type | # Households | Household Size |
| Married-Couple | 47 (72.3%) | 3.30 |
| Single Male/Father | 1 (1.5%) | 8.00 |
| Single Female/Mother | 3 (4.6%) | 2.67 |
| Non-family | 14 (21.5%) | 1.07 |
| Total Households | 65 (100.0%) | 2.86 |
Household Size by Marriage Status in Lime Ridge
Out of a total of 65 households in Lime Ridge, 51 (78.5%) are family households, while 14 (21.5%) are nonfamily households. The most numerous type of family households are 2-person households, comprising 22, and the most common type of nonfamily households are 1-person households, comprising 13.
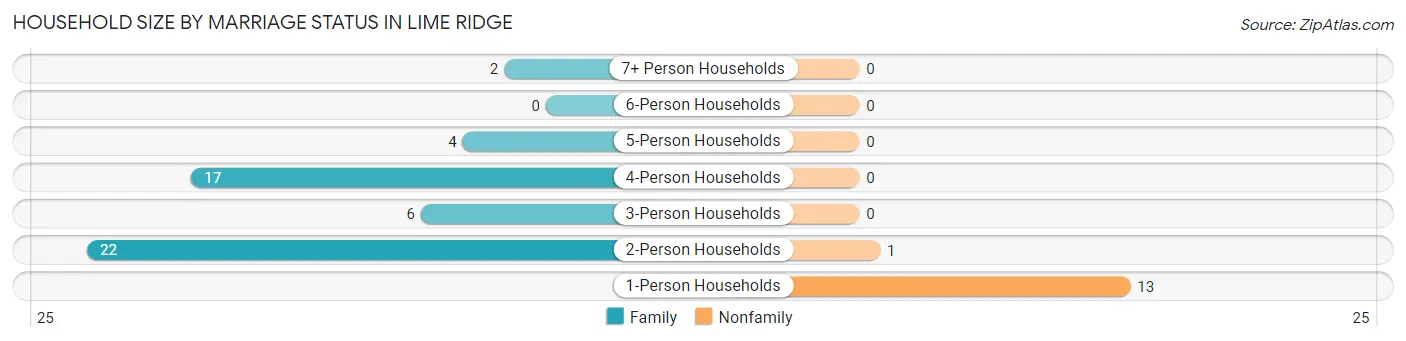
| Household Size | Family Households | Nonfamily Households |
| 1-Person Households | - | 13 (20.0%) |
| 2-Person Households | 22 (33.9%) | 1 (1.5%) |
| 3-Person Households | 6 (9.2%) | 0 (0.0%) |
| 4-Person Households | 17 (26.2%) | 0 (0.0%) |
| 5-Person Households | 4 (6.1%) | 0 (0.0%) |
| 6-Person Households | 0 (0.0%) | 0 (0.0%) |
| 7+ Person Households | 2 (3.1%) | 0 (0.0%) |
| Total | 51 (78.5%) | 14 (21.5%) |
Female Fertility in Lime Ridge
Fertility by Age in Lime Ridge
Average fertility rate in Lime Ridge is 32.0 births per 1,000 women. Women in the age bracket of 20 to 34 years have the highest fertility rate with 400.0 births per 1,000 women. Women in the age bracket of 20 to 34 years acount for 100.0% of all women with births.
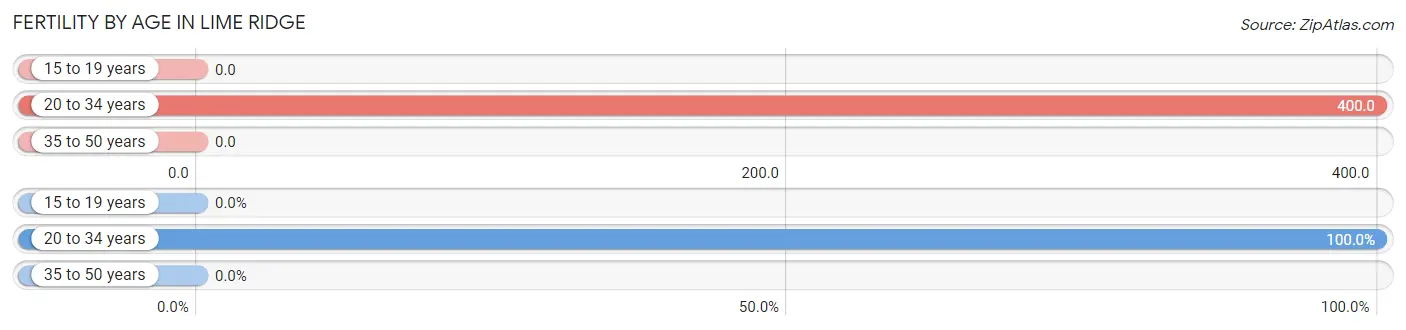
| Age Bracket | Women with Births | Births / 1,000 Women |
| 15 to 19 years | 0 (0.0%) | 0.0 |
| 20 to 34 years | 2 (100.0%) | 400.0 |
| 35 to 50 years | 0 (0.0%) | 0.0 |
| Total | 2 (100.0%) | 32.0 |
Fertility by Age by Marriage Status in Lime Ridge
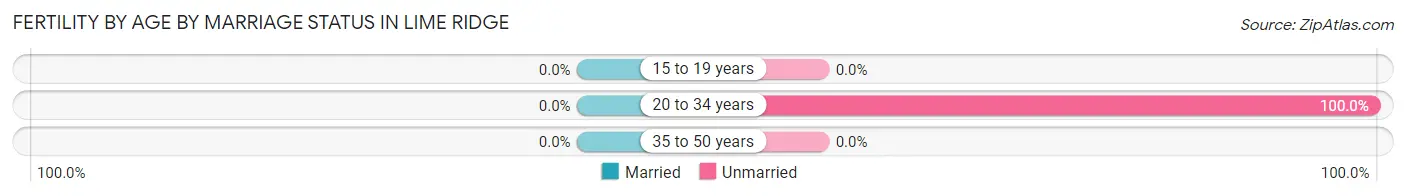
| Age Bracket | Married | Unmarried |
| 15 to 19 years | 0 (0.0%) | 0 (0.0%) |
| 20 to 34 years | 0 (0.0%) | 2 (100.0%) |
| 35 to 50 years | 0 (0.0%) | 0 (0.0%) |
| Total | 0 (0.0%) | 2 (100.0%) |
Fertility by Education in Lime Ridge
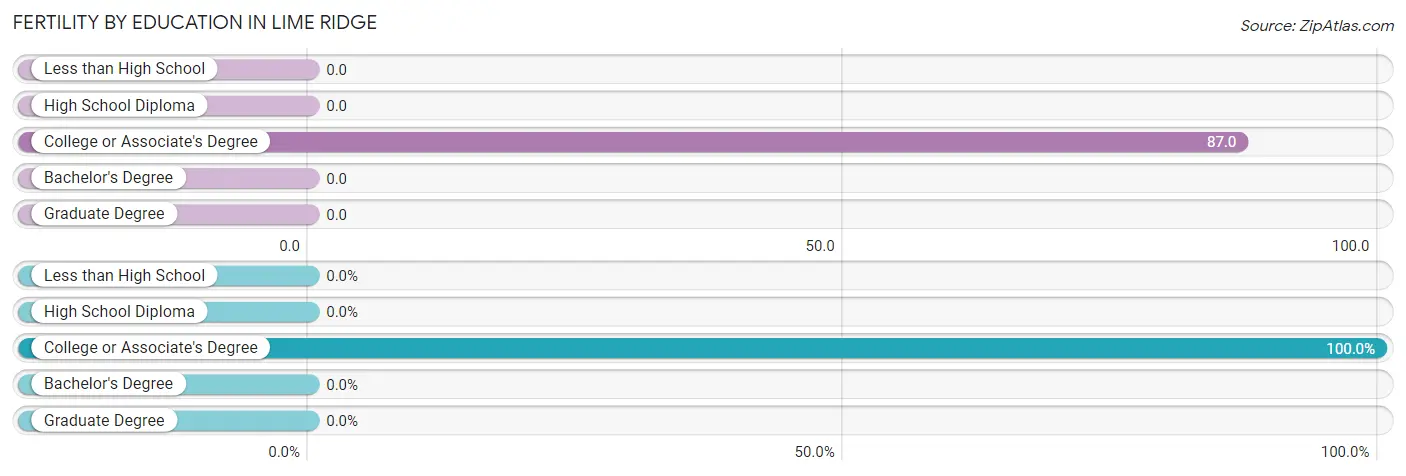
| Educational Attainment | Women with Births | Births / 1,000 Women |
| Less than High School | 0 (0.0%) | 0.0 |
| High School Diploma | 0 (0.0%) | 0.0 |
| College or Associate's Degree | 2 (100.0%) | 87.0 |
| Bachelor's Degree | 0 (0.0%) | 0.0 |
| Graduate Degree | 0 (0.0%) | 0.0 |
| Total | 2 (100.0%) | 32.0 |
Fertility by Education by Marriage Status in Lime Ridge
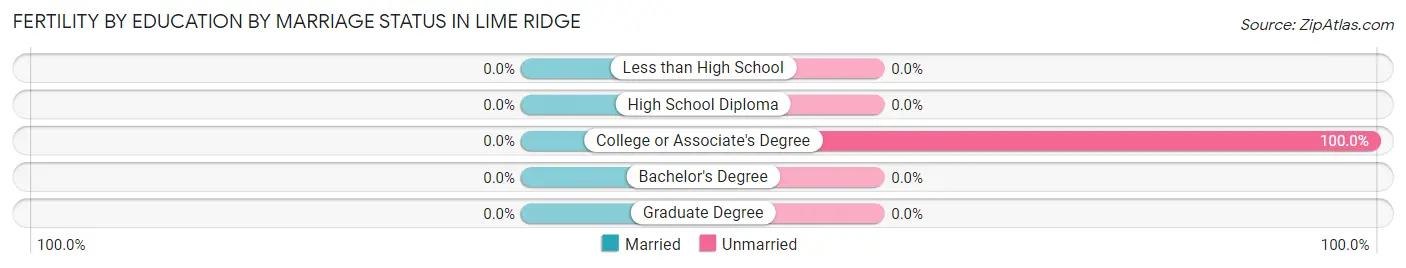
| Educational Attainment | Married | Unmarried |
| Less than High School | 0 (0.0%) | 0 (0.0%) |
| High School Diploma | 0 (0.0%) | 0 (0.0%) |
| College or Associate's Degree | 0 (0.0%) | 2 (100.0%) |
| Bachelor's Degree | 0 (0.0%) | 0 (0.0%) |
| Graduate Degree | 0 (0.0%) | 0 (0.0%) |
| Total | 0 (0.0%) | 2 (100.0%) |
Employment Characteristics in Lime Ridge
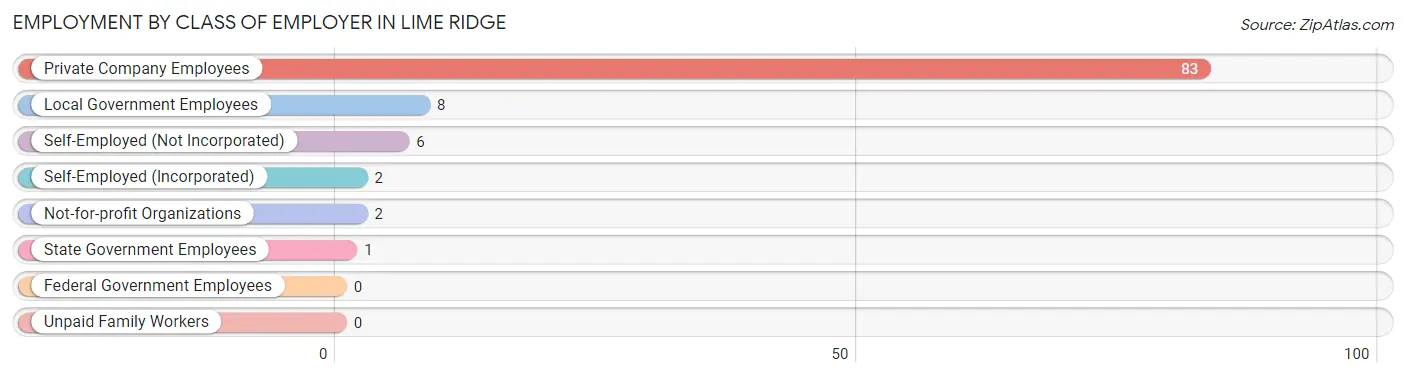
Employment by Class of Employer in Lime Ridge
Among the 102 employed individuals in Lime Ridge, private company employees (83 | 81.4%), local government employees (8 | 7.8%), and self-employed (not incorporated) (6 | 5.9%) make up the most common classes of employment.
| Employer Class | # Employees | % Employees |
| Private Company Employees | 83 | 81.4% |
| Self-Employed (Incorporated) | 2 | 2.0% |
| Self-Employed (Not Incorporated) | 6 | 5.9% |
| Not-for-profit Organizations | 2 | 2.0% |
| Local Government Employees | 8 | 7.8% |
| State Government Employees | 1 | 1.0% |
| Federal Government Employees | 0 | 0.0% |
| Unpaid Family Workers | 0 | 0.0% |
| Total | 102 | 100.0% |
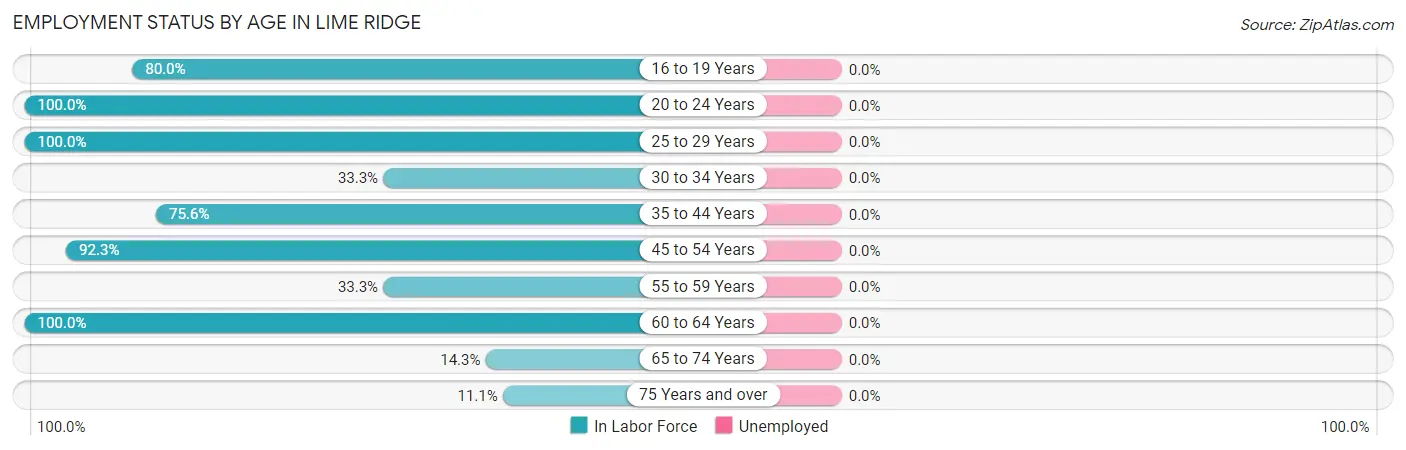
Employment Status by Age in Lime Ridge
| Age Bracket | In Labor Force | Unemployed |
| 16 to 19 Years | 12 (80.0%) | 0 (0.0%) |
| 20 to 24 Years | 8 (100.0%) | 0 (0.0%) |
| 25 to 29 Years | 3 (100.0%) | 0 (0.0%) |
| 30 to 34 Years | 1 (33.3%) | 0 (0.0%) |
| 35 to 44 Years | 31 (75.6%) | 0 (0.0%) |
| 45 to 54 Years | 36 (92.3%) | 0 (0.0%) |
| 55 to 59 Years | 1 (33.3%) | 0 (0.0%) |
| 60 to 64 Years | 6 (100.0%) | 0 (0.0%) |
| 65 to 74 Years | 2 (14.3%) | 0 (0.0%) |
| 75 Years and over | 2 (11.1%) | 0 (0.0%) |
| Total | 102 (68.0%) | 0 (0.0%) |
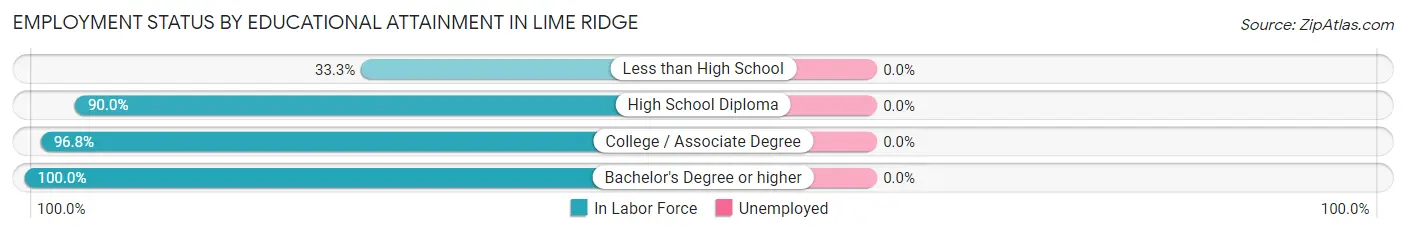
Employment Status by Educational Attainment in Lime Ridge
| Educational Attainment | In Labor Force | Unemployed |
| Less than High School | 6 (33.3%) | 0 (0.0%) |
| High School Diploma | 36 (90.0%) | 0 (0.0%) |
| College / Associate Degree | 30 (96.8%) | 0 (0.0%) |
| Bachelor's Degree or higher | 6 (100.0%) | 0 (0.0%) |
| Total | 78 (82.1%) | 0 (0.0%) |
Employment Occupations by Sex in Lime Ridge
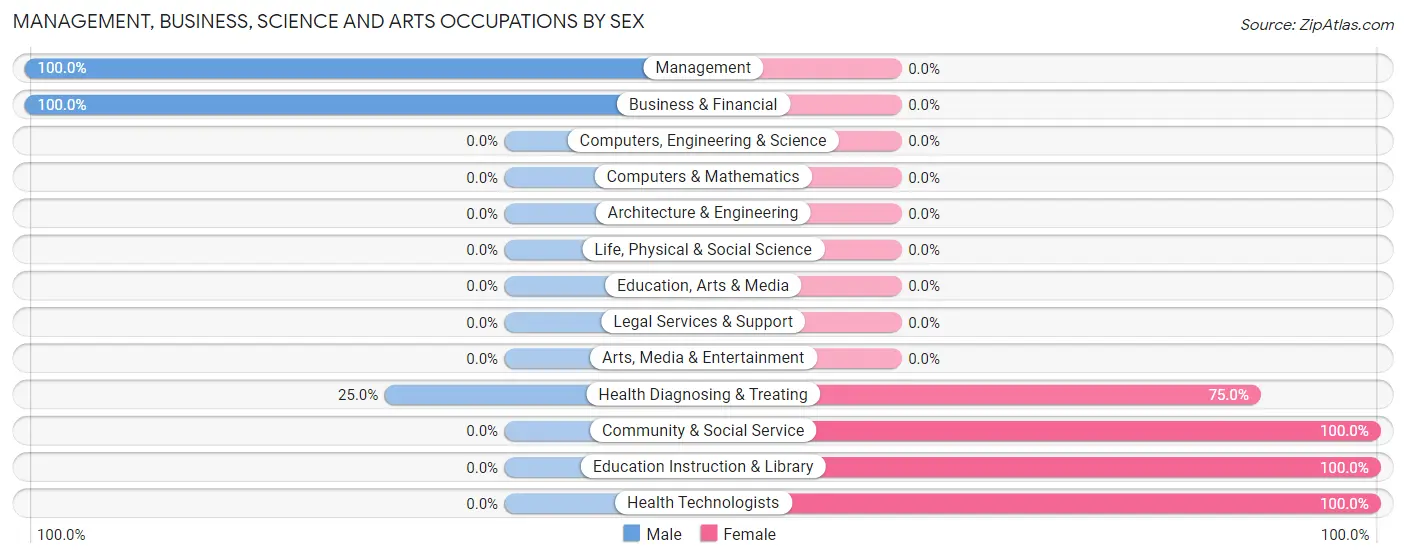
Management, Business, Science and Arts Occupations
The most common Management, Business, Science and Arts occupations in Lime Ridge are Management (11 | 10.8%), Health Diagnosing & Treating (4 | 3.9%), Business & Financial (3 | 2.9%), Community & Social Service (3 | 2.9%), and Education Instruction & Library (3 | 2.9%).
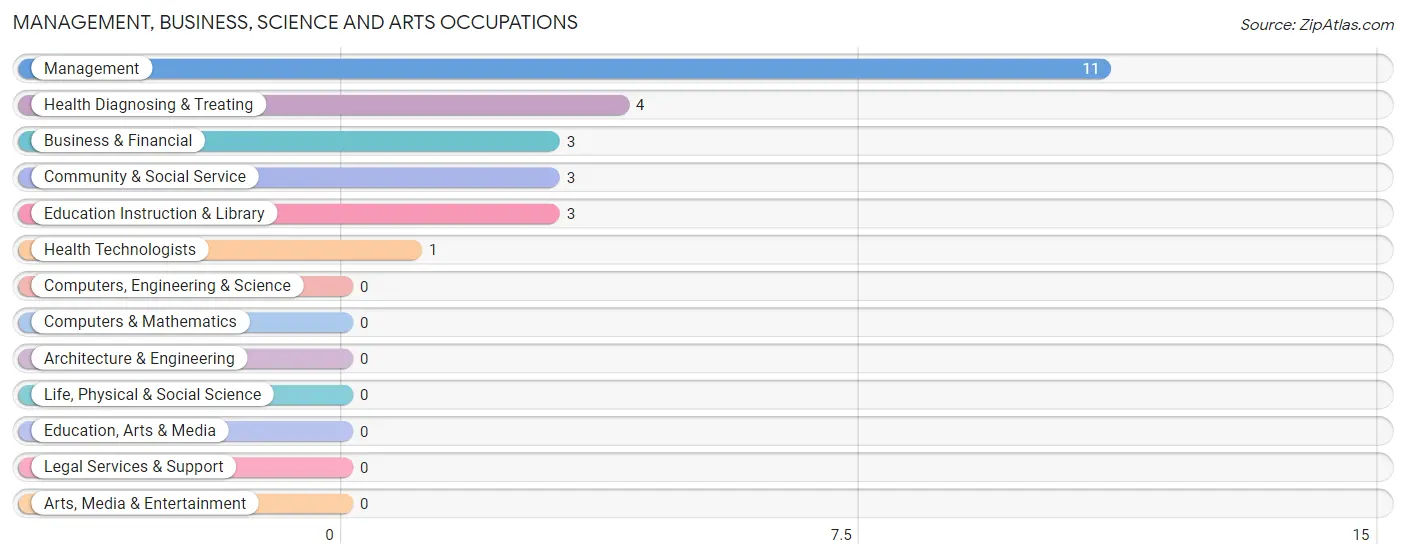
Management, Business, Science and Arts Occupations by Sex
Within the Management, Business, Science and Arts occupations in Lime Ridge, the most male-oriented occupations are Management (100.0%), Business & Financial (100.0%), and Health Diagnosing & Treating (25.0%), while the most female-oriented occupations are Community & Social Service (100.0%), Education Instruction & Library (100.0%), and Health Technologists (100.0%).
| Occupation | Male | Female |
| Management | 11 (100.0%) | 0 (0.0%) |
| Business & Financial | 3 (100.0%) | 0 (0.0%) |
| Computers, Engineering & Science | 0 (0.0%) | 0 (0.0%) |
| Computers & Mathematics | 0 (0.0%) | 0 (0.0%) |
| Architecture & Engineering | 0 (0.0%) | 0 (0.0%) |
| Life, Physical & Social Science | 0 (0.0%) | 0 (0.0%) |
| Community & Social Service | 0 (0.0%) | 3 (100.0%) |
| Education, Arts & Media | 0 (0.0%) | 0 (0.0%) |
| Legal Services & Support | 0 (0.0%) | 0 (0.0%) |
| Education Instruction & Library | 0 (0.0%) | 3 (100.0%) |
| Arts, Media & Entertainment | 0 (0.0%) | 0 (0.0%) |
| Health Diagnosing & Treating | 1 (25.0%) | 3 (75.0%) |
| Health Technologists | 0 (0.0%) | 1 (100.0%) |
| Total (Category) | 15 (71.4%) | 6 (28.6%) |
| Total (Overall) | 57 (55.9%) | 45 (44.1%) |
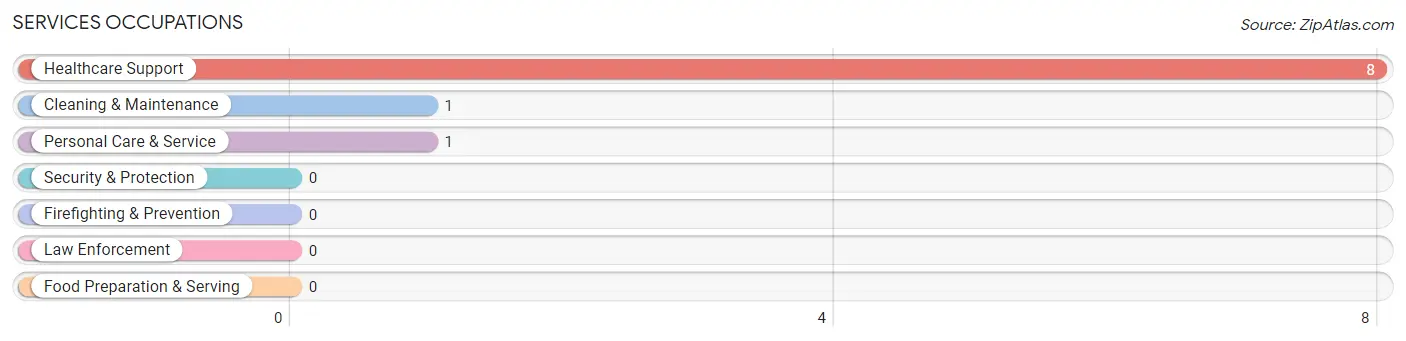
Services Occupations
The most common Services occupations in Lime Ridge are Healthcare Support (8 | 7.8%), Cleaning & Maintenance (1 | 1.0%), and Personal Care & Service (1 | 1.0%).
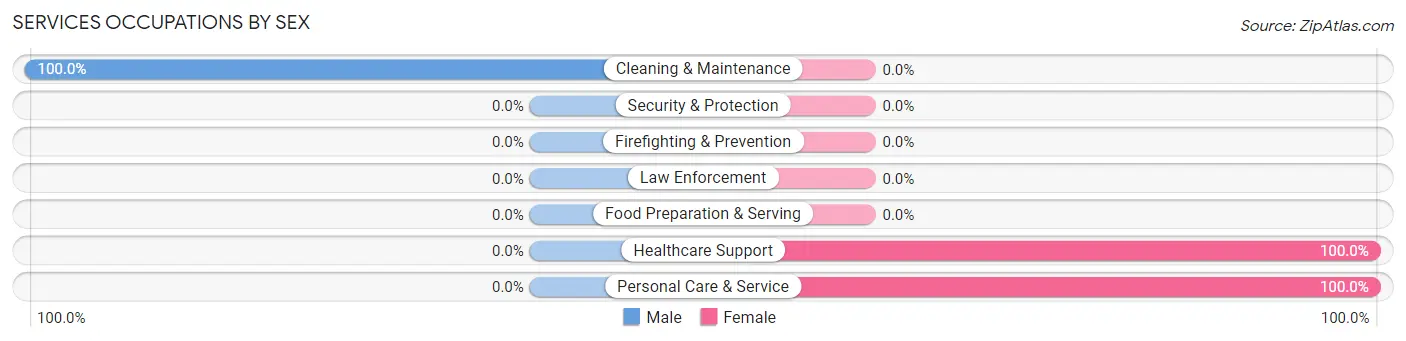
Services Occupations by Sex
| Occupation | Male | Female |
| Healthcare Support | 0 (0.0%) | 8 (100.0%) |
| Security & Protection | 0 (0.0%) | 0 (0.0%) |
| Firefighting & Prevention | 0 (0.0%) | 0 (0.0%) |
| Law Enforcement | 0 (0.0%) | 0 (0.0%) |
| Food Preparation & Serving | 0 (0.0%) | 0 (0.0%) |
| Cleaning & Maintenance | 1 (100.0%) | 0 (0.0%) |
| Personal Care & Service | 0 (0.0%) | 1 (100.0%) |
| Total (Category) | 1 (10.0%) | 9 (90.0%) |
| Total (Overall) | 57 (55.9%) | 45 (44.1%) |
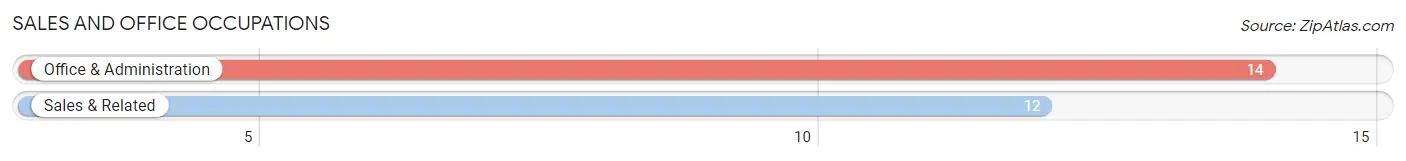
Sales and Office Occupations
The most common Sales and Office occupations in Lime Ridge are Office & Administration (14 | 13.7%), and Sales & Related (12 | 11.8%).
Sales and Office Occupations by Sex
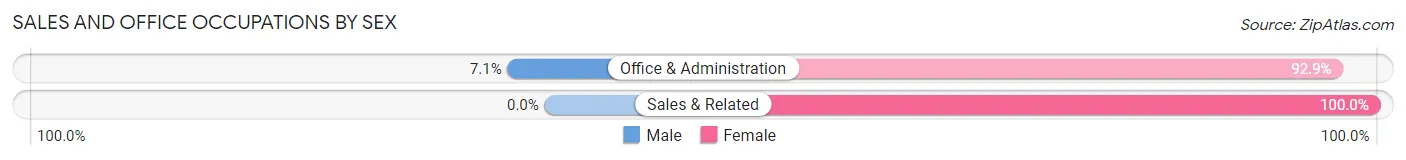
| Occupation | Male | Female |
| Sales & Related | 0 (0.0%) | 12 (100.0%) |
| Office & Administration | 1 (7.1%) | 13 (92.9%) |
| Total (Category) | 1 (3.8%) | 25 (96.2%) |
| Total (Overall) | 57 (55.9%) | 45 (44.1%) |
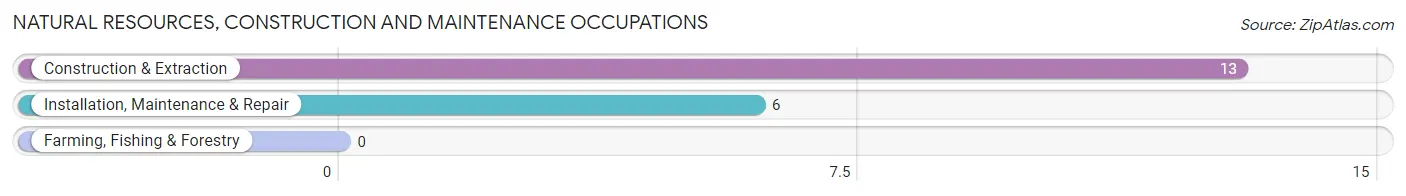
Natural Resources, Construction and Maintenance Occupations
The most common Natural Resources, Construction and Maintenance occupations in Lime Ridge are Construction & Extraction (13 | 12.8%), and Installation, Maintenance & Repair (6 | 5.9%).
Natural Resources, Construction and Maintenance Occupations by Sex
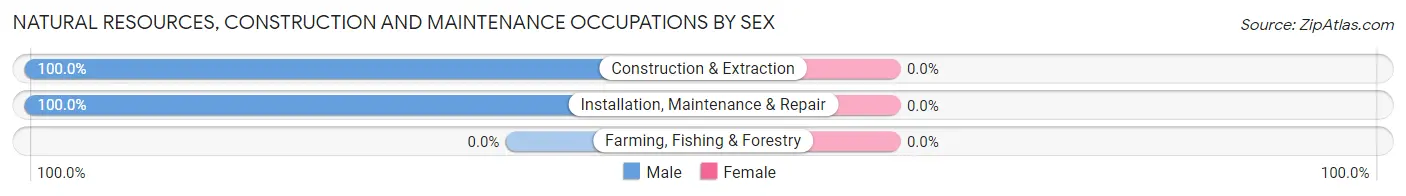
| Occupation | Male | Female |
| Farming, Fishing & Forestry | 0 (0.0%) | 0 (0.0%) |
| Construction & Extraction | 13 (100.0%) | 0 (0.0%) |
| Installation, Maintenance & Repair | 6 (100.0%) | 0 (0.0%) |
| Total (Category) | 19 (100.0%) | 0 (0.0%) |
| Total (Overall) | 57 (55.9%) | 45 (44.1%) |
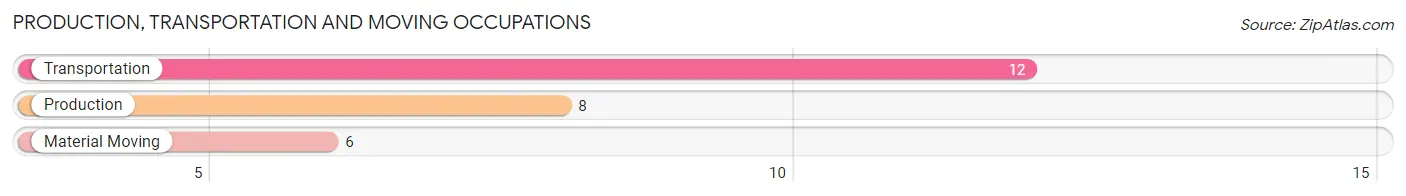
Production, Transportation and Moving Occupations
The most common Production, Transportation and Moving occupations in Lime Ridge are Transportation (12 | 11.8%), Production (8 | 7.8%), and Material Moving (6 | 5.9%).
Production, Transportation and Moving Occupations by Sex
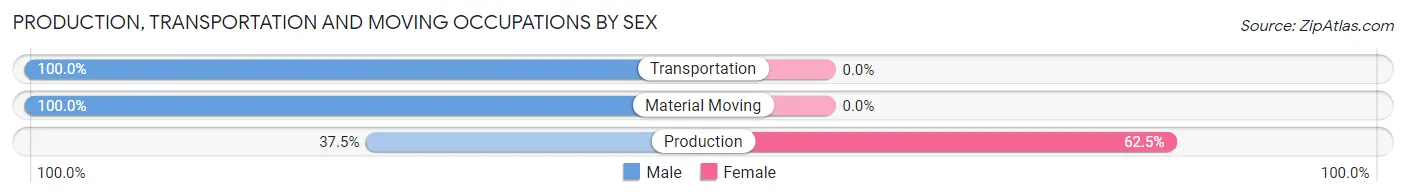
| Occupation | Male | Female |
| Production | 3 (37.5%) | 5 (62.5%) |
| Transportation | 12 (100.0%) | 0 (0.0%) |
| Material Moving | 6 (100.0%) | 0 (0.0%) |
| Total (Category) | 21 (80.8%) | 5 (19.2%) |
| Total (Overall) | 57 (55.9%) | 45 (44.1%) |
Employment Industries by Sex in Lime Ridge
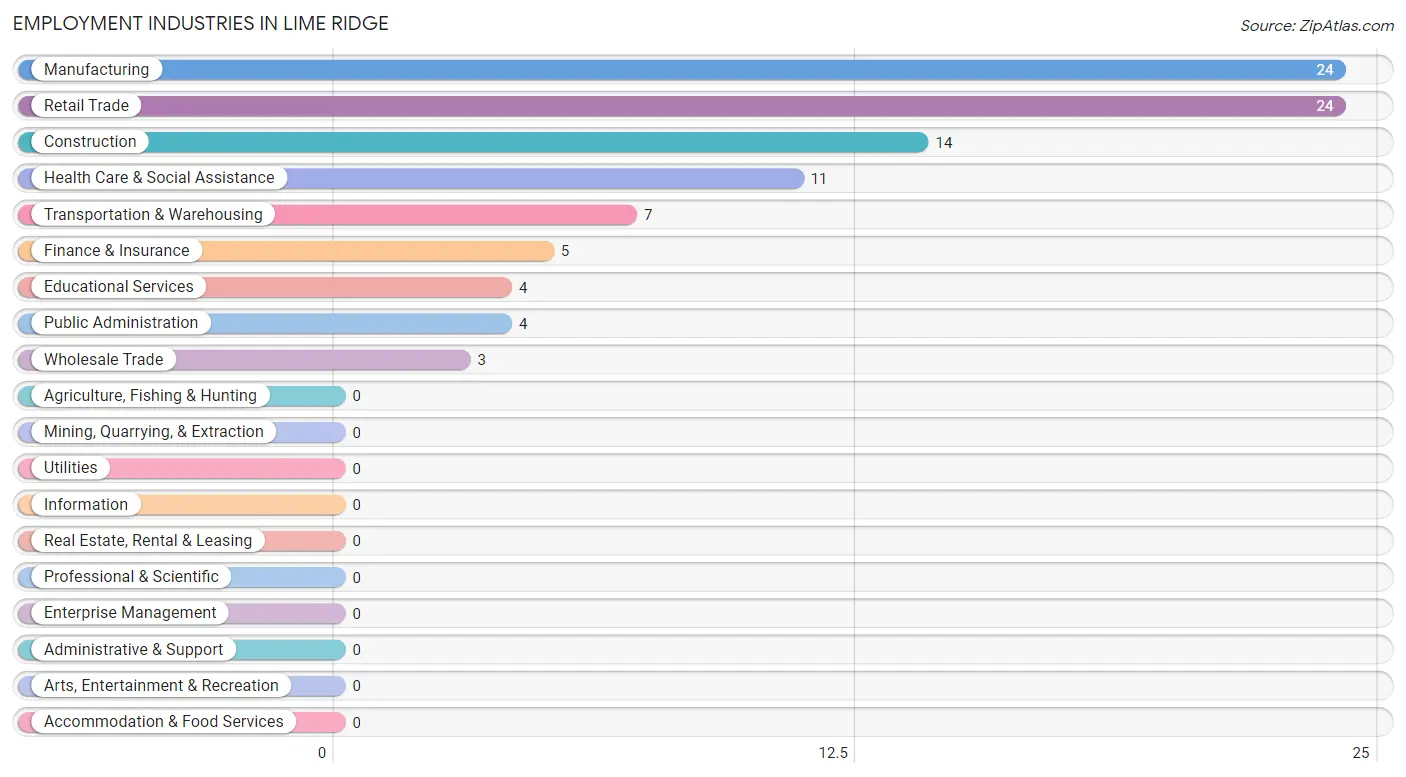
Employment Industries in Lime Ridge
The major employment industries in Lime Ridge include Manufacturing (24 | 23.5%), Retail Trade (24 | 23.5%), Construction (14 | 13.7%), Health Care & Social Assistance (11 | 10.8%), and Transportation & Warehousing (7 | 6.9%).
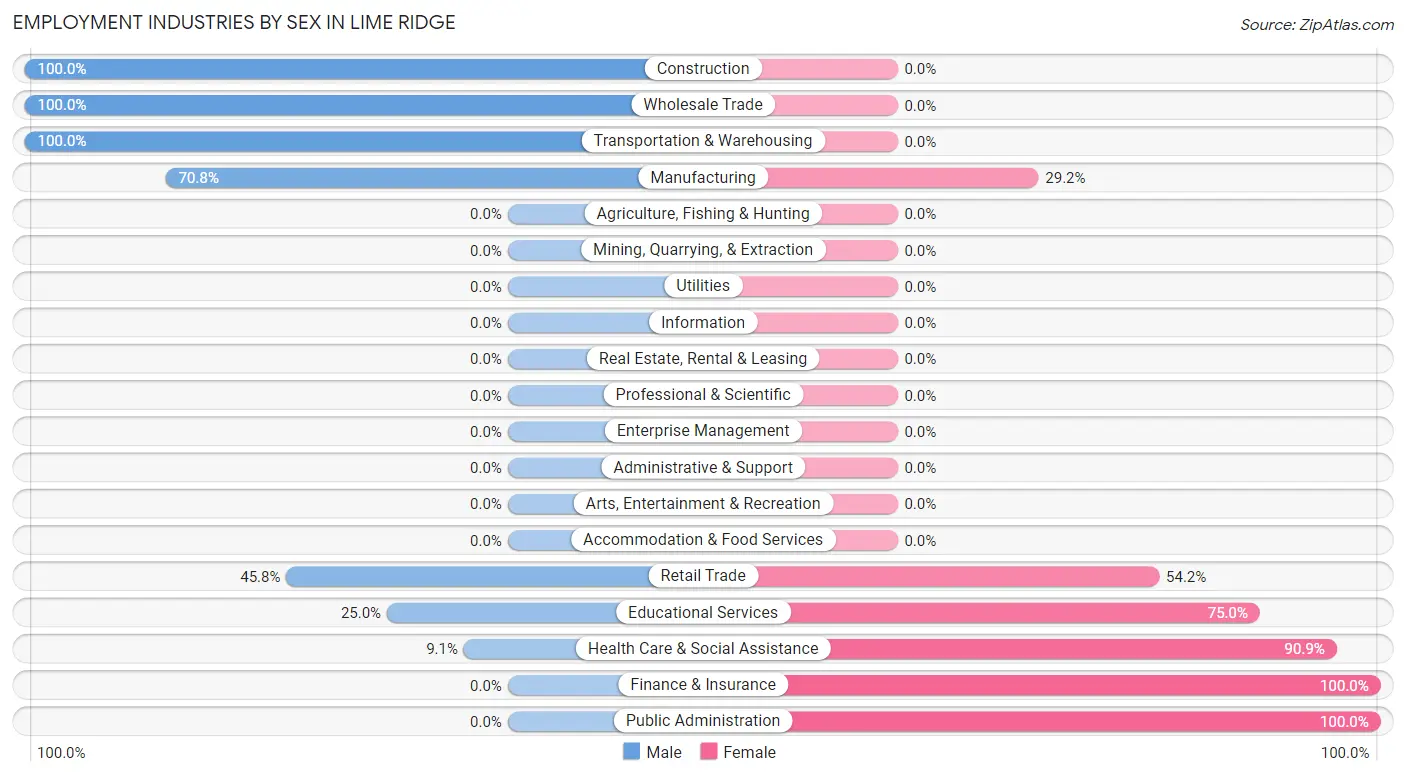
Employment Industries by Sex in Lime Ridge
The Lime Ridge industries that see more men than women are Construction (100.0%), Wholesale Trade (100.0%), and Transportation & Warehousing (100.0%), whereas the industries that tend to have a higher number of women are Finance & Insurance (100.0%), Public Administration (100.0%), and Health Care & Social Assistance (90.9%).
| Industry | Male | Female |
| Agriculture, Fishing & Hunting | 0 (0.0%) | 0 (0.0%) |
| Mining, Quarrying, & Extraction | 0 (0.0%) | 0 (0.0%) |
| Construction | 14 (100.0%) | 0 (0.0%) |
| Manufacturing | 17 (70.8%) | 7 (29.2%) |
| Wholesale Trade | 3 (100.0%) | 0 (0.0%) |
| Retail Trade | 11 (45.8%) | 13 (54.2%) |
| Transportation & Warehousing | 7 (100.0%) | 0 (0.0%) |
| Utilities | 0 (0.0%) | 0 (0.0%) |
| Information | 0 (0.0%) | 0 (0.0%) |
| Finance & Insurance | 0 (0.0%) | 5 (100.0%) |
| Real Estate, Rental & Leasing | 0 (0.0%) | 0 (0.0%) |
| Professional & Scientific | 0 (0.0%) | 0 (0.0%) |
| Enterprise Management | 0 (0.0%) | 0 (0.0%) |
| Administrative & Support | 0 (0.0%) | 0 (0.0%) |
| Educational Services | 1 (25.0%) | 3 (75.0%) |
| Health Care & Social Assistance | 1 (9.1%) | 10 (90.9%) |
| Arts, Entertainment & Recreation | 0 (0.0%) | 0 (0.0%) |
| Accommodation & Food Services | 0 (0.0%) | 0 (0.0%) |
| Public Administration | 0 (0.0%) | 4 (100.0%) |
| Total | 57 (55.9%) | 45 (44.1%) |
Education in Lime Ridge
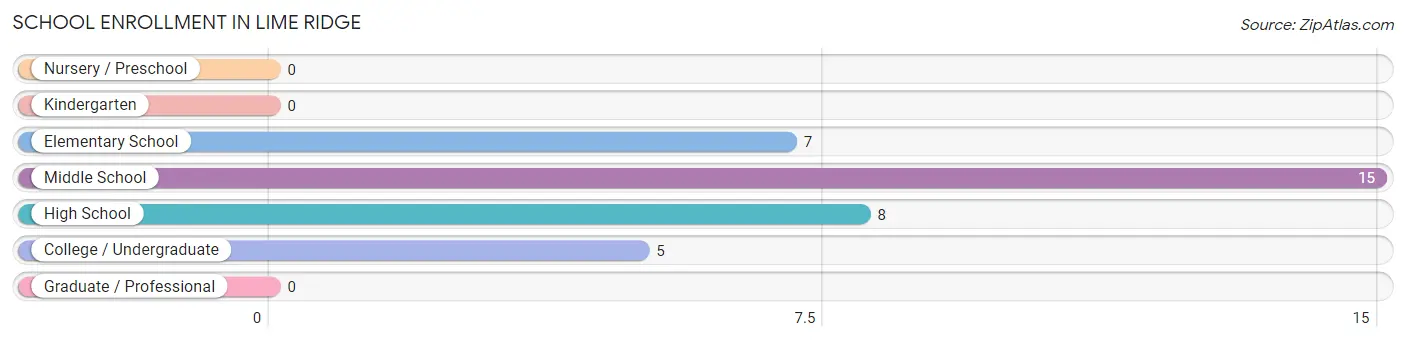
School Enrollment in Lime Ridge
The most common levels of schooling among the 35 students in Lime Ridge are middle school (15 | 42.9%), high school (8 | 22.9%), and elementary school (7 | 20.0%).
| School Level | # Students | % Students |
| Nursery / Preschool | 0 | 0.0% |
| Kindergarten | 0 | 0.0% |
| Elementary School | 7 | 20.0% |
| Middle School | 15 | 42.9% |
| High School | 8 | 22.9% |
| College / Undergraduate | 5 | 14.3% |
| Graduate / Professional | 0 | 0.0% |
| Total | 35 | 100.0% |
School Enrollment by Age by Funding Source in Lime Ridge
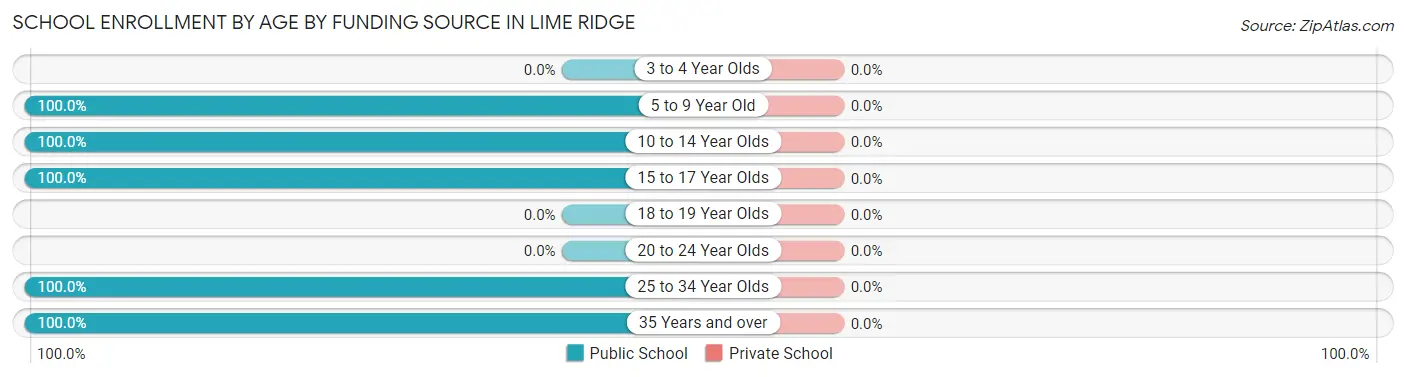
| Age Bracket | Public School | Private School |
| 3 to 4 Year Olds | 0 (0.0%) | 0 (0.0%) |
| 5 to 9 Year Old | 5 (100.0%) | 0 (0.0%) |
| 10 to 14 Year Olds | 18 (100.0%) | 0 (0.0%) |
| 15 to 17 Year Olds | 7 (100.0%) | 0 (0.0%) |
| 18 to 19 Year Olds | 0 (0.0%) | 0 (0.0%) |
| 20 to 24 Year Olds | 0 (0.0%) | 0 (0.0%) |
| 25 to 34 Year Olds | 1 (100.0%) | 0 (0.0%) |
| 35 Years and over | 4 (100.0%) | 0 (0.0%) |
| Total | 35 (100.0%) | 0 (0.0%) |
Educational Attainment by Field of Study in Lime Ridge
Computers & mathematics (3 | 18.8%), science & technology (3 | 18.8%), arts & humanities (3 | 18.8%), education (2 | 12.5%), and communications (2 | 12.5%) are the most common fields of study among 16 individuals in Lime Ridge who have obtained a bachelor's degree or higher.
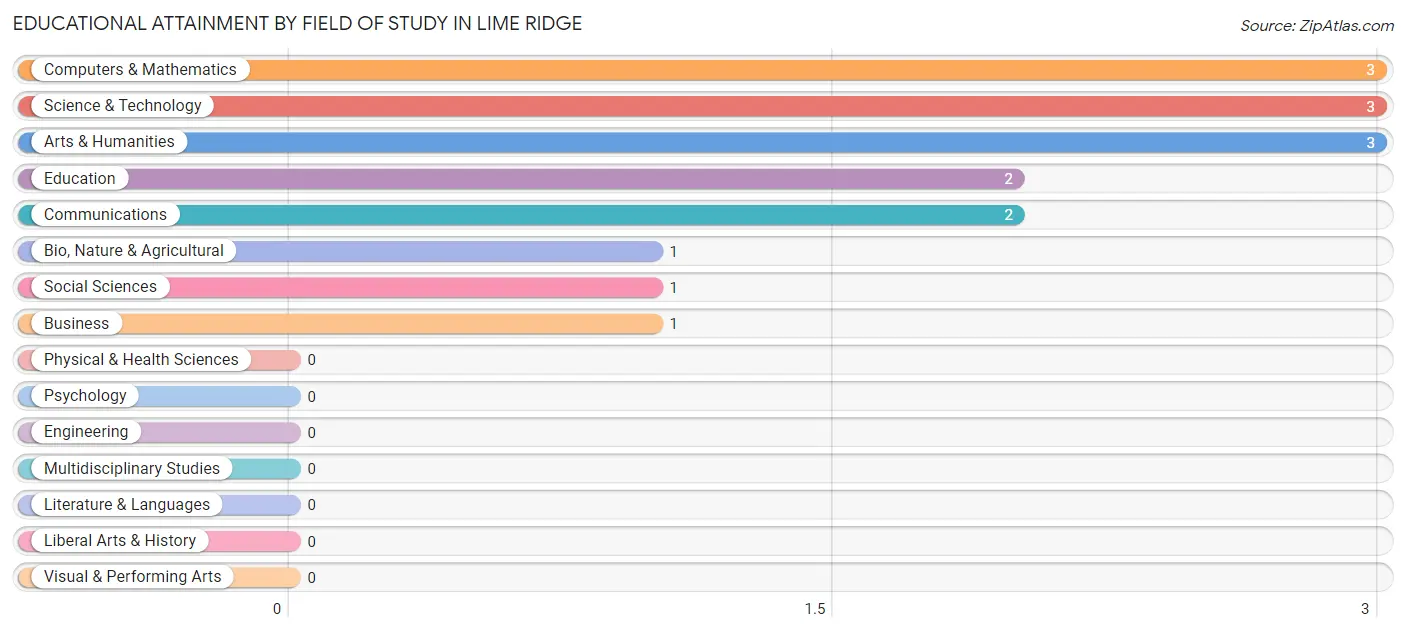
| Field of Study | # Graduates | % Graduates |
| Computers & Mathematics | 3 | 18.8% |
| Bio, Nature & Agricultural | 1 | 6.2% |
| Physical & Health Sciences | 0 | 0.0% |
| Psychology | 0 | 0.0% |
| Social Sciences | 1 | 6.2% |
| Engineering | 0 | 0.0% |
| Multidisciplinary Studies | 0 | 0.0% |
| Science & Technology | 3 | 18.8% |
| Business | 1 | 6.2% |
| Education | 2 | 12.5% |
| Literature & Languages | 0 | 0.0% |
| Liberal Arts & History | 0 | 0.0% |
| Visual & Performing Arts | 0 | 0.0% |
| Communications | 2 | 12.5% |
| Arts & Humanities | 3 | 18.8% |
| Total | 16 | 100.0% |
Transportation & Commute in Lime Ridge
Vehicle Availability by Sex in Lime Ridge
The most prevalent vehicle ownership categories in Lime Ridge are males with 3 vehicles (23, accounting for 40.4%) and females with 3 vehicles (14, making up 51.1%).
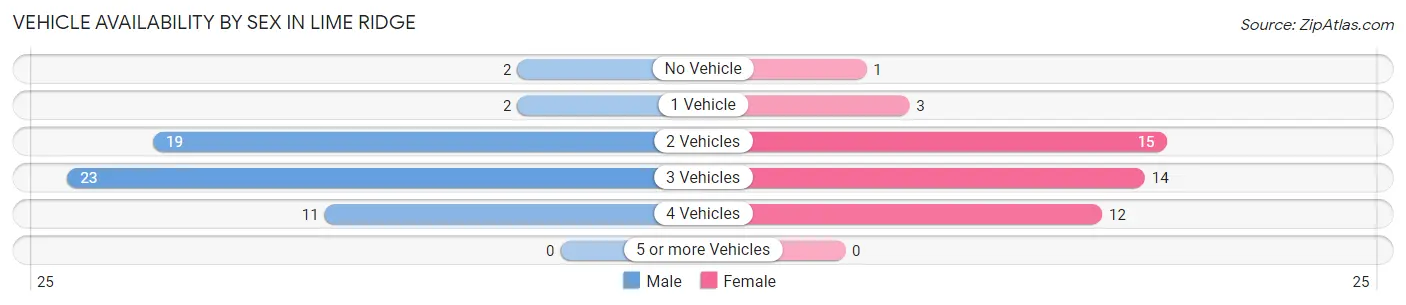
| Vehicles Available | Male | Female |
| No Vehicle | 2 (3.5%) | 1 (2.2%) |
| 1 Vehicle | 2 (3.5%) | 3 (6.7%) |
| 2 Vehicles | 19 (33.3%) | 15 (33.3%) |
| 3 Vehicles | 23 (40.4%) | 14 (31.1%) |
| 4 Vehicles | 11 (19.3%) | 12 (26.7%) |
| 5 or more Vehicles | 0 (0.0%) | 0 (0.0%) |
| Total | 57 (100.0%) | 45 (100.0%) |
Commute Time in Lime Ridge
The most frequently occuring commute durations in Lime Ridge are 20 to 24 minutes (22 commuters, 22.2%), 45 to 59 minutes (17 commuters, 17.2%), and 15 to 19 minutes (14 commuters, 14.1%).
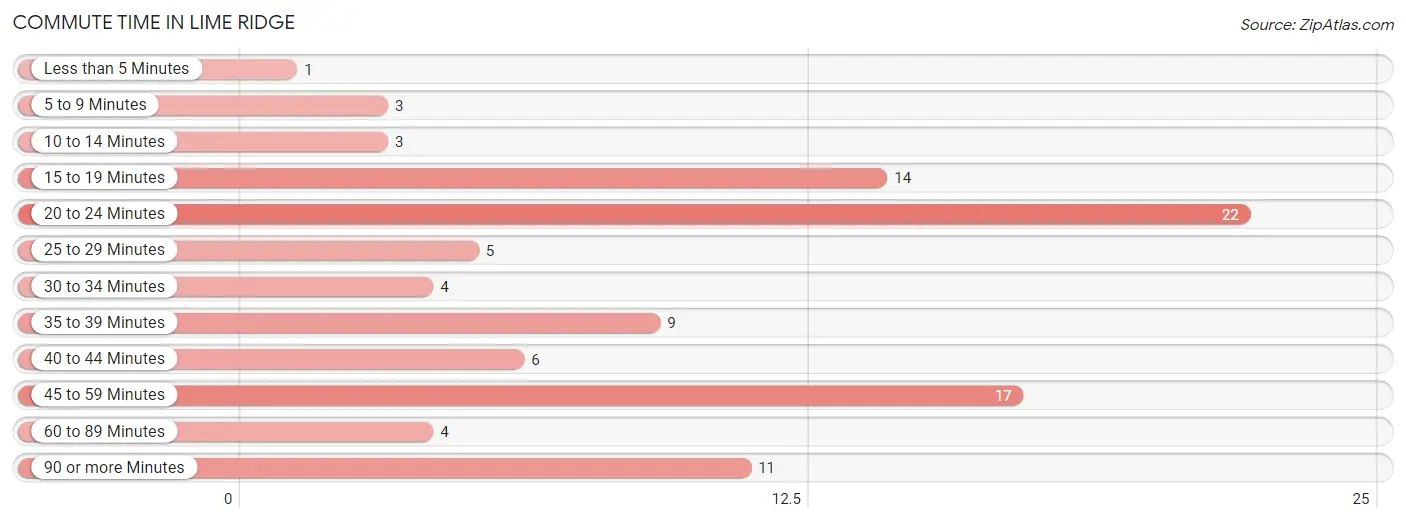
| Commute Time | # Commuters | % Commuters |
| Less than 5 Minutes | 1 | 1.0% |
| 5 to 9 Minutes | 3 | 3.0% |
| 10 to 14 Minutes | 3 | 3.0% |
| 15 to 19 Minutes | 14 | 14.1% |
| 20 to 24 Minutes | 22 | 22.2% |
| 25 to 29 Minutes | 5 | 5.1% |
| 30 to 34 Minutes | 4 | 4.0% |
| 35 to 39 Minutes | 9 | 9.1% |
| 40 to 44 Minutes | 6 | 6.1% |
| 45 to 59 Minutes | 17 | 17.2% |
| 60 to 89 Minutes | 4 | 4.0% |
| 90 or more Minutes | 11 | 11.1% |
Commute Time by Sex in Lime Ridge
The most common commute times in Lime Ridge are 20 to 24 minutes (13 commuters, 22.8%) for males and 45 to 59 minutes (12 commuters, 28.6%) for females.

| Commute Time | Male | Female |
| Less than 5 Minutes | 0 (0.0%) | 1 (2.4%) |
| 5 to 9 Minutes | 1 (1.8%) | 2 (4.8%) |
| 10 to 14 Minutes | 3 (5.3%) | 0 (0.0%) |
| 15 to 19 Minutes | 8 (14.0%) | 6 (14.3%) |
| 20 to 24 Minutes | 13 (22.8%) | 9 (21.4%) |
| 25 to 29 Minutes | 4 (7.0%) | 1 (2.4%) |
| 30 to 34 Minutes | 3 (5.3%) | 1 (2.4%) |
| 35 to 39 Minutes | 5 (8.8%) | 4 (9.5%) |
| 40 to 44 Minutes | 1 (1.8%) | 5 (11.9%) |
| 45 to 59 Minutes | 5 (8.8%) | 12 (28.6%) |
| 60 to 89 Minutes | 4 (7.0%) | 0 (0.0%) |
| 90 or more Minutes | 10 (17.5%) | 1 (2.4%) |
Time of Departure to Work by Sex in Lime Ridge
The most frequent times of departure to work in Lime Ridge are 12:00 AM to 4:59 AM (9, 15.8%) for males and 7:00 AM to 7:29 AM (17, 40.5%) for females.
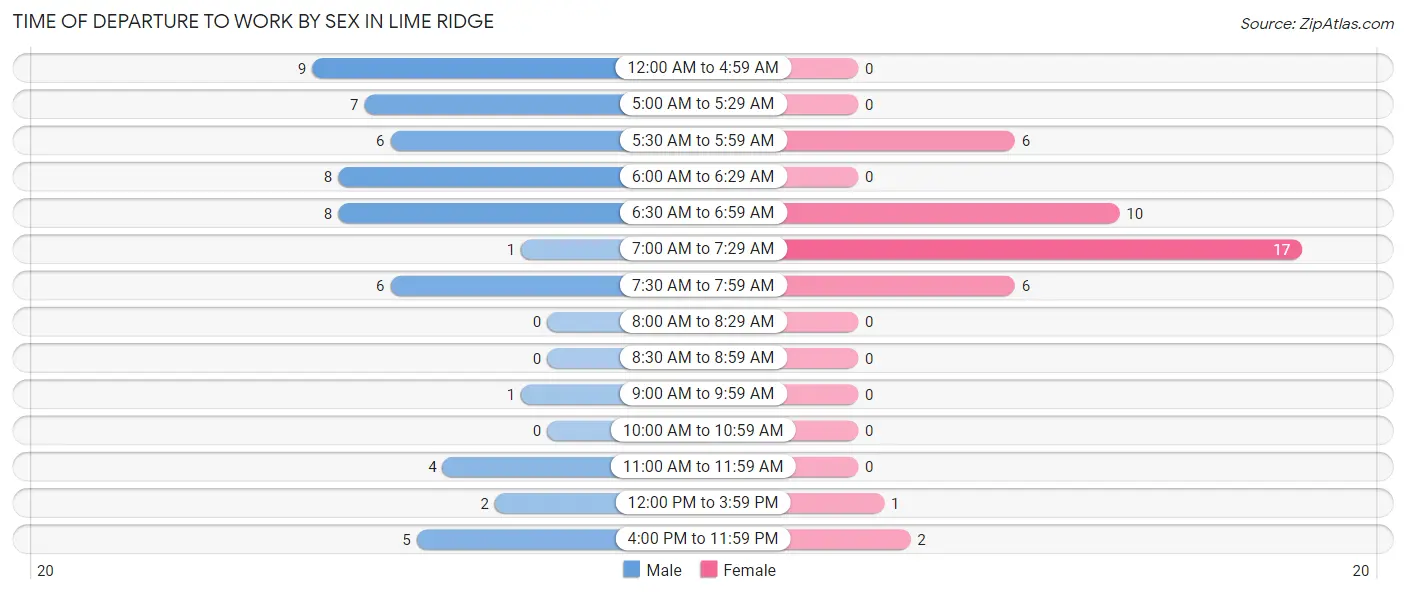
| Time of Departure | Male | Female |
| 12:00 AM to 4:59 AM | 9 (15.8%) | 0 (0.0%) |
| 5:00 AM to 5:29 AM | 7 (12.3%) | 0 (0.0%) |
| 5:30 AM to 5:59 AM | 6 (10.5%) | 6 (14.3%) |
| 6:00 AM to 6:29 AM | 8 (14.0%) | 0 (0.0%) |
| 6:30 AM to 6:59 AM | 8 (14.0%) | 10 (23.8%) |
| 7:00 AM to 7:29 AM | 1 (1.8%) | 17 (40.5%) |
| 7:30 AM to 7:59 AM | 6 (10.5%) | 6 (14.3%) |
| 8:00 AM to 8:29 AM | 0 (0.0%) | 0 (0.0%) |
| 8:30 AM to 8:59 AM | 0 (0.0%) | 0 (0.0%) |
| 9:00 AM to 9:59 AM | 1 (1.8%) | 0 (0.0%) |
| 10:00 AM to 10:59 AM | 0 (0.0%) | 0 (0.0%) |
| 11:00 AM to 11:59 AM | 4 (7.0%) | 0 (0.0%) |
| 12:00 PM to 3:59 PM | 2 (3.5%) | 1 (2.4%) |
| 4:00 PM to 11:59 PM | 5 (8.8%) | 2 (4.8%) |
| Total | 57 (100.0%) | 42 (100.0%) |
Housing Occupancy in Lime Ridge
Occupancy by Ownership in Lime Ridge
Of the total 65 dwellings in Lime Ridge, owner-occupied units account for 53 (81.5%), while renter-occupied units make up 12 (18.5%).
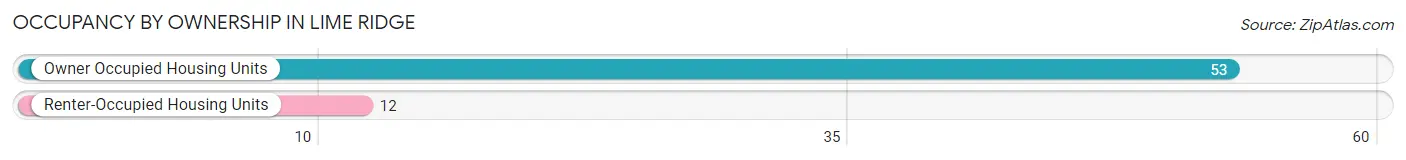
| Occupancy | # Housing Units | % Housing Units |
| Owner Occupied Housing Units | 53 | 81.5% |
| Renter-Occupied Housing Units | 12 | 18.5% |
| Total Occupied Housing Units | 65 | 100.0% |
Occupancy by Household Size in Lime Ridge
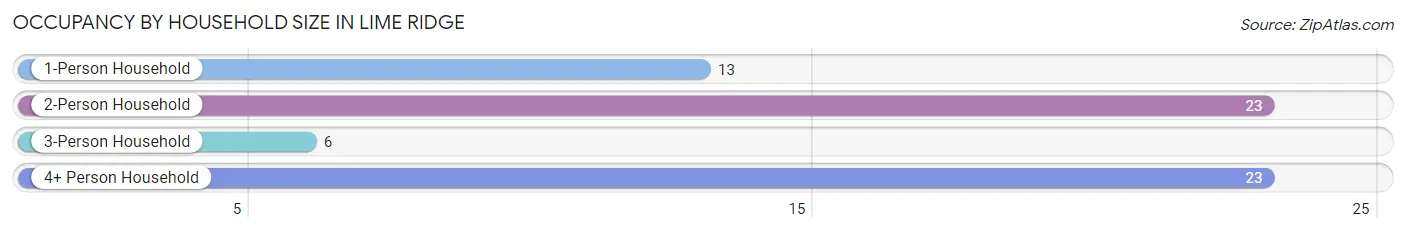
| Household Size | # Housing Units | % Housing Units |
| 1-Person Household | 13 | 20.0% |
| 2-Person Household | 23 | 35.4% |
| 3-Person Household | 6 | 9.2% |
| 4+ Person Household | 23 | 35.4% |
| Total Housing Units | 65 | 100.0% |
Occupancy by Ownership by Household Size in Lime Ridge
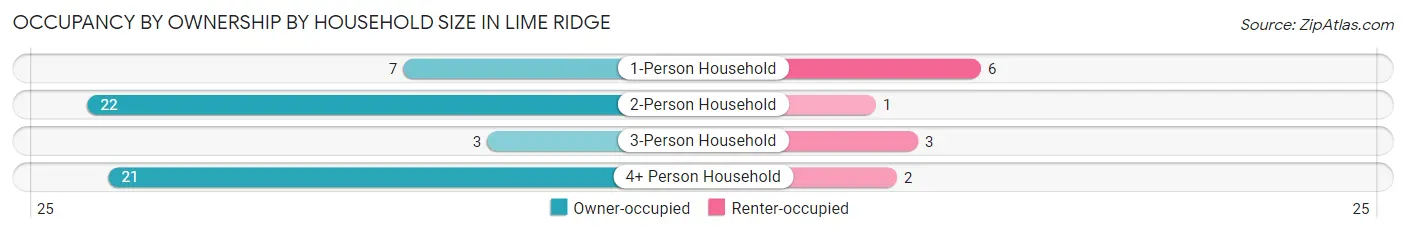
| Household Size | Owner-occupied | Renter-occupied |
| 1-Person Household | 7 (53.8%) | 6 (46.2%) |
| 2-Person Household | 22 (95.7%) | 1 (4.3%) |
| 3-Person Household | 3 (50.0%) | 3 (50.0%) |
| 4+ Person Household | 21 (91.3%) | 2 (8.7%) |
| Total Housing Units | 53 (81.5%) | 12 (18.5%) |
Occupancy by Educational Attainment in Lime Ridge
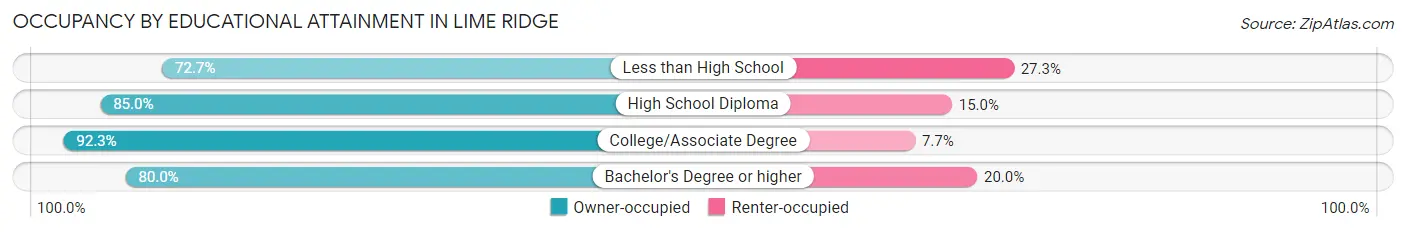
| Household Size | Owner-occupied | Renter-occupied |
| Less than High School | 16 (72.7%) | 6 (27.3%) |
| High School Diploma | 17 (85.0%) | 3 (15.0%) |
| College/Associate Degree | 12 (92.3%) | 1 (7.7%) |
| Bachelor's Degree or higher | 8 (80.0%) | 2 (20.0%) |
Occupancy by Age of Householder in Lime Ridge
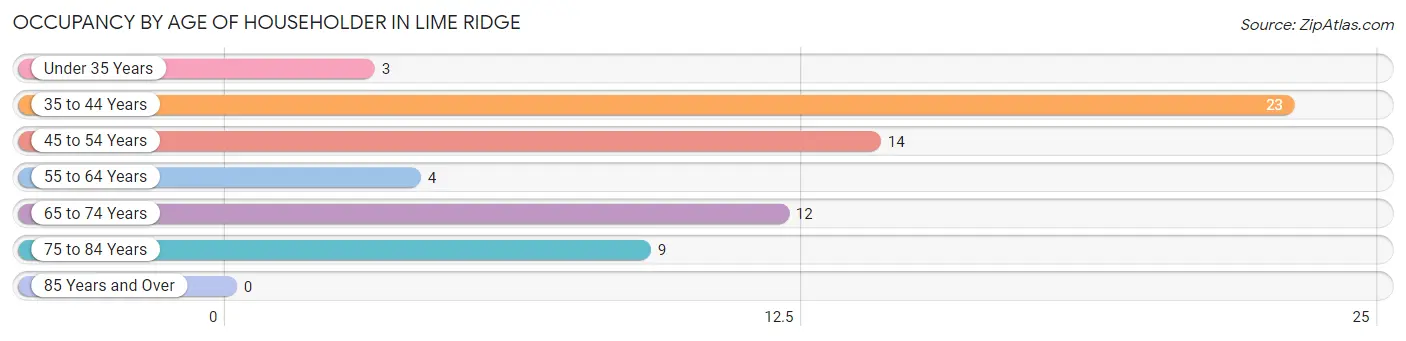
| Age Bracket | # Households | % Households |
| Under 35 Years | 3 | 4.6% |
| 35 to 44 Years | 23 | 35.4% |
| 45 to 54 Years | 14 | 21.5% |
| 55 to 64 Years | 4 | 6.1% |
| 65 to 74 Years | 12 | 18.5% |
| 75 to 84 Years | 9 | 13.9% |
| 85 Years and Over | 0 | 0.0% |
| Total | 65 | 100.0% |
Housing Finances in Lime Ridge
Median Income by Occupancy in Lime Ridge
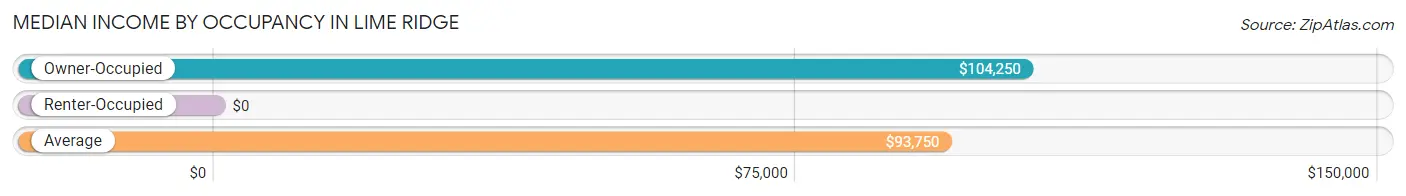
| Occupancy Type | # Households | Median Income |
| Owner-Occupied | 53 (81.5%) | $104,250 |
| Renter-Occupied | 12 (18.5%) | $0 |
| Average | 65 (100.0%) | $93,750 |
Occupancy by Householder Income Bracket in Lime Ridge
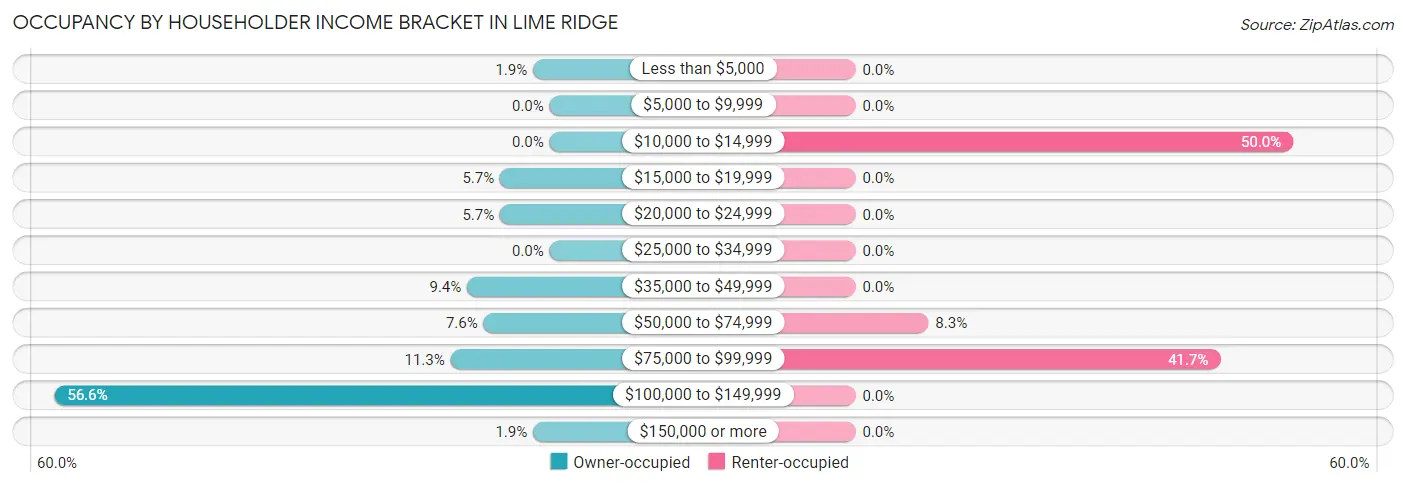
| Income Bracket | Owner-occupied | Renter-occupied |
| Less than $5,000 | 1 (1.9%) | 0 (0.0%) |
| $5,000 to $9,999 | 0 (0.0%) | 0 (0.0%) |
| $10,000 to $14,999 | 0 (0.0%) | 6 (50.0%) |
| $15,000 to $19,999 | 3 (5.7%) | 0 (0.0%) |
| $20,000 to $24,999 | 3 (5.7%) | 0 (0.0%) |
| $25,000 to $34,999 | 0 (0.0%) | 0 (0.0%) |
| $35,000 to $49,999 | 5 (9.4%) | 0 (0.0%) |
| $50,000 to $74,999 | 4 (7.5%) | 1 (8.3%) |
| $75,000 to $99,999 | 6 (11.3%) | 5 (41.7%) |
| $100,000 to $149,999 | 30 (56.6%) | 0 (0.0%) |
| $150,000 or more | 1 (1.9%) | 0 (0.0%) |
| Total | 53 (100.0%) | 12 (100.0%) |
Monthly Housing Cost Tiers in Lime Ridge
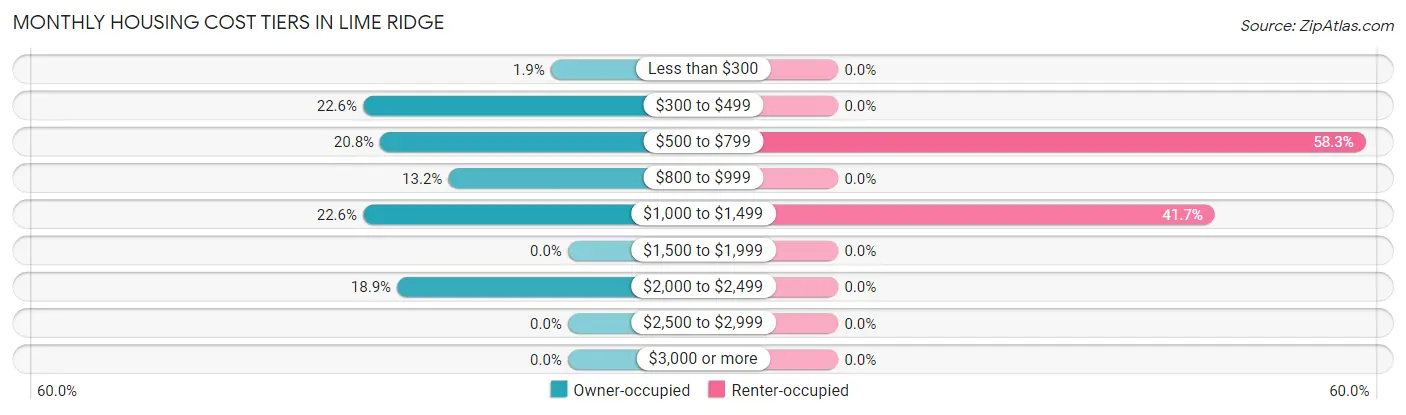
| Monthly Cost | Owner-occupied | Renter-occupied |
| Less than $300 | 1 (1.9%) | 0 (0.0%) |
| $300 to $499 | 12 (22.6%) | 0 (0.0%) |
| $500 to $799 | 11 (20.7%) | 7 (58.3%) |
| $800 to $999 | 7 (13.2%) | 0 (0.0%) |
| $1,000 to $1,499 | 12 (22.6%) | 5 (41.7%) |
| $1,500 to $1,999 | 0 (0.0%) | 0 (0.0%) |
| $2,000 to $2,499 | 10 (18.9%) | 0 (0.0%) |
| $2,500 to $2,999 | 0 (0.0%) | 0 (0.0%) |
| $3,000 or more | 0 (0.0%) | 0 (0.0%) |
| Total | 53 (100.0%) | 12 (100.0%) |
Physical Housing Characteristics in Lime Ridge
Housing Structures in Lime Ridge
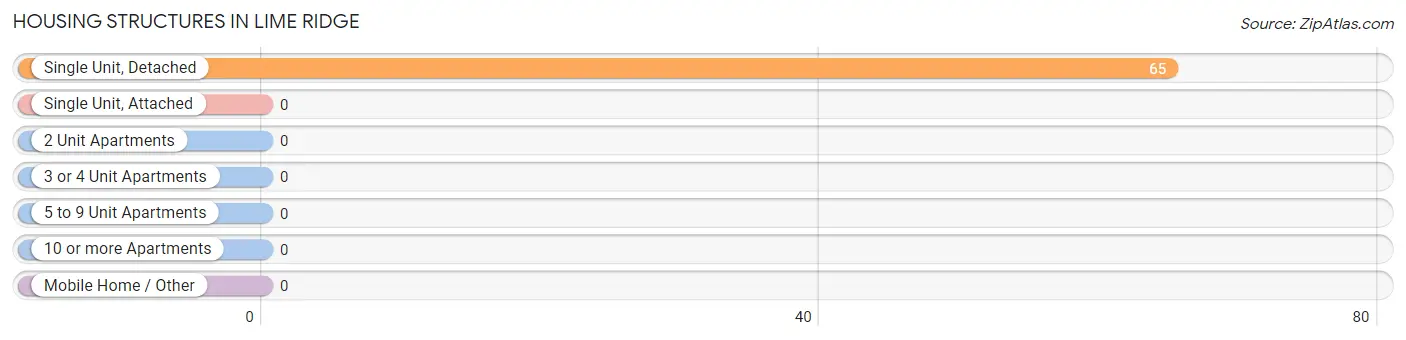
| Structure Type | # Housing Units | % Housing Units |
| Single Unit, Detached | 65 | 100.0% |
| Single Unit, Attached | 0 | 0.0% |
| 2 Unit Apartments | 0 | 0.0% |
| 3 or 4 Unit Apartments | 0 | 0.0% |
| 5 to 9 Unit Apartments | 0 | 0.0% |
| 10 or more Apartments | 0 | 0.0% |
| Mobile Home / Other | 0 | 0.0% |
| Total | 65 | 100.0% |
Housing Structures by Occupancy in Lime Ridge
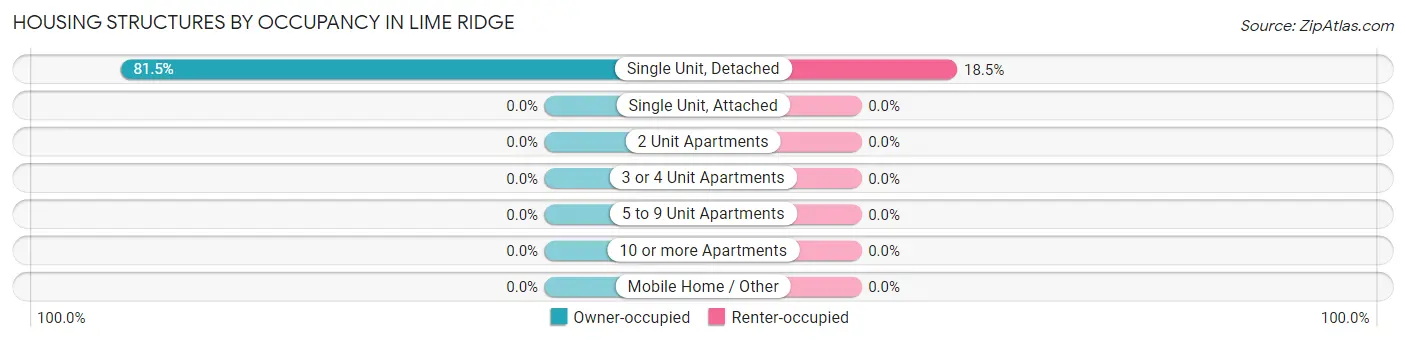
| Structure Type | Owner-occupied | Renter-occupied |
| Single Unit, Detached | 53 (81.5%) | 12 (18.5%) |
| Single Unit, Attached | 0 (0.0%) | 0 (0.0%) |
| 2 Unit Apartments | 0 (0.0%) | 0 (0.0%) |
| 3 or 4 Unit Apartments | 0 (0.0%) | 0 (0.0%) |
| 5 to 9 Unit Apartments | 0 (0.0%) | 0 (0.0%) |
| 10 or more Apartments | 0 (0.0%) | 0 (0.0%) |
| Mobile Home / Other | 0 (0.0%) | 0 (0.0%) |
| Total | 53 (81.5%) | 12 (18.5%) |
Housing Structures by Number of Rooms in Lime Ridge
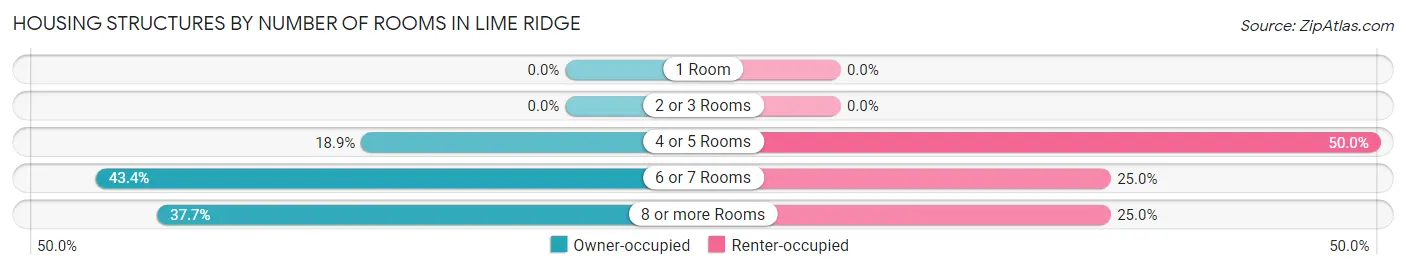
| Number of Rooms | Owner-occupied | Renter-occupied |
| 1 Room | 0 (0.0%) | 0 (0.0%) |
| 2 or 3 Rooms | 0 (0.0%) | 0 (0.0%) |
| 4 or 5 Rooms | 10 (18.9%) | 6 (50.0%) |
| 6 or 7 Rooms | 23 (43.4%) | 3 (25.0%) |
| 8 or more Rooms | 20 (37.7%) | 3 (25.0%) |
| Total | 53 (100.0%) | 12 (100.0%) |
Housing Structure by Heating Type in Lime Ridge
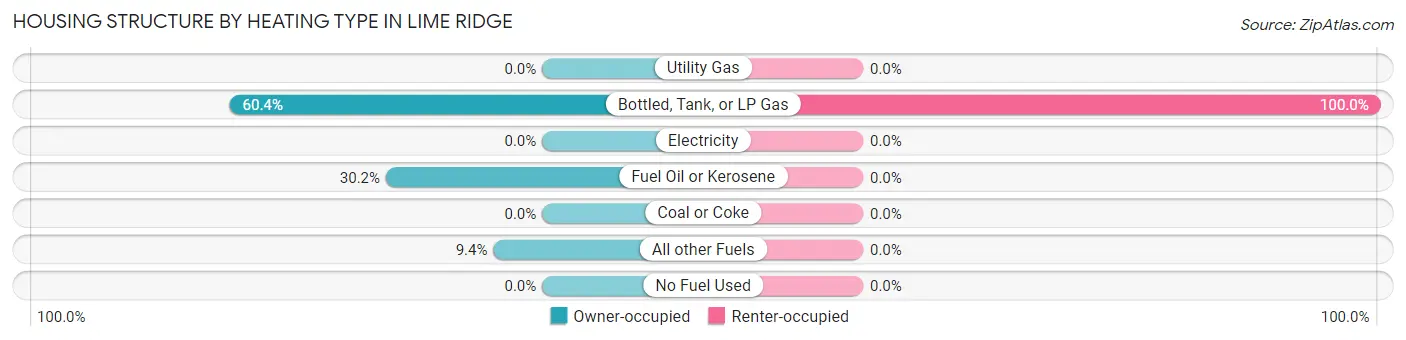
| Heating Type | Owner-occupied | Renter-occupied |
| Utility Gas | 0 (0.0%) | 0 (0.0%) |
| Bottled, Tank, or LP Gas | 32 (60.4%) | 12 (100.0%) |
| Electricity | 0 (0.0%) | 0 (0.0%) |
| Fuel Oil or Kerosene | 16 (30.2%) | 0 (0.0%) |
| Coal or Coke | 0 (0.0%) | 0 (0.0%) |
| All other Fuels | 5 (9.4%) | 0 (0.0%) |
| No Fuel Used | 0 (0.0%) | 0 (0.0%) |
| Total | 53 (100.0%) | 12 (100.0%) |
Household Vehicle Usage in Lime Ridge
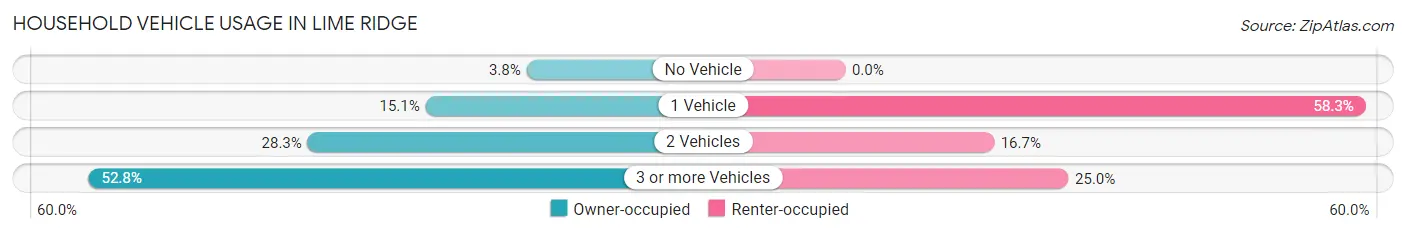
| Vehicles per Household | Owner-occupied | Renter-occupied |
| No Vehicle | 2 (3.8%) | 0 (0.0%) |
| 1 Vehicle | 8 (15.1%) | 7 (58.3%) |
| 2 Vehicles | 15 (28.3%) | 2 (16.7%) |
| 3 or more Vehicles | 28 (52.8%) | 3 (25.0%) |
| Total | 53 (100.0%) | 12 (100.0%) |
Real Estate & Mortgages in Lime Ridge
Real Estate and Mortgage Overview in Lime Ridge
| Characteristic | Without Mortgage | With Mortgage |
| Housing Units | 20 | 33 |
| Median Property Value | $90,000 | $137,500 |
| Median Household Income | $47,500 | $1 |
| Monthly Housing Costs | $467 | $0 |
| Real Estate Taxes | $1,393 | $0 |
Property Value by Mortgage Status in Lime Ridge
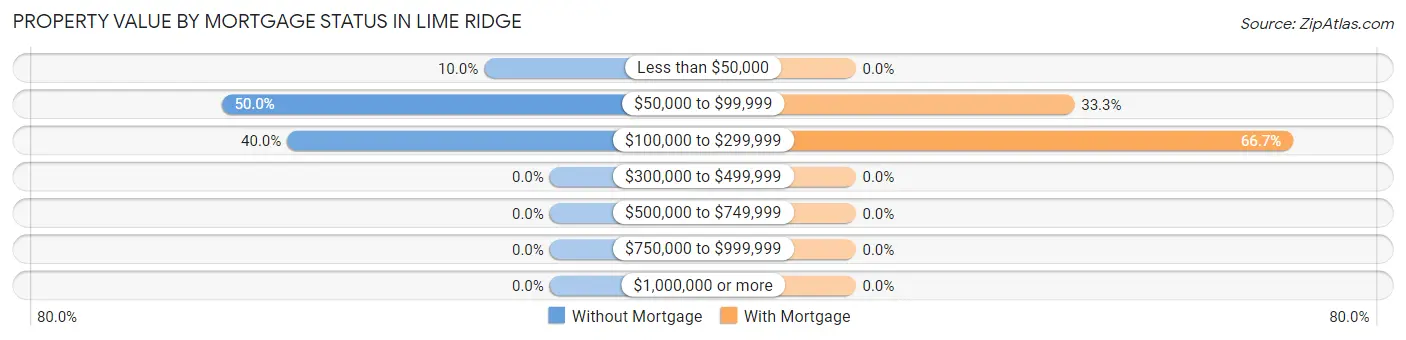
| Property Value | Without Mortgage | With Mortgage |
| Less than $50,000 | 2 (10.0%) | 0 (0.0%) |
| $50,000 to $99,999 | 10 (50.0%) | 11 (33.3%) |
| $100,000 to $299,999 | 8 (40.0%) | 22 (66.7%) |
| $300,000 to $499,999 | 0 (0.0%) | 0 (0.0%) |
| $500,000 to $749,999 | 0 (0.0%) | 0 (0.0%) |
| $750,000 to $999,999 | 0 (0.0%) | 0 (0.0%) |
| $1,000,000 or more | 0 (0.0%) | 0 (0.0%) |
| Total | 20 (100.0%) | 33 (100.0%) |
Household Income by Mortgage Status in Lime Ridge
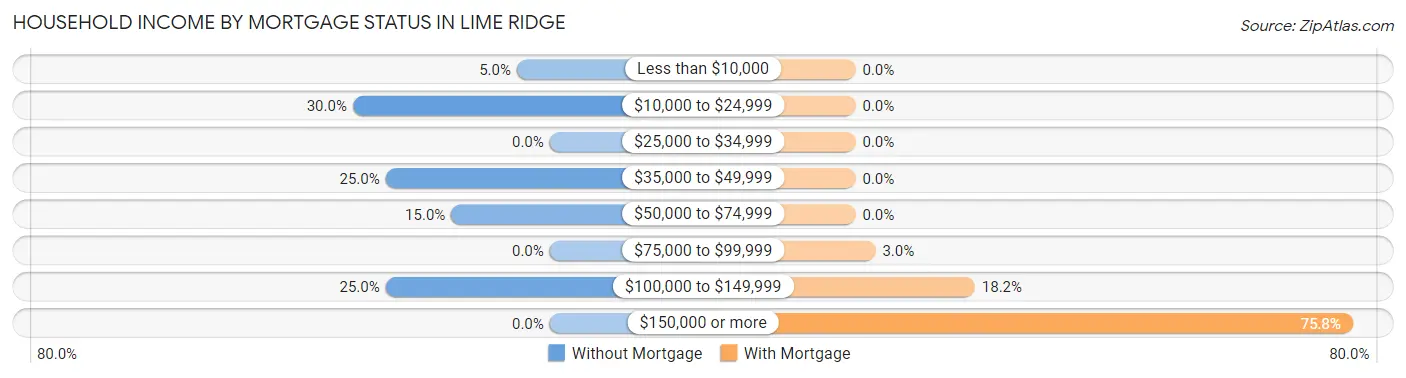
| Household Income | Without Mortgage | With Mortgage |
| Less than $10,000 | 1 (5.0%) | 0 (0.0%) |
| $10,000 to $24,999 | 6 (30.0%) | 0 (0.0%) |
| $25,000 to $34,999 | 0 (0.0%) | 0 (0.0%) |
| $35,000 to $49,999 | 5 (25.0%) | 0 (0.0%) |
| $50,000 to $74,999 | 3 (15.0%) | 0 (0.0%) |
| $75,000 to $99,999 | 0 (0.0%) | 1 (3.0%) |
| $100,000 to $149,999 | 5 (25.0%) | 6 (18.2%) |
| $150,000 or more | 0 (0.0%) | 25 (75.8%) |
| Total | 20 (100.0%) | 33 (100.0%) |
Property Value to Household Income Ratio in Lime Ridge
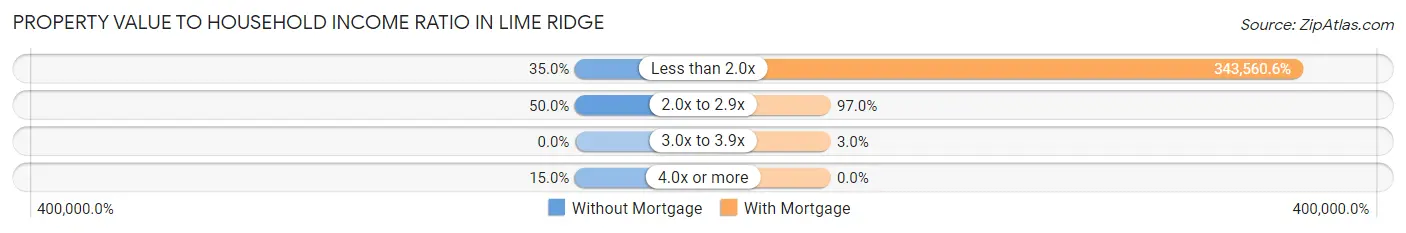
| Value-to-Income Ratio | Without Mortgage | With Mortgage |
| Less than 2.0x | 7 (35.0%) | 113,375 (343,560.6%) |
| 2.0x to 2.9x | 10 (50.0%) | 32 (97.0%) |
| 3.0x to 3.9x | 0 (0.0%) | 1 (3.0%) |
| 4.0x or more | 3 (15.0%) | 0 (0.0%) |
| Total | 20 (100.0%) | 33 (100.0%) |
Real Estate Taxes by Mortgage Status in Lime Ridge
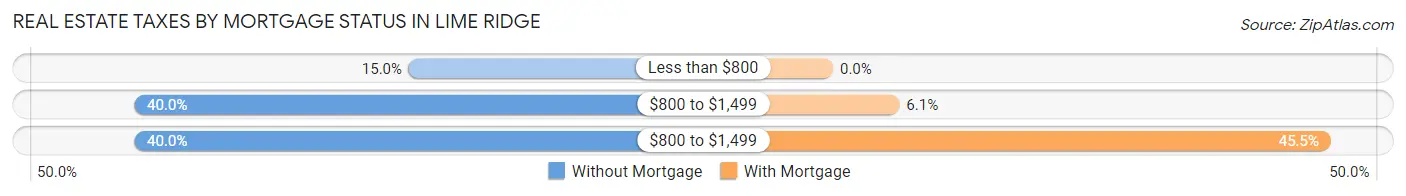
| Property Taxes | Without Mortgage | With Mortgage |
| Less than $800 | 3 (15.0%) | 0 (0.0%) |
| $800 to $1,499 | 8 (40.0%) | 2 (6.1%) |
| $800 to $1,499 | 8 (40.0%) | 15 (45.5%) |
| Total | 20 (100.0%) | 33 (100.0%) |
Health & Disability in Lime Ridge
Health Insurance Coverage by Age in Lime Ridge
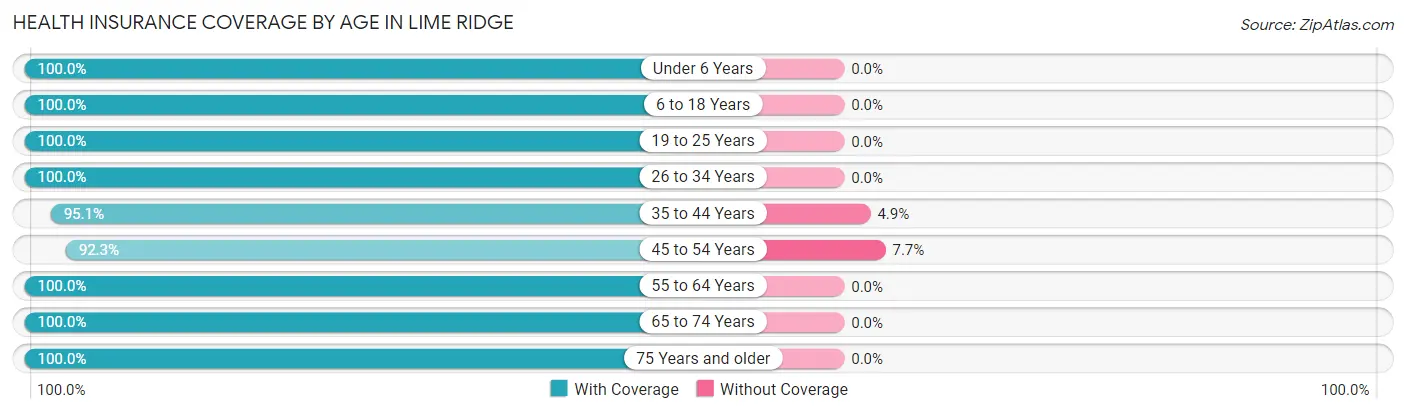
| Age Bracket | With Coverage | Without Coverage |
| Under 6 Years | 2 (100.0%) | 0 (0.0%) |
| 6 to 18 Years | 38 (100.0%) | 0 (0.0%) |
| 19 to 25 Years | 20 (100.0%) | 0 (0.0%) |
| 26 to 34 Years | 5 (100.0%) | 0 (0.0%) |
| 35 to 44 Years | 39 (95.1%) | 2 (4.9%) |
| 45 to 54 Years | 36 (92.3%) | 3 (7.7%) |
| 55 to 64 Years | 9 (100.0%) | 0 (0.0%) |
| 65 to 74 Years | 14 (100.0%) | 0 (0.0%) |
| 75 Years and older | 18 (100.0%) | 0 (0.0%) |
| Total | 181 (97.3%) | 5 (2.7%) |
Health Insurance Coverage by Citizenship Status in Lime Ridge
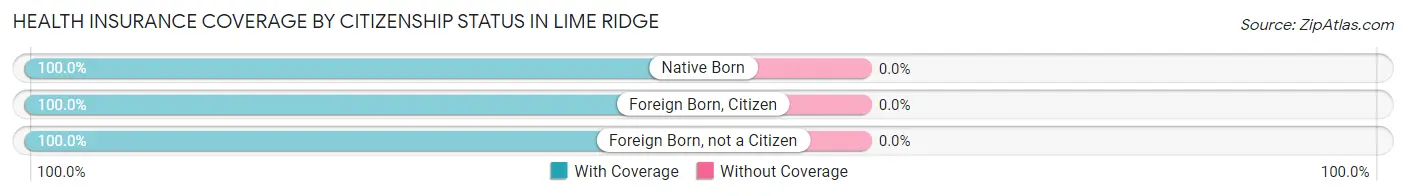
| Citizenship Status | With Coverage | Without Coverage |
| Native Born | 2 (100.0%) | 0 (0.0%) |
| Foreign Born, Citizen | 38 (100.0%) | 0 (0.0%) |
| Foreign Born, not a Citizen | 20 (100.0%) | 0 (0.0%) |
Health Insurance Coverage by Household Income in Lime Ridge
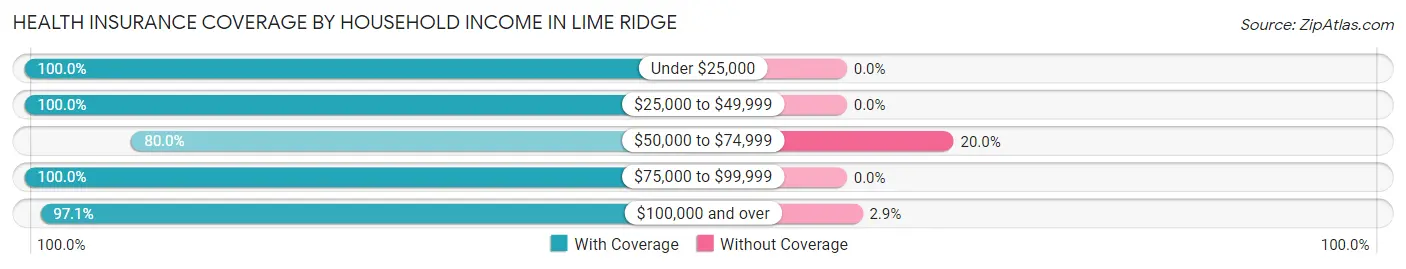
| Household Income | With Coverage | Without Coverage |
| Under $25,000 | 17 (100.0%) | 0 (0.0%) |
| $25,000 to $49,999 | 12 (100.0%) | 0 (0.0%) |
| $50,000 to $74,999 | 8 (80.0%) | 2 (20.0%) |
| $75,000 to $99,999 | 45 (100.0%) | 0 (0.0%) |
| $100,000 and over | 99 (97.1%) | 3 (2.9%) |
Public vs Private Health Insurance Coverage by Age in Lime Ridge
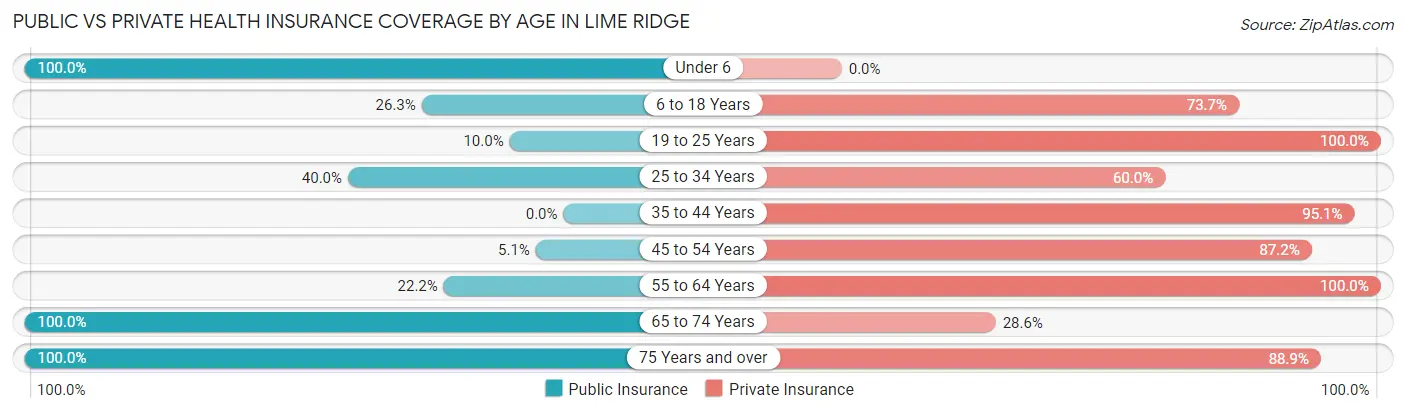
| Age Bracket | Public Insurance | Private Insurance |
| Under 6 | 2 (100.0%) | 0 (0.0%) |
| 6 to 18 Years | 10 (26.3%) | 28 (73.7%) |
| 19 to 25 Years | 2 (10.0%) | 20 (100.0%) |
| 25 to 34 Years | 2 (40.0%) | 3 (60.0%) |
| 35 to 44 Years | 0 (0.0%) | 39 (95.1%) |
| 45 to 54 Years | 2 (5.1%) | 34 (87.2%) |
| 55 to 64 Years | 2 (22.2%) | 9 (100.0%) |
| 65 to 74 Years | 14 (100.0%) | 4 (28.6%) |
| 75 Years and over | 18 (100.0%) | 16 (88.9%) |
| Total | 52 (28.0%) | 153 (82.3%) |
Disability Status by Sex by Age in Lime Ridge
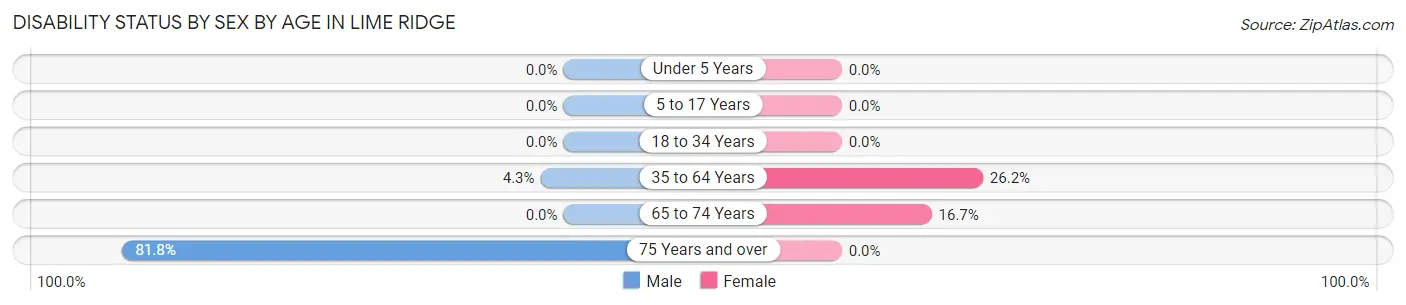
| Age Bracket | Male | Female |
| Under 5 Years | 0 (0.0%) | 0 (0.0%) |
| 5 to 17 Years | 0 (0.0%) | 0 (0.0%) |
| 18 to 34 Years | 0 (0.0%) | 0 (0.0%) |
| 35 to 64 Years | 2 (4.3%) | 11 (26.2%) |
| 65 to 74 Years | 0 (0.0%) | 1 (16.7%) |
| 75 Years and over | 9 (81.8%) | 0 (0.0%) |
Disability Class by Sex by Age in Lime Ridge
Disability Class: Hearing Difficulty
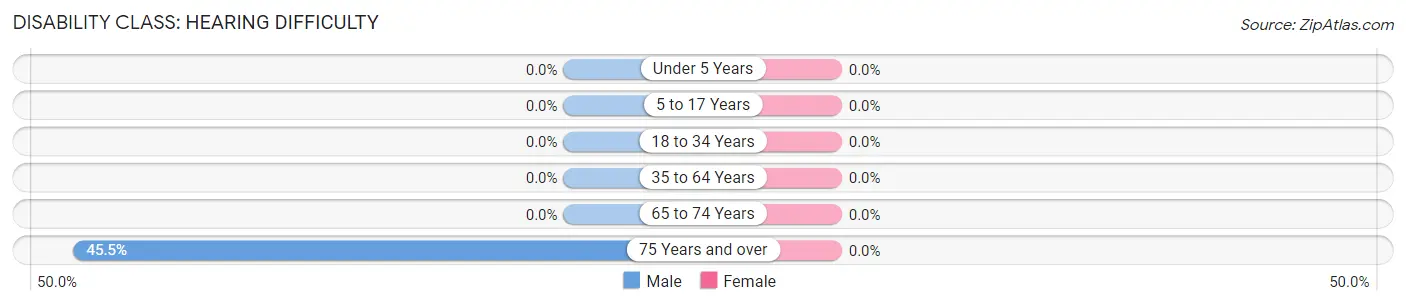
| Age Bracket | Male | Female |
| Under 5 Years | 0 (0.0%) | 0 (0.0%) |
| 5 to 17 Years | 0 (0.0%) | 0 (0.0%) |
| 18 to 34 Years | 0 (0.0%) | 0 (0.0%) |
| 35 to 64 Years | 0 (0.0%) | 0 (0.0%) |
| 65 to 74 Years | 0 (0.0%) | 0 (0.0%) |
| 75 Years and over | 5 (45.5%) | 0 (0.0%) |
Disability Class: Vision Difficulty
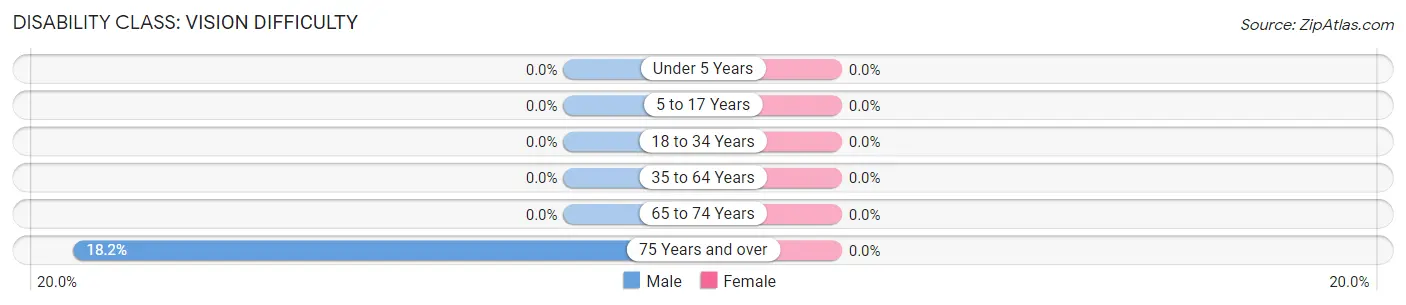
| Age Bracket | Male | Female |
| Under 5 Years | 0 (0.0%) | 0 (0.0%) |
| 5 to 17 Years | 0 (0.0%) | 0 (0.0%) |
| 18 to 34 Years | 0 (0.0%) | 0 (0.0%) |
| 35 to 64 Years | 0 (0.0%) | 0 (0.0%) |
| 65 to 74 Years | 0 (0.0%) | 0 (0.0%) |
| 75 Years and over | 2 (18.2%) | 0 (0.0%) |
Disability Class: Cognitive Difficulty
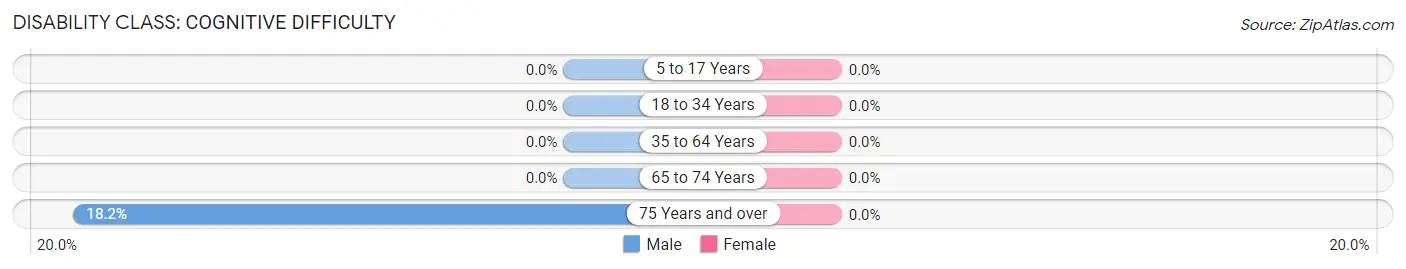
| Age Bracket | Male | Female |
| 5 to 17 Years | 0 (0.0%) | 0 (0.0%) |
| 18 to 34 Years | 0 (0.0%) | 0 (0.0%) |
| 35 to 64 Years | 0 (0.0%) | 0 (0.0%) |
| 65 to 74 Years | 0 (0.0%) | 0 (0.0%) |
| 75 Years and over | 2 (18.2%) | 0 (0.0%) |
Disability Class: Ambulatory Difficulty
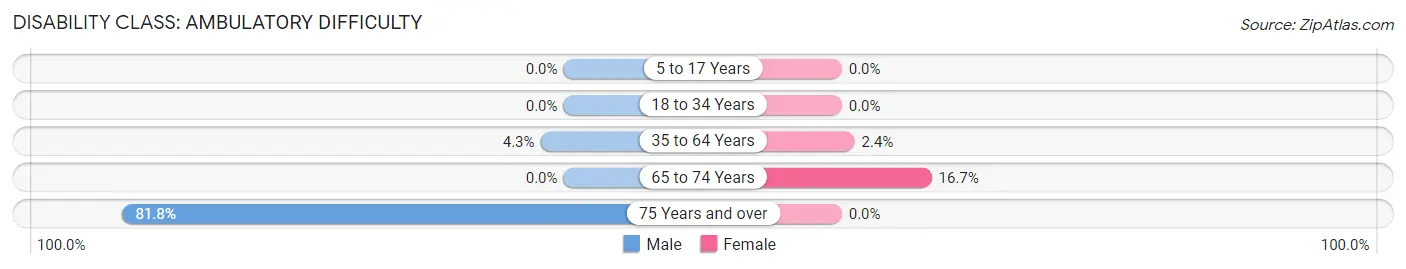
| Age Bracket | Male | Female |
| 5 to 17 Years | 0 (0.0%) | 0 (0.0%) |
| 18 to 34 Years | 0 (0.0%) | 0 (0.0%) |
| 35 to 64 Years | 2 (4.3%) | 1 (2.4%) |
| 65 to 74 Years | 0 (0.0%) | 1 (16.7%) |
| 75 Years and over | 9 (81.8%) | 0 (0.0%) |
Disability Class: Self-Care Difficulty

| Age Bracket | Male | Female |
| 5 to 17 Years | 0 (0.0%) | 0 (0.0%) |
| 18 to 34 Years | 0 (0.0%) | 0 (0.0%) |
| 35 to 64 Years | 0 (0.0%) | 0 (0.0%) |
| 65 to 74 Years | 0 (0.0%) | 0 (0.0%) |
| 75 Years and over | 4 (36.4%) | 0 (0.0%) |
Technology Access in Lime Ridge
Computing Device Access in Lime Ridge
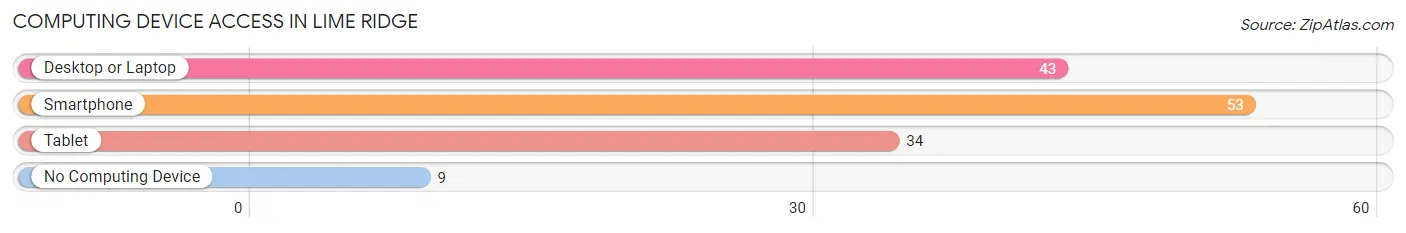
| Device Type | # Households | % Households |
| Desktop or Laptop | 43 | 66.1% |
| Smartphone | 53 | 81.5% |
| Tablet | 34 | 52.3% |
| No Computing Device | 9 | 13.9% |
| Total | 65 | 100.0% |
Internet Access in Lime Ridge
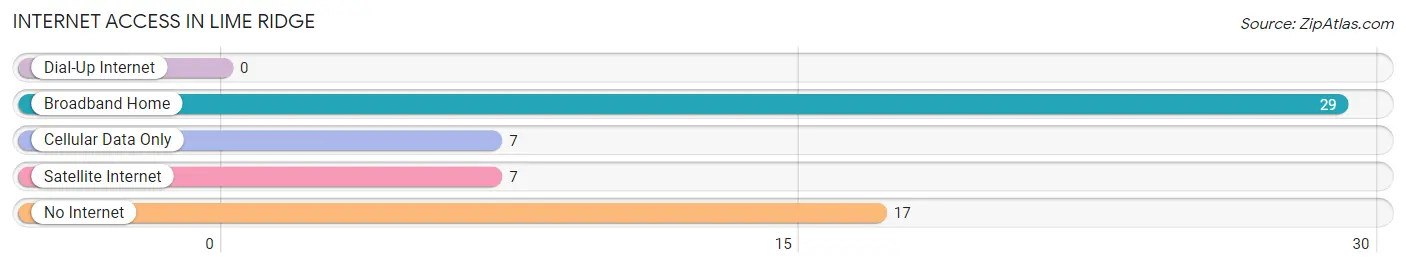
| Internet Type | # Households | % Households |
| Dial-Up Internet | 0 | 0.0% |
| Broadband Home | 29 | 44.6% |
| Cellular Data Only | 7 | 10.8% |
| Satellite Internet | 7 | 10.8% |
| No Internet | 17 | 26.2% |
| Total | 65 | 100.0% |
Lime Ridge Summary
Lime Ridge is a small unincorporated community located in Sauk County, Wisconsin, United States. It is situated in the Baraboo Range, a range of hills in south-central Wisconsin. The community is located along the Baraboo River, which flows through the area. The population of Lime Ridge was estimated to be around 200 people in 2000.
History
The area that is now Lime Ridge was first settled in the early 1800s by settlers from New England. The first settlers were primarily farmers, and the area was known as the “Lime Ridge Settlement”. The settlement was named after the abundance of limestone in the area, which was used to make lime for agricultural purposes.
In 1845, the first post office was established in the area, and the name was changed to “Lime Ridge”. The post office was located in a small store owned by the first postmaster, John B. Smith.
In 1848, the first school was built in the area. The school was a one-room log cabin, and it served the community until 1876, when a larger school was built.
In 1876, the first church was built in the area. The church was a Methodist Episcopal Church, and it served the community until it was destroyed by a tornado in 1883.
In 1883, the first railroad line was built in the area. The railroad line connected Lime Ridge to the nearby towns of Baraboo and Reedsburg.
In the late 1800s, the area began to experience a population boom. This was due to the abundance of limestone in the area, which was used to make lime for agricultural purposes. The population of Lime Ridge peaked in the early 1900s, with a population of around 500 people.
Geography
Lime Ridge is located in Sauk County, Wisconsin, in the Baraboo Range. The Baraboo Range is a range of hills in south-central Wisconsin. The community is located along the Baraboo River, which flows through the area.
The area is mostly rural, with rolling hills and farmland. The area is known for its abundance of limestone, which is used to make lime for agricultural purposes.
Economy
The economy of Lime Ridge is primarily based on agriculture. The area is known for its abundance of limestone, which is used to make lime for agricultural purposes. The area is also known for its dairy farms, which produce milk, cheese, and other dairy products.
In addition to agriculture, the area is also home to several small businesses, including a general store, a gas station, and a few restaurants.
Demographics
The population of Lime Ridge was estimated to be around 200 people in 2000. The population is primarily white, with a small percentage of African Americans and Native Americans. The median household income in the area is around $40,000. The median age in the area is around 40 years old.
Common Questions
What is Per Capita Income in Lime Ridge?
Per Capita income in Lime Ridge is $34,540.
What is the Median Family Income in Lime Ridge?
Median Family Income in Lime Ridge is $104,750.
What is the Median Household income in Lime Ridge?
Median Household Income in Lime Ridge is $93,750.
What is Income or Wage Gap in Lime Ridge?
Income or Wage Gap in Lime Ridge is 42.0%.
Women in Lime Ridge earn 58.0 cents for every dollar earned by a man.
What is Inequality or Gini Index in Lime Ridge?
Inequality or Gini Index in Lime Ridge is 0.31.
What is the Total Population of Lime Ridge?
Total Population of Lime Ridge is 186.
What is the Total Male Population of Lime Ridge?
Total Male Population of Lime Ridge is 96.
What is the Total Female Population of Lime Ridge?
Total Female Population of Lime Ridge is 90.
What is the Ratio of Males per 100 Females in Lime Ridge?
There are 106.67 Males per 100 Females in Lime Ridge.
What is the Ratio of Females per 100 Males in Lime Ridge?
There are 93.75 Females per 100 Males in Lime Ridge.
What is the Median Population Age in Lime Ridge?
Median Population Age in Lime Ridge is 42.8 Years.
What is the Average Family Size in Lime Ridge
Average Family Size in Lime Ridge is 3.3 People.
What is the Average Household Size in Lime Ridge
Average Household Size in Lime Ridge is 2.9 People.
How Large is the Labor Force in Lime Ridge?
There are 102 People in the Labor Forcein in Lime Ridge.
What is the Percentage of People in the Labor Force in Lime Ridge?
68.0% of People are in the Labor Force in Lime Ridge.