Stratford, WI Map & Demographics
Stratford Map
Stratford Overview
$41,274
PER CAPITA INCOME
$83,889
AVG FAMILY INCOME
$63,646
AVG HOUSEHOLD INCOME
18.4%
WAGE / INCOME GAP [ % ]
81.6¢/ $1
WAGE / INCOME GAP [ $ ]
0.46
INEQUALITY / GINI INDEX
1,364
TOTAL POPULATION
689
MALE POPULATION
675
FEMALE POPULATION
102.07
MALES / 100 FEMALES
97.97
FEMALES / 100 MALES
44.3
MEDIAN AGE
2.6
AVG FAMILY SIZE
2.1
AVG HOUSEHOLD SIZE
834
LABOR FORCE [ PEOPLE ]
75.1%
PERCENT IN LABOR FORCE
1.8%
UNEMPLOYMENT RATE
Stratford Zip Codes
Stratford Area Codes
Income in Stratford
Income Overview in Stratford
Per Capita Income in Stratford is $41,274, while median incomes of families and households are $83,889 and $63,646 respectively.
| Characteristic | Number | Measure |
| Per Capita Income | 1,364 | $41,274 |
| Median Family Income | 388 | $83,889 |
| Mean Family Income | 388 | $92,438 |
| Median Household Income | 626 | $63,646 |
| Mean Household Income | 626 | $89,851 |
| Income Deficit | 388 | $0 |
| Wage / Income Gap (%) | 1,364 | 18.44% |
| Wage / Income Gap ($) | 1,364 | 81.56¢ per $1 |
| Gini / Inequality Index | 1,364 | 0.46 |
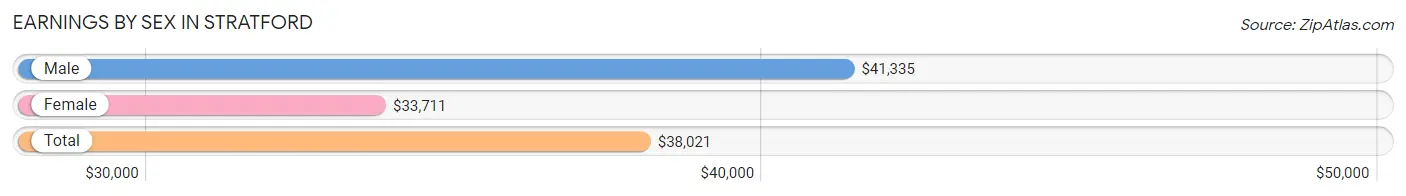
Earnings by Sex in Stratford
Average Earnings in Stratford are $38,021, $41,335 for men and $33,711 for women, a difference of 18.4%.
| Sex | Number | Average Earnings |
| Male | 483 (55.6%) | $41,335 |
| Female | 385 (44.4%) | $33,711 |
| Total | 868 (100.0%) | $38,021 |
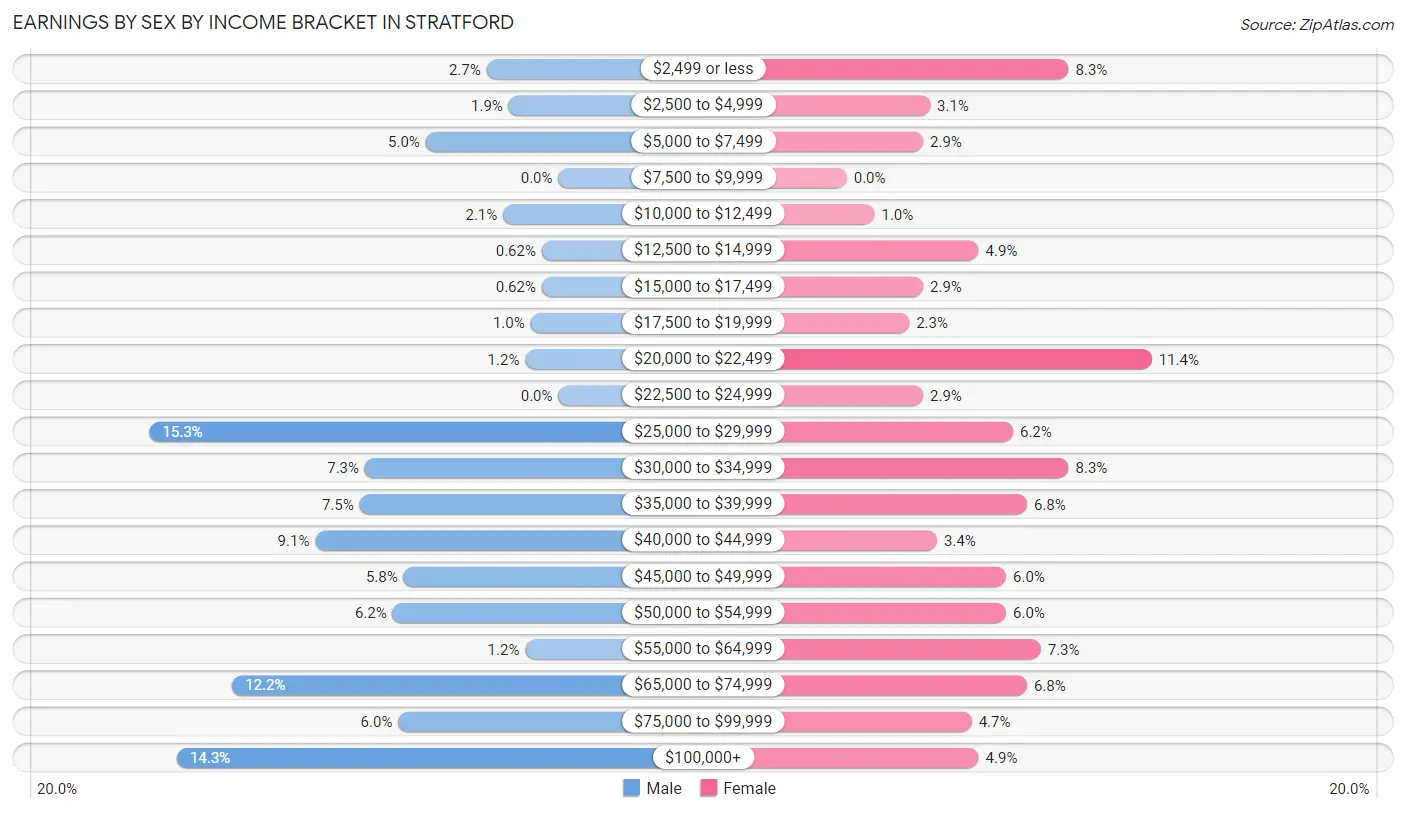
Earnings by Sex by Income Bracket in Stratford
The most common earnings brackets in Stratford are $25,000 to $29,999 for men (74 | 15.3%) and $20,000 to $22,499 for women (44 | 11.4%).
| Income | Male | Female |
| $2,499 or less | 13 (2.7%) | 32 (8.3%) |
| $2,500 to $4,999 | 9 (1.9%) | 12 (3.1%) |
| $5,000 to $7,499 | 24 (5.0%) | 11 (2.9%) |
| $7,500 to $9,999 | 0 (0.0%) | 0 (0.0%) |
| $10,000 to $12,499 | 10 (2.1%) | 4 (1.0%) |
| $12,500 to $14,999 | 3 (0.6%) | 19 (4.9%) |
| $15,000 to $17,499 | 3 (0.6%) | 11 (2.9%) |
| $17,500 to $19,999 | 5 (1.0%) | 9 (2.3%) |
| $20,000 to $22,499 | 6 (1.2%) | 44 (11.4%) |
| $22,500 to $24,999 | 0 (0.0%) | 11 (2.9%) |
| $25,000 to $29,999 | 74 (15.3%) | 24 (6.2%) |
| $30,000 to $34,999 | 35 (7.2%) | 32 (8.3%) |
| $35,000 to $39,999 | 36 (7.4%) | 26 (6.8%) |
| $40,000 to $44,999 | 44 (9.1%) | 13 (3.4%) |
| $45,000 to $49,999 | 28 (5.8%) | 23 (6.0%) |
| $50,000 to $54,999 | 30 (6.2%) | 23 (6.0%) |
| $55,000 to $64,999 | 6 (1.2%) | 28 (7.3%) |
| $65,000 to $74,999 | 59 (12.2%) | 26 (6.8%) |
| $75,000 to $99,999 | 29 (6.0%) | 18 (4.7%) |
| $100,000+ | 69 (14.3%) | 19 (4.9%) |
| Total | 483 (100.0%) | 385 (100.0%) |
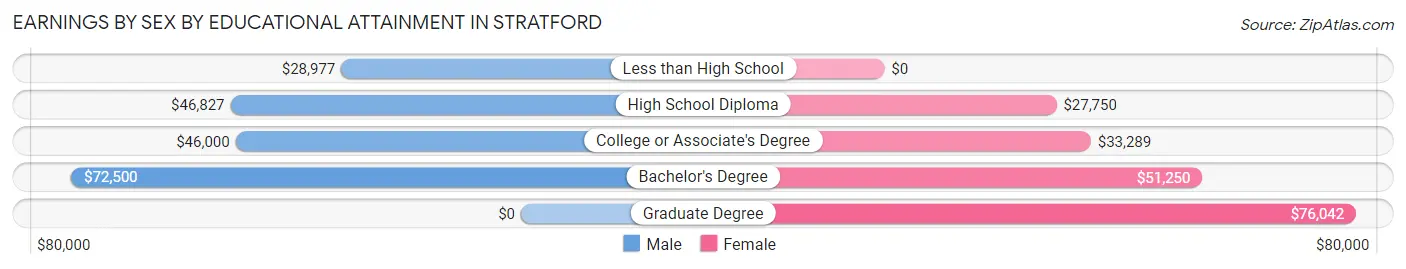
Earnings by Sex by Educational Attainment in Stratford
Average earnings in Stratford are $42,472 for men and $34,922 for women, a difference of 17.8%. Men with an educational attainment of bachelor's degree enjoy the highest average annual earnings of $72,500, while those with less than high school education earn the least with $28,977. Women with an educational attainment of graduate degree earn the most with the average annual earnings of $76,042, while those with high school diploma education have the smallest earnings of $27,750.
| Educational Attainment | Male Income | Female Income |
| Less than High School | $28,977 | $0 |
| High School Diploma | $46,827 | $27,750 |
| College or Associate's Degree | $46,000 | $33,289 |
| Bachelor's Degree | $72,500 | $51,250 |
| Graduate Degree | - | - |
| Total | $42,472 | $34,922 |
Family Income in Stratford
Family Income Brackets in Stratford
According to the Stratford family income data, there are 95 families falling into the $100,000 to $149,999 income range, which is the most common income bracket and makes up 24.5% of all families. Conversely, the $25,000 to $34,999 income bracket is the least frequent group with only 6 families (1.5%) belonging to this category.
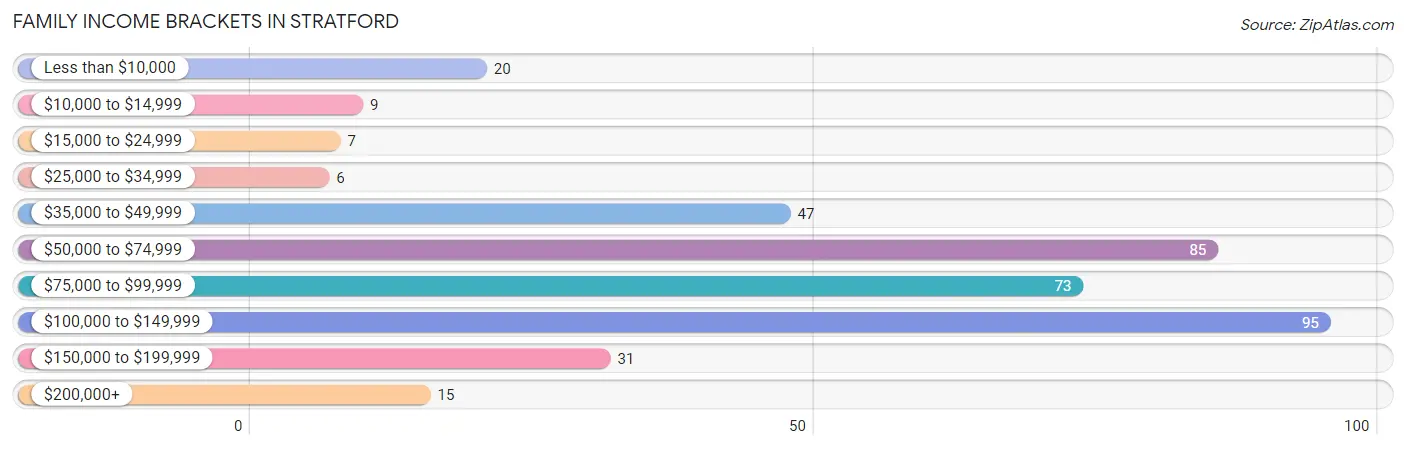
| Income Bracket | # Families | % Families |
| Less than $10,000 | 20 | 5.2% |
| $10,000 to $14,999 | 9 | 2.3% |
| $15,000 to $24,999 | 7 | 1.8% |
| $25,000 to $34,999 | 6 | 1.5% |
| $35,000 to $49,999 | 47 | 12.1% |
| $50,000 to $74,999 | 85 | 21.9% |
| $75,000 to $99,999 | 73 | 18.8% |
| $100,000 to $149,999 | 95 | 24.5% |
| $150,000 to $199,999 | 31 | 8.0% |
| $200,000+ | 15 | 3.9% |
Family Income by Famaliy Size in Stratford
4-person families (42 | 10.8%) account for the highest median family income in Stratford with $122,813 per family, while 2-person families (241 | 62.1%) have the highest median income of $34,844 per family member.
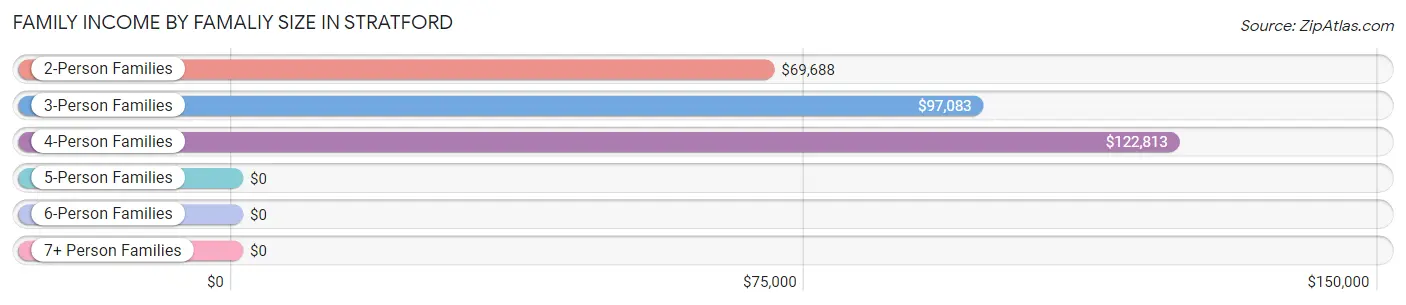
| Income Bracket | # Families | Median Income |
| 2-Person Families | 241 (62.1%) | $69,688 |
| 3-Person Families | 85 (21.9%) | $97,083 |
| 4-Person Families | 42 (10.8%) | $122,813 |
| 5-Person Families | 15 (3.9%) | $0 |
| 6-Person Families | 5 (1.3%) | $0 |
| 7+ Person Families | 0 (0.0%) | $0 |
| Total | 388 (100.0%) | $83,889 |
Family Income by Number of Earners in Stratford
The median family income in Stratford is $83,889, with families comprising 3+ earners (17) having the highest median family income of $140,417, while families with no earners (37) have the lowest median family income of $37,031, accounting for 4.4% and 9.5% of families, respectively.
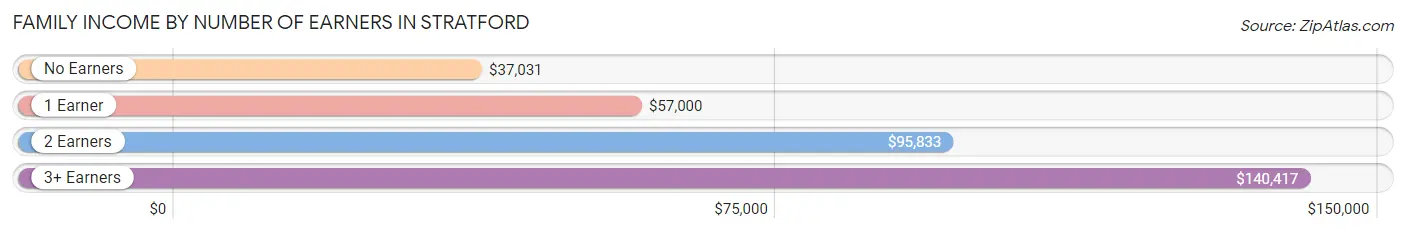
| Number of Earners | # Families | Median Income |
| No Earners | 37 (9.5%) | $37,031 |
| 1 Earner | 102 (26.3%) | $57,000 |
| 2 Earners | 232 (59.8%) | $95,833 |
| 3+ Earners | 17 (4.4%) | $140,417 |
| Total | 388 (100.0%) | $83,889 |
Household Income in Stratford
Household Income Brackets in Stratford
With 187 households falling in the category, the $50,000 to $74,999 income range is the most frequent in Stratford, accounting for 29.9% of all households. In contrast, only 28 households (4.5%) fall into the $25,000 to $34,999 income bracket, making it the least populous group.
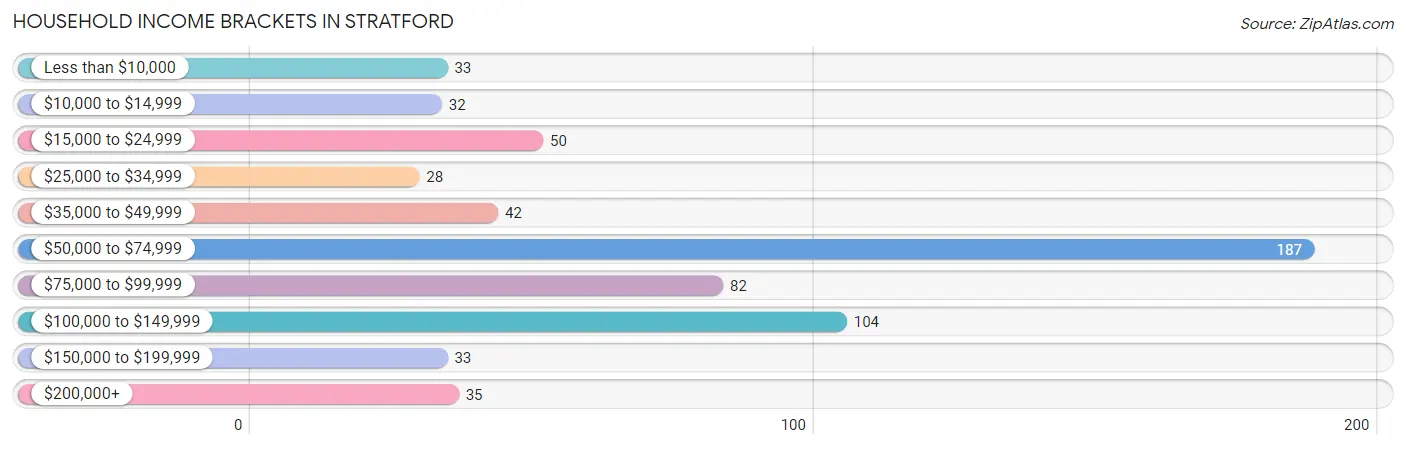
| Income Bracket | # Households | % Households |
| Less than $10,000 | 33 | 5.3% |
| $10,000 to $14,999 | 32 | 5.1% |
| $15,000 to $24,999 | 50 | 8.0% |
| $25,000 to $34,999 | 28 | 4.5% |
| $35,000 to $49,999 | 42 | 6.7% |
| $50,000 to $74,999 | 187 | 29.9% |
| $75,000 to $99,999 | 82 | 13.1% |
| $100,000 to $149,999 | 104 | 16.6% |
| $150,000 to $199,999 | 33 | 5.3% |
| $200,000+ | 35 | 5.6% |
Household Income by Householder Age in Stratford
The median household income in Stratford is $63,646, with the highest median household income of $70,357 found in the 45 to 64 years age bracket for the primary householder. A total of 272 households (43.4%) fall into this category. Meanwhile, the 15 to 24 years age bracket for the primary householder has the lowest median household income of $0, with 12 households (1.9%) in this group.
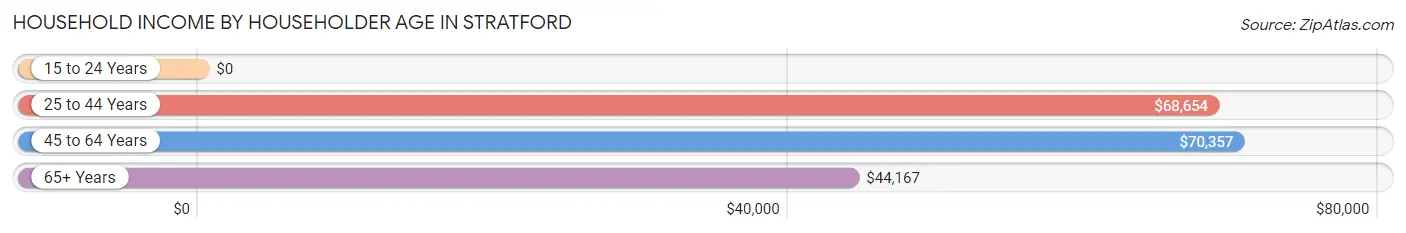
| Income Bracket | # Households | Median Income |
| 15 to 24 Years | 12 (1.9%) | $0 |
| 25 to 44 Years | 196 (31.3%) | $68,654 |
| 45 to 64 Years | 272 (43.4%) | $70,357 |
| 65+ Years | 146 (23.3%) | $44,167 |
| Total | 626 (100.0%) | $63,646 |
Poverty in Stratford
Income Below Poverty by Sex and Age in Stratford
With 9.6% poverty level for males and 16.3% for females among the residents of Stratford, 12 to 14 year old males and 18 to 24 year old females are the most vulnerable to poverty, with 14 males (37.8%) and 16 females (53.3%) in their respective age groups living below the poverty level.
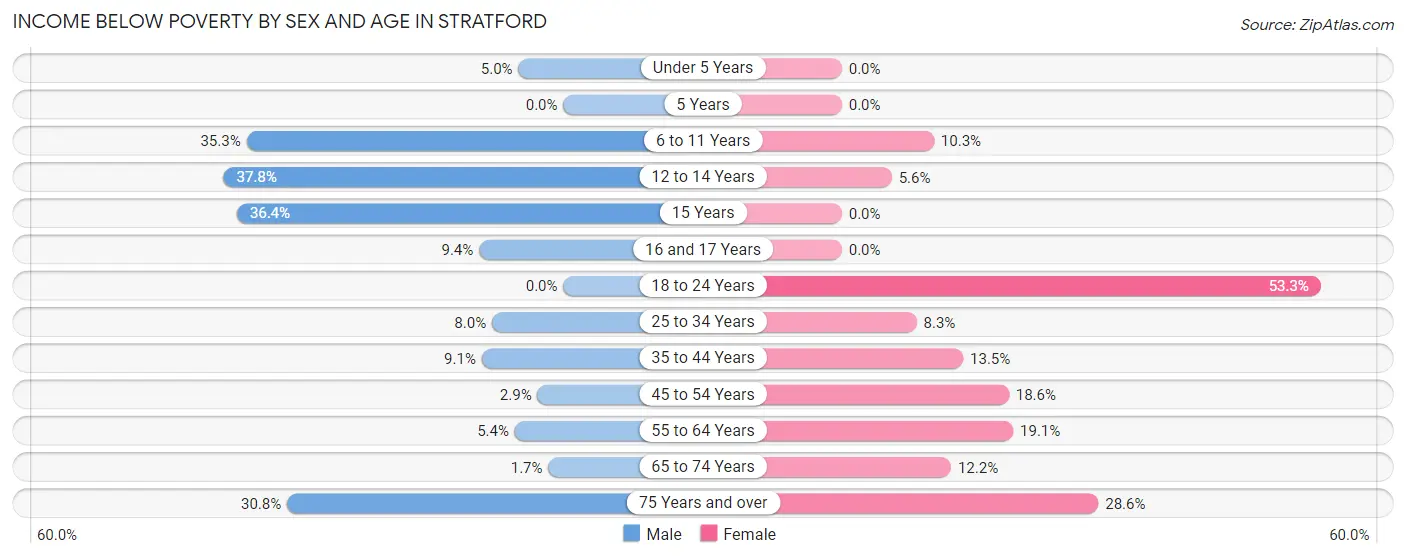
| Age Bracket | Male | Female |
| Under 5 Years | 3 (5.0%) | 0 (0.0%) |
| 5 Years | 0 (0.0%) | 0 (0.0%) |
| 6 to 11 Years | 6 (35.3%) | 4 (10.3%) |
| 12 to 14 Years | 14 (37.8%) | 2 (5.6%) |
| 15 Years | 4 (36.4%) | 0 (0.0%) |
| 16 and 17 Years | 3 (9.4%) | 0 (0.0%) |
| 18 to 24 Years | 0 (0.0%) | 16 (53.3%) |
| 25 to 34 Years | 7 (8.0%) | 5 (8.3%) |
| 35 to 44 Years | 11 (9.1%) | 10 (13.5%) |
| 45 to 54 Years | 3 (2.9%) | 16 (18.6%) |
| 55 to 64 Years | 6 (5.4%) | 29 (19.1%) |
| 65 to 74 Years | 1 (1.7%) | 9 (12.2%) |
| 75 Years and over | 8 (30.8%) | 18 (28.6%) |
| Total | 66 (9.6%) | 109 (16.3%) |
Income Above Poverty by Sex and Age in Stratford
According to the poverty statistics in Stratford, males aged 5 years and females aged under 5 years are the age groups that are most secure financially, with 100.0% of males and 100.0% of females in these age groups living above the poverty line.
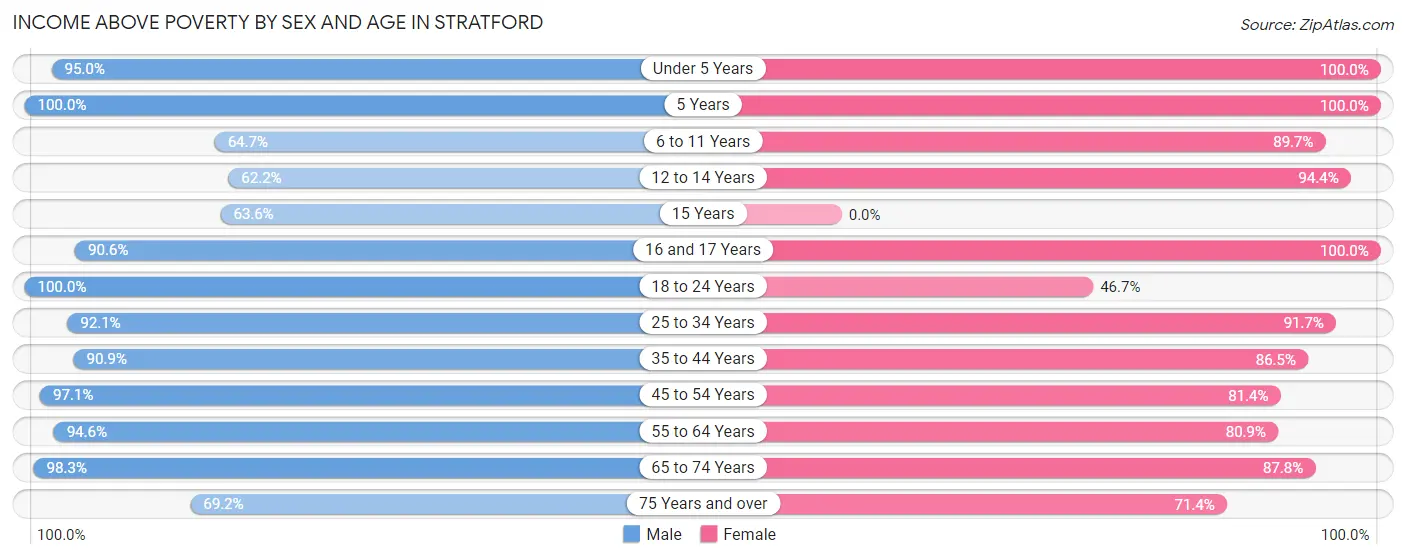
| Age Bracket | Male | Female |
| Under 5 Years | 57 (95.0%) | 34 (100.0%) |
| 5 Years | 3 (100.0%) | 5 (100.0%) |
| 6 to 11 Years | 11 (64.7%) | 35 (89.7%) |
| 12 to 14 Years | 23 (62.2%) | 34 (94.4%) |
| 15 Years | 7 (63.6%) | 0 (0.0%) |
| 16 and 17 Years | 29 (90.6%) | 14 (100.0%) |
| 18 to 24 Years | 15 (100.0%) | 14 (46.7%) |
| 25 to 34 Years | 81 (92.0%) | 55 (91.7%) |
| 35 to 44 Years | 110 (90.9%) | 64 (86.5%) |
| 45 to 54 Years | 101 (97.1%) | 70 (81.4%) |
| 55 to 64 Years | 105 (94.6%) | 123 (80.9%) |
| 65 to 74 Years | 59 (98.3%) | 65 (87.8%) |
| 75 Years and over | 18 (69.2%) | 45 (71.4%) |
| Total | 619 (90.4%) | 558 (83.7%) |
Income Below Poverty Among Married-Couple Families in Stratford
The poverty statistics for married-couple families in Stratford show that 7.0% or 20 of the total 287 families live below the poverty line. Families with 3 or 4 children have the highest poverty rate of 33.3%, comprising of 5 families. On the other hand, families with 1 or 2 children have the lowest poverty rate of 0.0%, which includes 0 families.
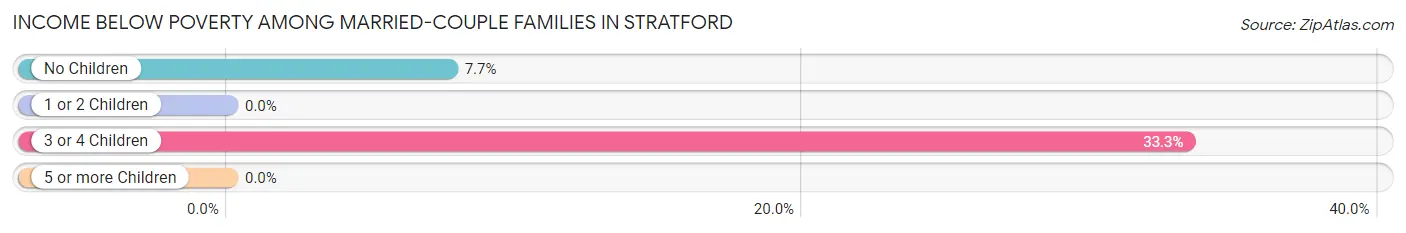
| Children | Above Poverty | Below Poverty |
| No Children | 181 (92.3%) | 15 (7.6%) |
| 1 or 2 Children | 76 (100.0%) | 0 (0.0%) |
| 3 or 4 Children | 10 (66.7%) | 5 (33.3%) |
| 5 or more Children | 0 (0.0%) | 0 (0.0%) |
| Total | 267 (93.0%) | 20 (7.0%) |
Income Below Poverty Among Single-Parent Households in Stratford
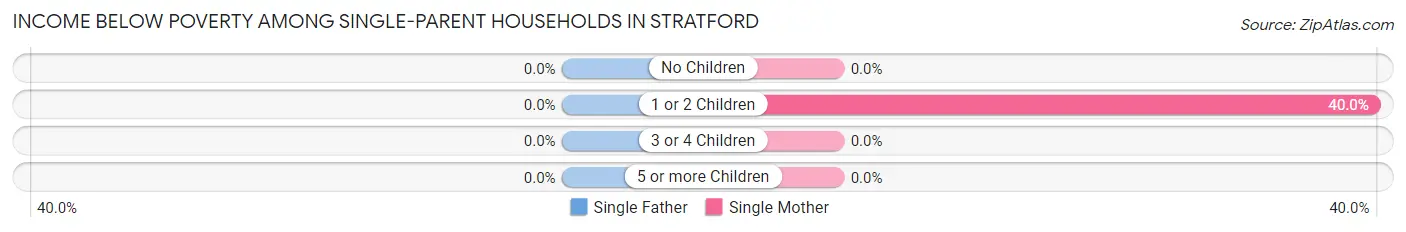
| Children | Single Father | Single Mother |
| No Children | 0 (0.0%) | 0 (0.0%) |
| 1 or 2 Children | 0 (0.0%) | 18 (40.0%) |
| 3 or 4 Children | 0 (0.0%) | 0 (0.0%) |
| 5 or more Children | 0 (0.0%) | 0 (0.0%) |
| Total | 0 (0.0%) | 18 (29.5%) |
Income Below Poverty Among Married-Couple vs Single-Parent Households in Stratford
The poverty data for Stratford shows that 20 of the married-couple family households (7.0%) and 18 of the single-parent households (17.8%) are living below the poverty level. Within the married-couple family households, those with 3 or 4 children have the highest poverty rate, with 5 households (33.3%) falling below the poverty line. Among the single-parent households, those with 1 or 2 children have the highest poverty rate, with 18 household (22.0%) living below poverty.
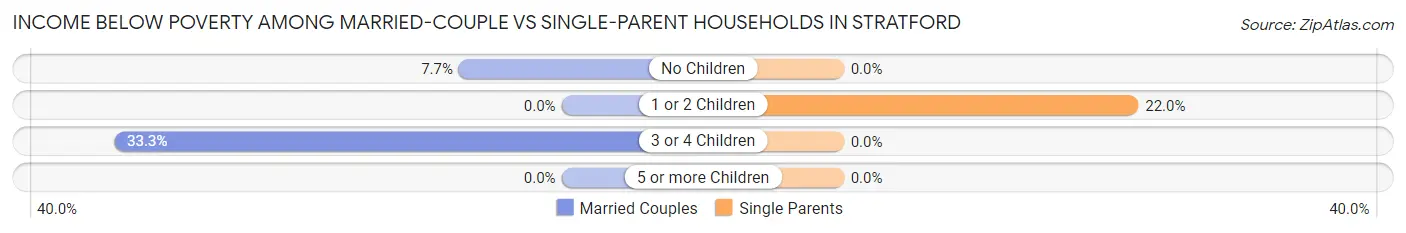
| Children | Married-Couple Families | Single-Parent Households |
| No Children | 15 (7.6%) | 0 (0.0%) |
| 1 or 2 Children | 0 (0.0%) | 18 (22.0%) |
| 3 or 4 Children | 5 (33.3%) | 0 (0.0%) |
| 5 or more Children | 0 (0.0%) | 0 (0.0%) |
| Total | 20 (7.0%) | 18 (17.8%) |
Race in Stratford
The most populous races in Stratford are White / Caucasian (1,252 | 91.8%), Hispanic or Latino (130 | 9.5%), and Some other Race (76 | 5.6%).
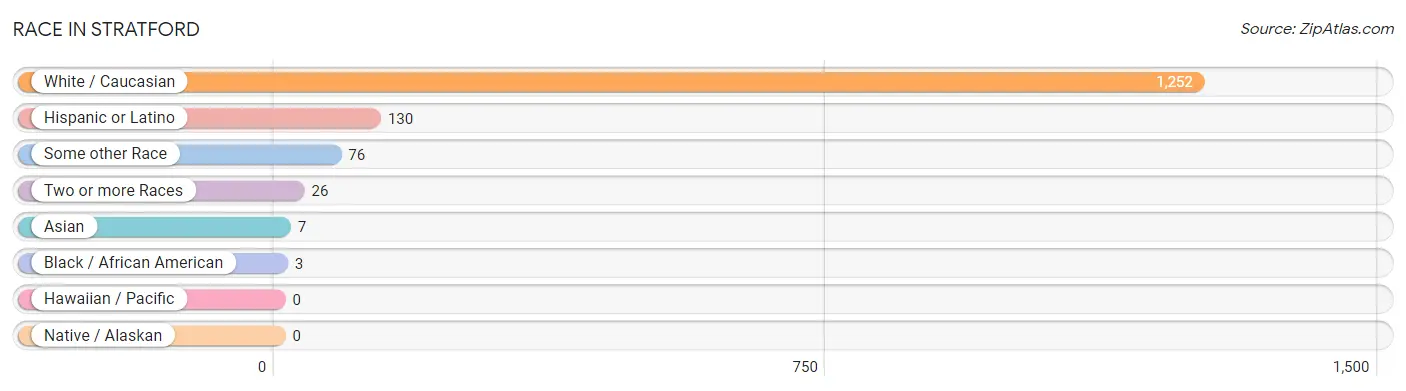
| Race | # Population | % Population |
| Asian | 7 | 0.5% |
| Black / African American | 3 | 0.2% |
| Hawaiian / Pacific | 0 | 0.0% |
| Hispanic or Latino | 130 | 9.5% |
| Native / Alaskan | 0 | 0.0% |
| White / Caucasian | 1,252 | 91.8% |
| Two or more Races | 26 | 1.9% |
| Some other Race | 76 | 5.6% |
| Total | 1,364 | 100.0% |
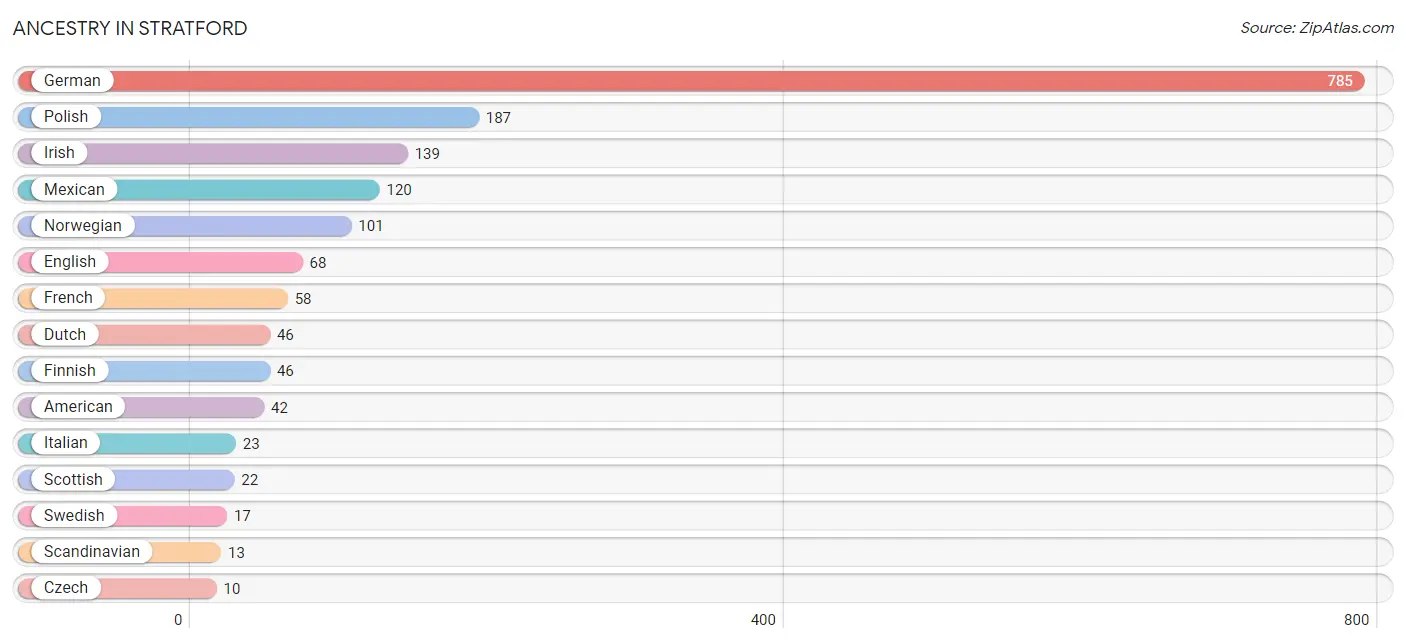
Ancestry in Stratford
The most populous ancestries reported in Stratford are German (785 | 57.6%), Polish (187 | 13.7%), Irish (139 | 10.2%), Mexican (120 | 8.8%), and Norwegian (101 | 7.4%), together accounting for 97.6% of all Stratford residents.
| Ancestry | # Population | % Population |
| American | 42 | 3.1% |
| Austrian | 4 | 0.3% |
| Canadian | 2 | 0.2% |
| Central American Indian | 8 | 0.6% |
| Colombian | 4 | 0.3% |
| Czech | 10 | 0.7% |
| Dutch | 46 | 3.4% |
| English | 68 | 5.0% |
| Finnish | 46 | 3.4% |
| French | 58 | 4.3% |
| French Canadian | 9 | 0.7% |
| German | 785 | 57.6% |
| Indian (Asian) | 3 | 0.2% |
| Irish | 139 | 10.2% |
| Italian | 23 | 1.7% |
| Korean | 2 | 0.2% |
| Mexican | 120 | 8.8% |
| Native Hawaiian | 6 | 0.4% |
| Norwegian | 101 | 7.4% |
| Pennsylvania German | 5 | 0.4% |
| Polish | 187 | 13.7% |
| Puerto Rican | 6 | 0.4% |
| Romanian | 2 | 0.2% |
| Scandinavian | 13 | 0.9% |
| Scottish | 22 | 1.6% |
| South American | 4 | 0.3% |
| Swedish | 17 | 1.3% |
| Swiss | 4 | 0.3% |
| Thai | 2 | 0.2% |
| Ukrainian | 3 | 0.2% |
| Yugoslavian | 8 | 0.6% | View All 31 Rows |
Immigrants in Stratford
The most numerous immigrant groups reported in Stratford came from Latin America (80 | 5.9%), Central America (76 | 5.6%), Mexico (76 | 5.6%), Asia (7 | 0.5%), and Canada (5 | 0.4%), together accounting for 17.9% of all Stratford residents.
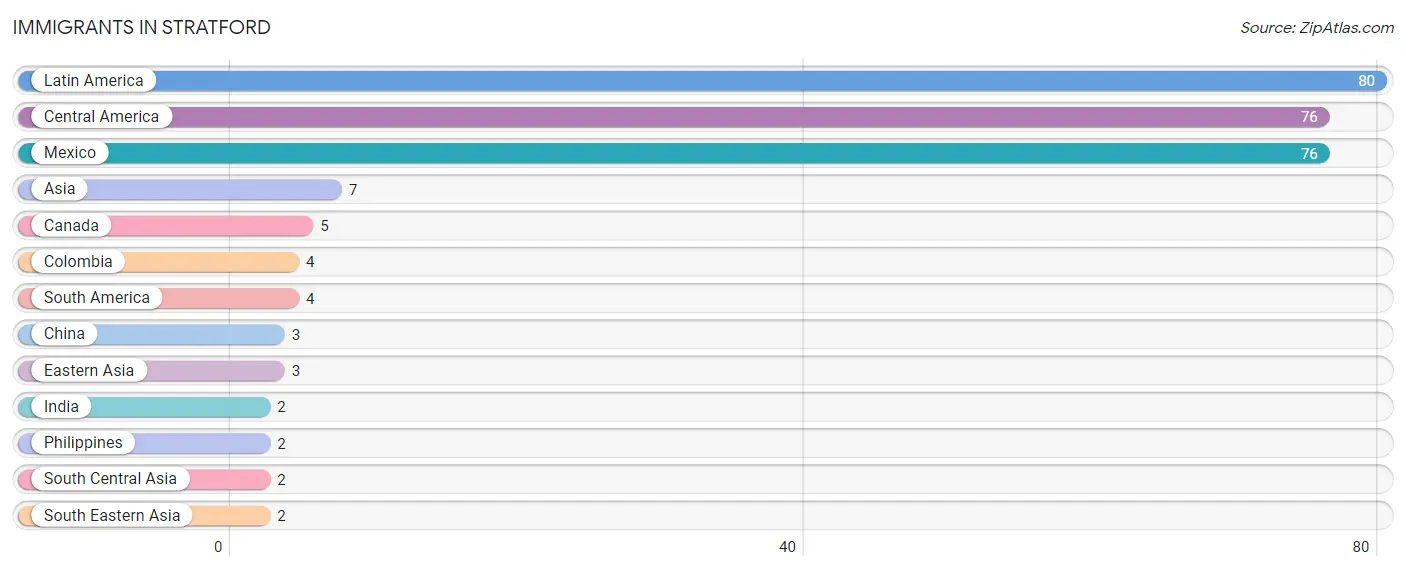
| Immigration Origin | # Population | % Population |
| Asia | 7 | 0.5% |
| Canada | 5 | 0.4% |
| Central America | 76 | 5.6% |
| China | 3 | 0.2% |
| Colombia | 4 | 0.3% |
| Eastern Asia | 3 | 0.2% |
| India | 2 | 0.2% |
| Latin America | 80 | 5.9% |
| Mexico | 76 | 5.6% |
| Philippines | 2 | 0.2% |
| South America | 4 | 0.3% |
| South Central Asia | 2 | 0.2% |
| South Eastern Asia | 2 | 0.2% | View All 13 Rows |
Sex and Age in Stratford
Sex and Age in Stratford
The most populous age groups in Stratford are 35 to 39 Years (97 | 14.1%) for men and 55 to 59 Years (88 | 13.0%) for women.
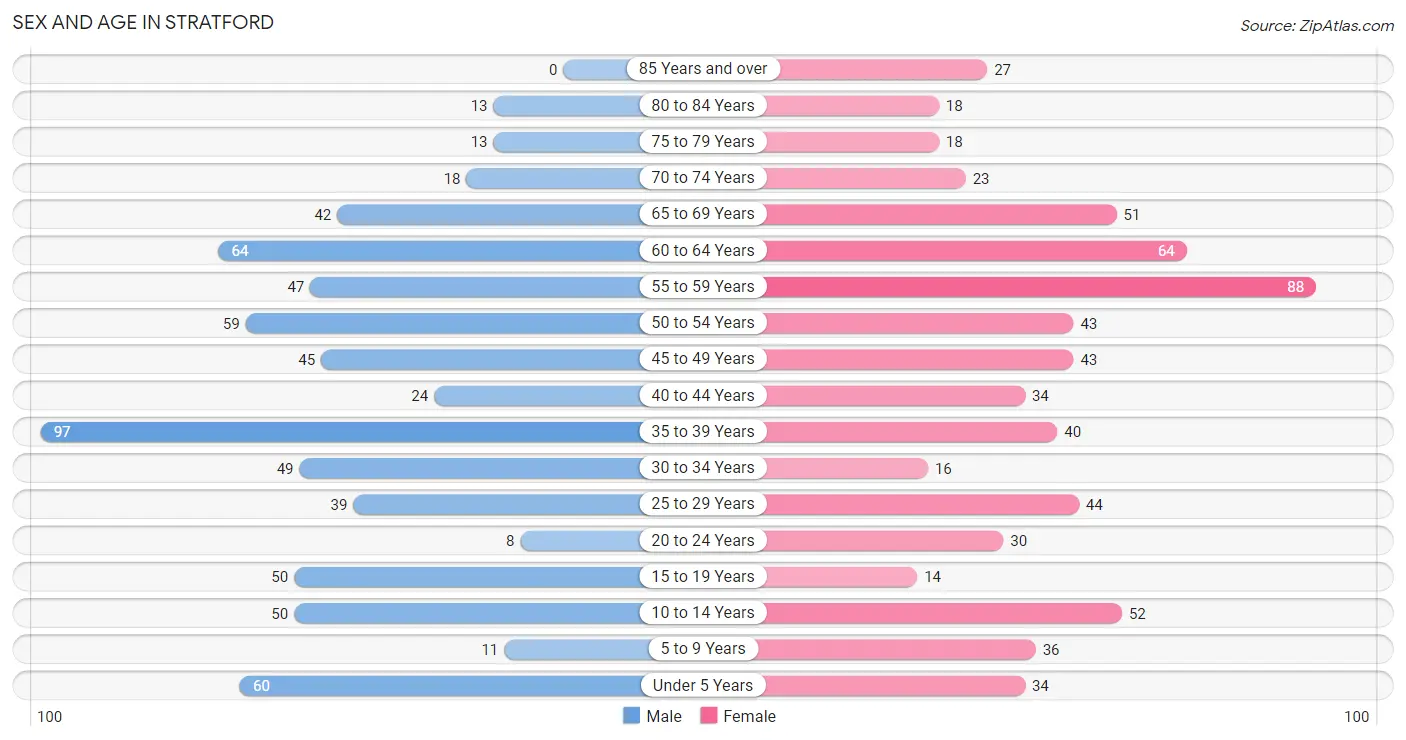
| Age Bracket | Male | Female |
| Under 5 Years | 60 (8.7%) | 34 (5.0%) |
| 5 to 9 Years | 11 (1.6%) | 36 (5.3%) |
| 10 to 14 Years | 50 (7.3%) | 52 (7.7%) |
| 15 to 19 Years | 50 (7.3%) | 14 (2.1%) |
| 20 to 24 Years | 8 (1.2%) | 30 (4.4%) |
| 25 to 29 Years | 39 (5.7%) | 44 (6.5%) |
| 30 to 34 Years | 49 (7.1%) | 16 (2.4%) |
| 35 to 39 Years | 97 (14.1%) | 40 (5.9%) |
| 40 to 44 Years | 24 (3.5%) | 34 (5.0%) |
| 45 to 49 Years | 45 (6.5%) | 43 (6.4%) |
| 50 to 54 Years | 59 (8.6%) | 43 (6.4%) |
| 55 to 59 Years | 47 (6.8%) | 88 (13.0%) |
| 60 to 64 Years | 64 (9.3%) | 64 (9.5%) |
| 65 to 69 Years | 42 (6.1%) | 51 (7.6%) |
| 70 to 74 Years | 18 (2.6%) | 23 (3.4%) |
| 75 to 79 Years | 13 (1.9%) | 18 (2.7%) |
| 80 to 84 Years | 13 (1.9%) | 18 (2.7%) |
| 85 Years and over | 0 (0.0%) | 27 (4.0%) |
| Total | 689 (100.0%) | 675 (100.0%) |
Families and Households in Stratford
Median Family Size in Stratford
The median family size in Stratford is 2.62 persons per family, with married-couple families (287 | 74.0%) accounting for the largest median family size of 2.68 persons per family. On the other hand, single female/mother families (61 | 15.7%) represent the smallest median family size with 2.39 persons per family.
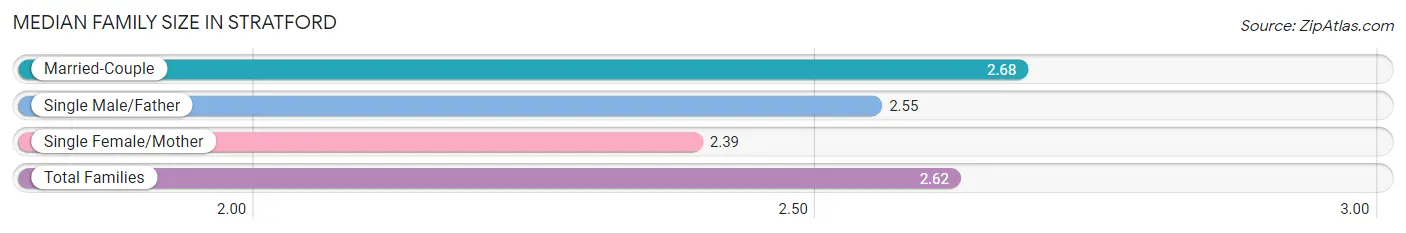
| Family Type | # Families | Family Size |
| Married-Couple | 287 (74.0%) | 2.68 |
| Single Male/Father | 40 (10.3%) | 2.55 |
| Single Female/Mother | 61 (15.7%) | 2.39 |
| Total Families | 388 (100.0%) | 2.62 |
Median Household Size in Stratford
The median household size in Stratford is 2.15 persons per household, with single male/father households (40 | 6.4%) accounting for the largest median household size of 3.28 persons per household. non-family households (238 | 38.0%) represent the smallest median household size with 1.23 persons per household.
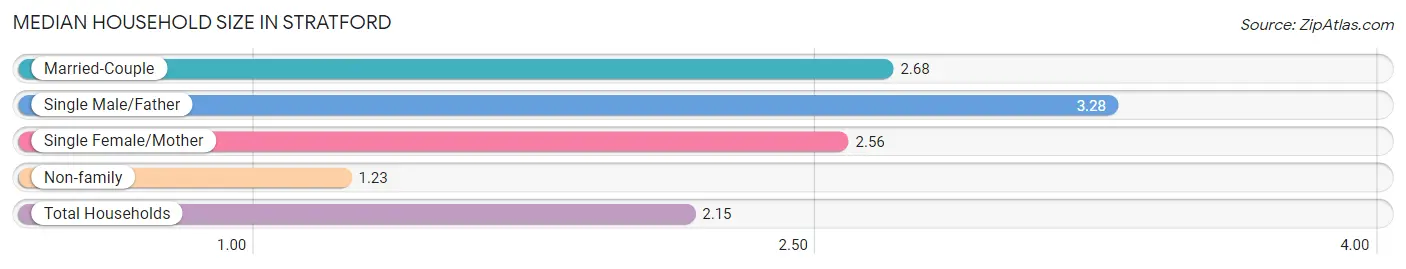
| Household Type | # Households | Household Size |
| Married-Couple | 287 (45.9%) | 2.68 |
| Single Male/Father | 40 (6.4%) | 3.28 |
| Single Female/Mother | 61 (9.7%) | 2.56 |
| Non-family | 238 (38.0%) | 1.23 |
| Total Households | 626 (100.0%) | 2.15 |
Household Size by Marriage Status in Stratford
Out of a total of 626 households in Stratford, 388 (62.0%) are family households, while 238 (38.0%) are nonfamily households. The most numerous type of family households are 2-person households, comprising 228, and the most common type of nonfamily households are 1-person households, comprising 155.
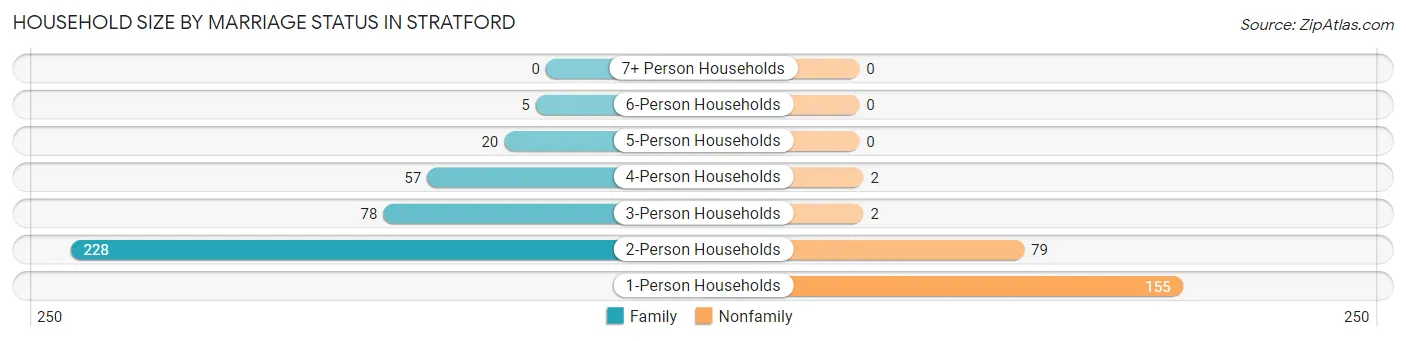
| Household Size | Family Households | Nonfamily Households |
| 1-Person Households | - | 155 (24.8%) |
| 2-Person Households | 228 (36.4%) | 79 (12.6%) |
| 3-Person Households | 78 (12.5%) | 2 (0.3%) |
| 4-Person Households | 57 (9.1%) | 2 (0.3%) |
| 5-Person Households | 20 (3.2%) | 0 (0.0%) |
| 6-Person Households | 5 (0.8%) | 0 (0.0%) |
| 7+ Person Households | 0 (0.0%) | 0 (0.0%) |
| Total | 388 (62.0%) | 238 (38.0%) |
Female Fertility in Stratford
Fertility by Age in Stratford
Average fertility rate in Stratford is 135.0 births per 1,000 women. Women in the age bracket of 20 to 34 years have the highest fertility rate with 356.0 births per 1,000 women. Women in the age bracket of 20 to 34 years acount for 100.0% of all women with births.
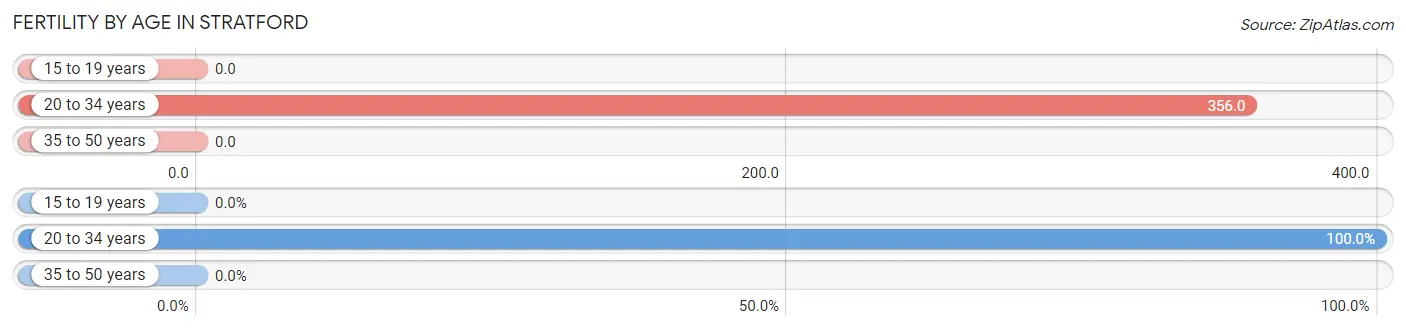
| Age Bracket | Women with Births | Births / 1,000 Women |
| 15 to 19 years | 0 (0.0%) | 0.0 |
| 20 to 34 years | 32 (100.0%) | 356.0 |
| 35 to 50 years | 0 (0.0%) | 0.0 |
| Total | 32 (100.0%) | 135.0 |
Fertility by Age by Marriage Status in Stratford
84.4% of women with births (32) in Stratford are married. The highest percentage of unmarried women with births falls into 20 to 34 years age bracket with 15.6% of them unmarried at the time of birth, while the lowest percentage of unmarried women with births belong to 20 to 34 years age bracket with 15.6% of them unmarried.
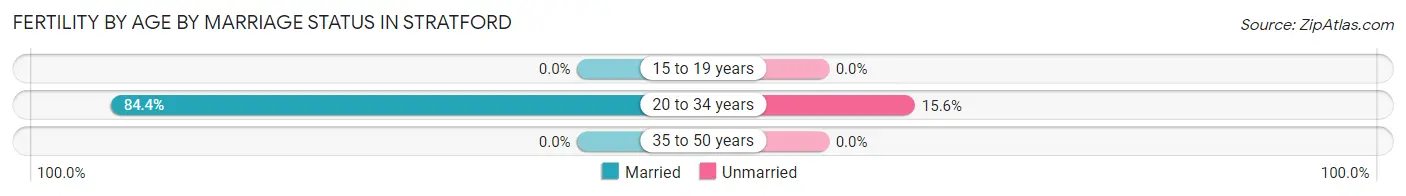
| Age Bracket | Married | Unmarried |
| 15 to 19 years | 0 (0.0%) | 0 (0.0%) |
| 20 to 34 years | 27 (84.4%) | 5 (15.6%) |
| 35 to 50 years | 0 (0.0%) | 0 (0.0%) |
| Total | 27 (84.4%) | 5 (15.6%) |
Fertility by Education in Stratford
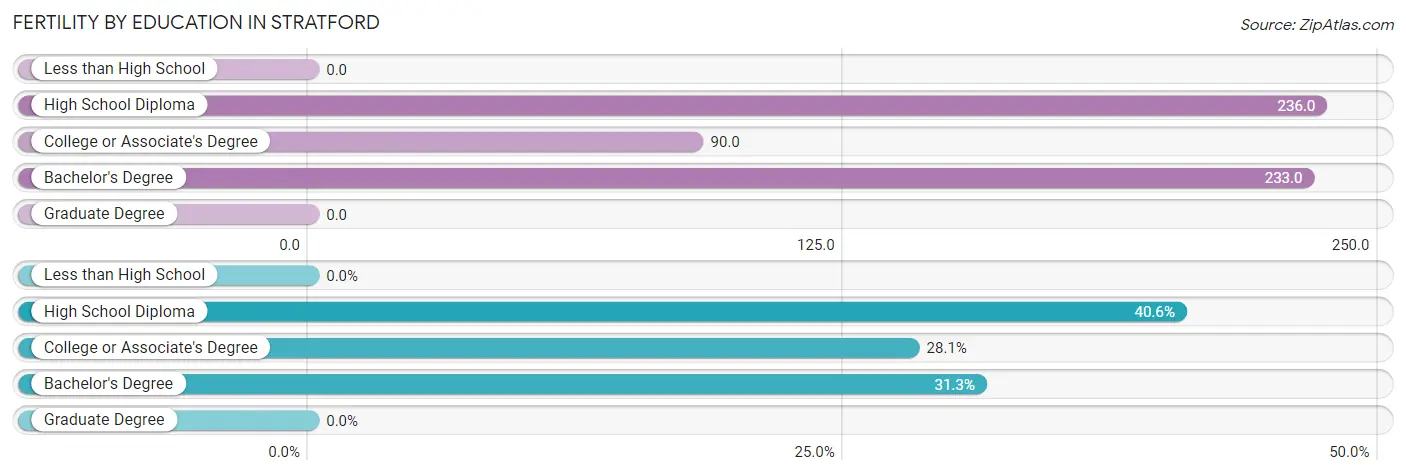
| Educational Attainment | Women with Births | Births / 1,000 Women |
| Less than High School | 0 (0.0%) | 0.0 |
| High School Diploma | 13 (40.6%) | 236.0 |
| College or Associate's Degree | 9 (28.1%) | 90.0 |
| Bachelor's Degree | 10 (31.2%) | 233.0 |
| Graduate Degree | 0 (0.0%) | 0.0 |
| Total | 32 (100.0%) | 135.0 |
Fertility by Education by Marriage Status in Stratford
15.6% of women with births in Stratford are unmarried. Women with the educational attainment of high school diploma are most likely to be married with 100.0% of them married at childbirth, while women with the educational attainment of college or associate's degree are least likely to be married with 55.6% of them unmarried at childbirth.
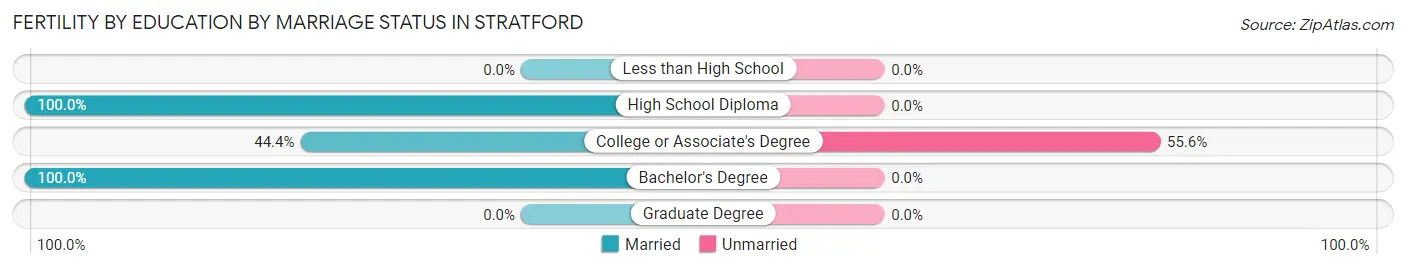
| Educational Attainment | Married | Unmarried |
| Less than High School | 0 (0.0%) | 0 (0.0%) |
| High School Diploma | 13 (100.0%) | 0 (0.0%) |
| College or Associate's Degree | 4 (44.4%) | 5 (55.6%) |
| Bachelor's Degree | 10 (100.0%) | 0 (0.0%) |
| Graduate Degree | 0 (0.0%) | 0 (0.0%) |
| Total | 27 (84.4%) | 5 (15.6%) |
Employment Characteristics in Stratford
Employment by Class of Employer in Stratford
Among the 813 employed individuals in Stratford, private company employees (648 | 79.7%), not-for-profit organizations (49 | 6.0%), and self-employed (not incorporated) (43 | 5.3%) make up the most common classes of employment.
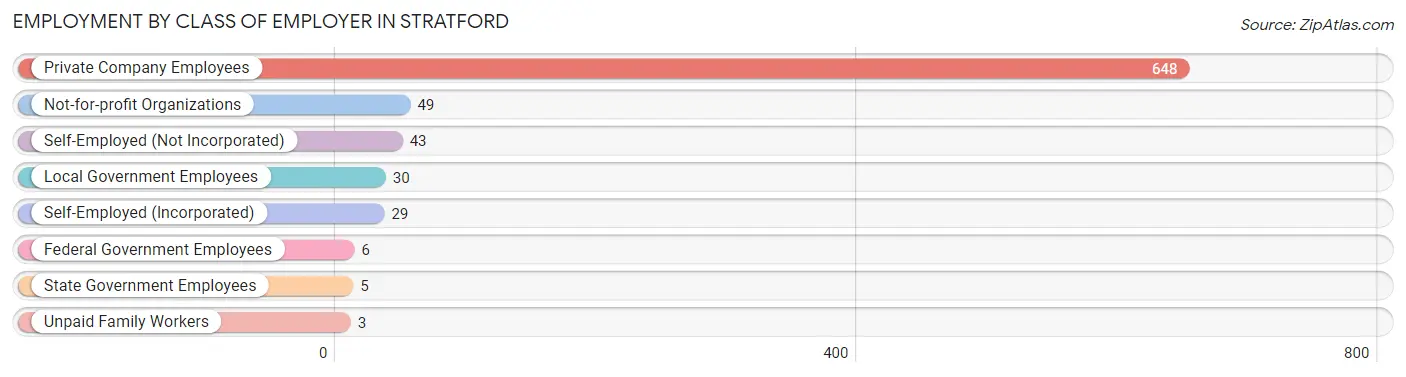
| Employer Class | # Employees | % Employees |
| Private Company Employees | 648 | 79.7% |
| Self-Employed (Incorporated) | 29 | 3.6% |
| Self-Employed (Not Incorporated) | 43 | 5.3% |
| Not-for-profit Organizations | 49 | 6.0% |
| Local Government Employees | 30 | 3.7% |
| State Government Employees | 5 | 0.6% |
| Federal Government Employees | 6 | 0.7% |
| Unpaid Family Workers | 3 | 0.4% |
| Total | 813 | 100.0% |
Employment Status by Age in Stratford
According to the labor force statistics for Stratford, out of the total population over 16 years of age (1,110), 75.1% or 834 individuals are in the labor force, with 1.8% or 15 of them unemployed. The age group with the highest labor force participation rate is 30 to 34 years, with 100.0% or 65 individuals in the labor force. Within the labor force, the 20 to 24 years age range has the highest percentage of unemployed individuals, with 33.3% or 10 of them being unemployed.
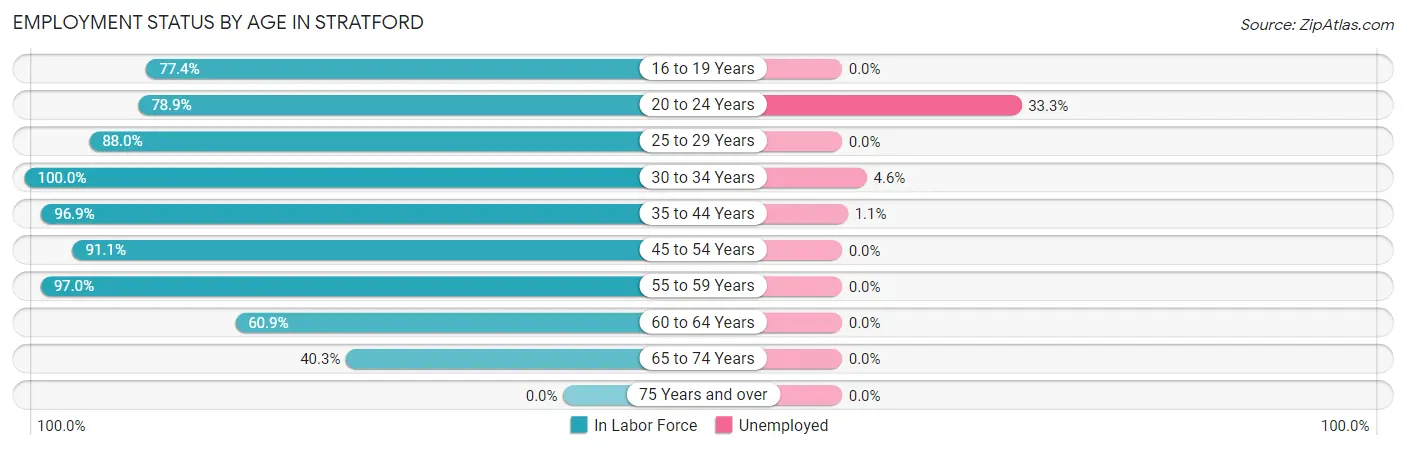
| Age Bracket | In Labor Force | Unemployed |
| 16 to 19 Years | 41 (77.4%) | 0 (0.0%) |
| 20 to 24 Years | 30 (78.9%) | 10 (33.3%) |
| 25 to 29 Years | 73 (88.0%) | 0 (0.0%) |
| 30 to 34 Years | 65 (100.0%) | 3 (4.6%) |
| 35 to 44 Years | 189 (96.9%) | 2 (1.1%) |
| 45 to 54 Years | 173 (91.1%) | 0 (0.0%) |
| 55 to 59 Years | 131 (97.0%) | 0 (0.0%) |
| 60 to 64 Years | 78 (60.9%) | 0 (0.0%) |
| 65 to 74 Years | 54 (40.3%) | 0 (0.0%) |
| 75 Years and over | 0 (0.0%) | 0 (0.0%) |
| Total | 834 (75.1%) | 15 (1.8%) |
Employment Status by Educational Attainment in Stratford
According to labor force statistics for Stratford, 89.1% of individuals (709) out of the total population between 25 and 64 years of age (796) are in the labor force, with 0.7% or 5 of them being unemployed. The group with the highest labor force participation rate are those with the educational attainment of less than high school, with 97.7% or 85 individuals in the labor force. Within the labor force, individuals with college / associate degree education have the highest percentage of unemployment, with 1.2% or 3 of them being unemployed.
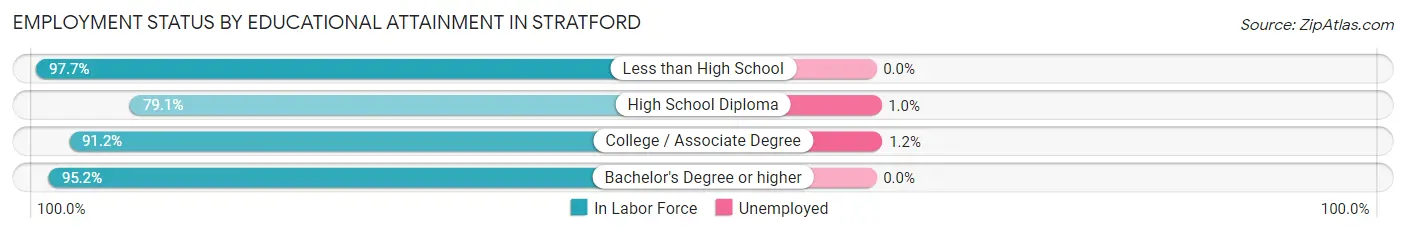
| Educational Attainment | In Labor Force | Unemployed |
| Less than High School | 85 (97.7%) | 0 (0.0%) |
| High School Diploma | 197 (79.1%) | 2 (1.0%) |
| College / Associate Degree | 249 (91.2%) | 3 (1.2%) |
| Bachelor's Degree or higher | 178 (95.2%) | 0 (0.0%) |
| Total | 709 (89.1%) | 6 (0.7%) |
Employment Occupations by Sex in Stratford
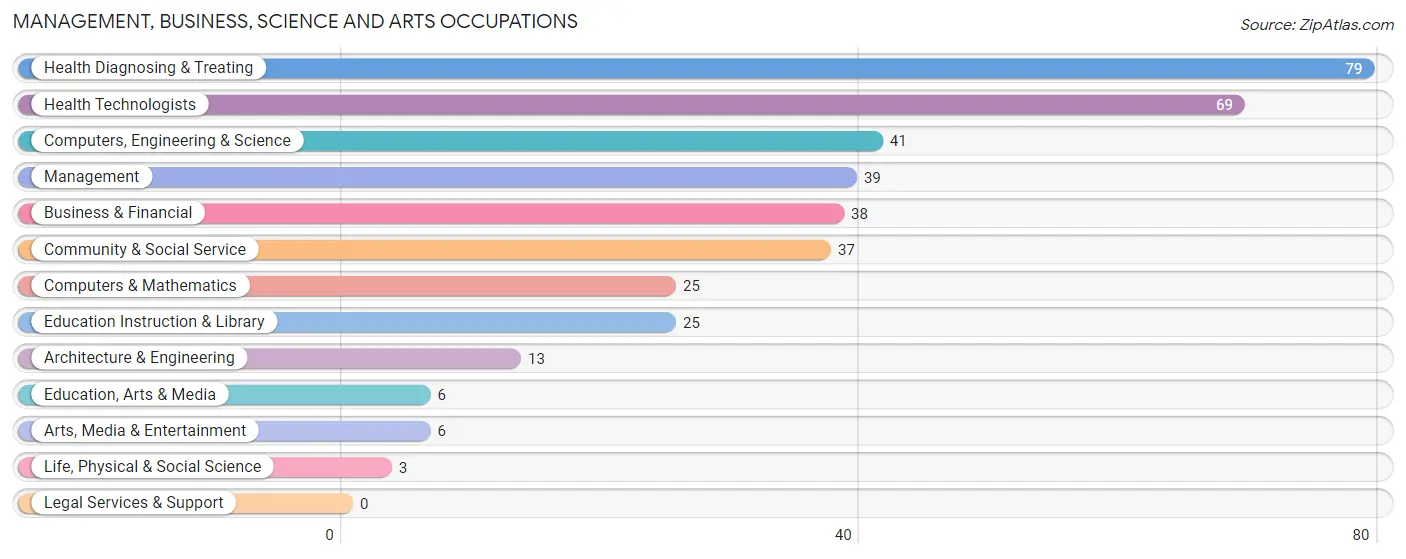
Management, Business, Science and Arts Occupations
The most common Management, Business, Science and Arts occupations in Stratford are Health Diagnosing & Treating (79 | 9.7%), Health Technologists (69 | 8.4%), Computers, Engineering & Science (41 | 5.0%), Management (39 | 4.8%), and Business & Financial (38 | 4.6%).
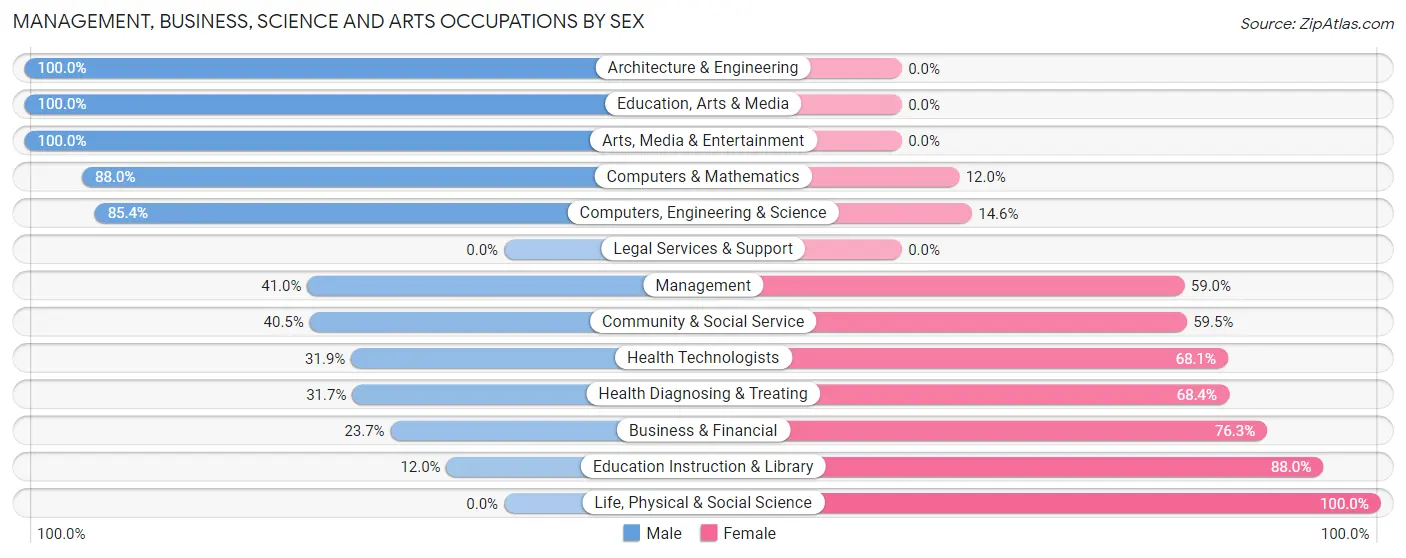
Management, Business, Science and Arts Occupations by Sex
Within the Management, Business, Science and Arts occupations in Stratford, the most male-oriented occupations are Architecture & Engineering (100.0%), Education, Arts & Media (100.0%), and Arts, Media & Entertainment (100.0%), while the most female-oriented occupations are Life, Physical & Social Science (100.0%), Education Instruction & Library (88.0%), and Business & Financial (76.3%).
| Occupation | Male | Female |
| Management | 16 (41.0%) | 23 (59.0%) |
| Business & Financial | 9 (23.7%) | 29 (76.3%) |
| Computers, Engineering & Science | 35 (85.4%) | 6 (14.6%) |
| Computers & Mathematics | 22 (88.0%) | 3 (12.0%) |
| Architecture & Engineering | 13 (100.0%) | 0 (0.0%) |
| Life, Physical & Social Science | 0 (0.0%) | 3 (100.0%) |
| Community & Social Service | 15 (40.5%) | 22 (59.5%) |
| Education, Arts & Media | 6 (100.0%) | 0 (0.0%) |
| Legal Services & Support | 0 (0.0%) | 0 (0.0%) |
| Education Instruction & Library | 3 (12.0%) | 22 (88.0%) |
| Arts, Media & Entertainment | 6 (100.0%) | 0 (0.0%) |
| Health Diagnosing & Treating | 25 (31.7%) | 54 (68.3%) |
| Health Technologists | 22 (31.9%) | 47 (68.1%) |
| Total (Category) | 100 (42.7%) | 134 (57.3%) |
| Total (Overall) | 468 (57.1%) | 351 (42.9%) |
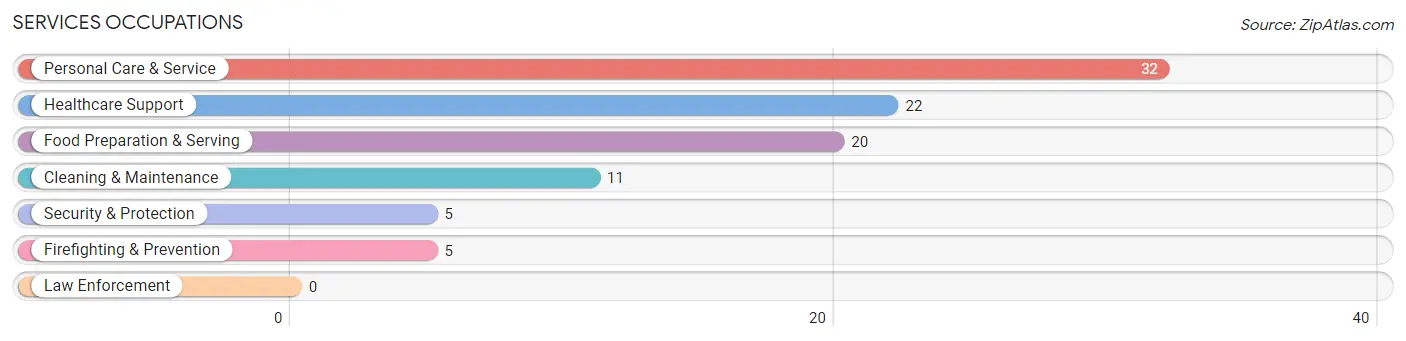
Services Occupations
The most common Services occupations in Stratford are Personal Care & Service (32 | 3.9%), Healthcare Support (22 | 2.7%), Food Preparation & Serving (20 | 2.4%), Cleaning & Maintenance (11 | 1.3%), and Security & Protection (5 | 0.6%).
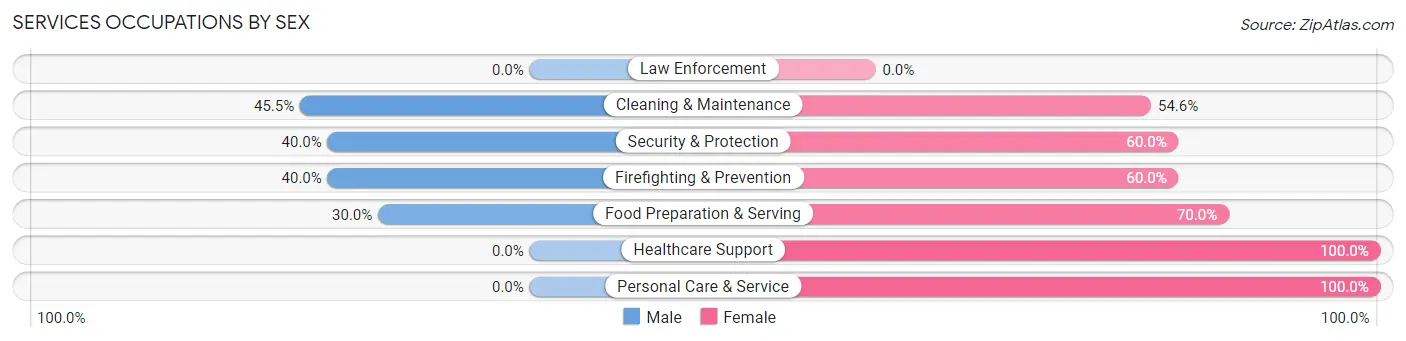
Services Occupations by Sex
Within the Services occupations in Stratford, the most male-oriented occupations are Cleaning & Maintenance (45.5%), Security & Protection (40.0%), and Firefighting & Prevention (40.0%), while the most female-oriented occupations are Healthcare Support (100.0%), Personal Care & Service (100.0%), and Food Preparation & Serving (70.0%).
| Occupation | Male | Female |
| Healthcare Support | 0 (0.0%) | 22 (100.0%) |
| Security & Protection | 2 (40.0%) | 3 (60.0%) |
| Firefighting & Prevention | 2 (40.0%) | 3 (60.0%) |
| Law Enforcement | 0 (0.0%) | 0 (0.0%) |
| Food Preparation & Serving | 6 (30.0%) | 14 (70.0%) |
| Cleaning & Maintenance | 5 (45.5%) | 6 (54.5%) |
| Personal Care & Service | 0 (0.0%) | 32 (100.0%) |
| Total (Category) | 13 (14.4%) | 77 (85.6%) |
| Total (Overall) | 468 (57.1%) | 351 (42.9%) |
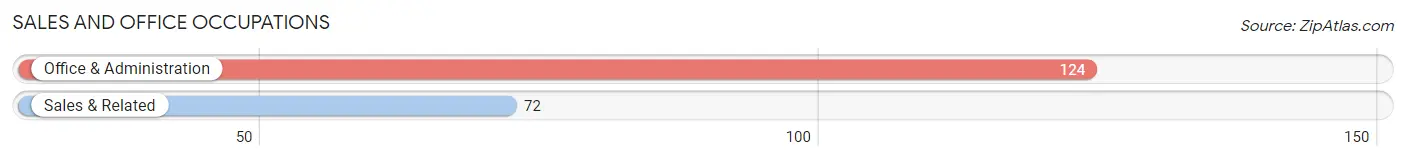
Sales and Office Occupations
The most common Sales and Office occupations in Stratford are Office & Administration (124 | 15.1%), and Sales & Related (72 | 8.8%).
Sales and Office Occupations by Sex
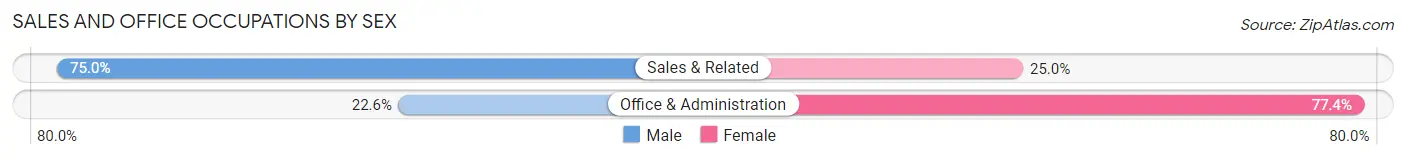
| Occupation | Male | Female |
| Sales & Related | 54 (75.0%) | 18 (25.0%) |
| Office & Administration | 28 (22.6%) | 96 (77.4%) |
| Total (Category) | 82 (41.8%) | 114 (58.2%) |
| Total (Overall) | 468 (57.1%) | 351 (42.9%) |
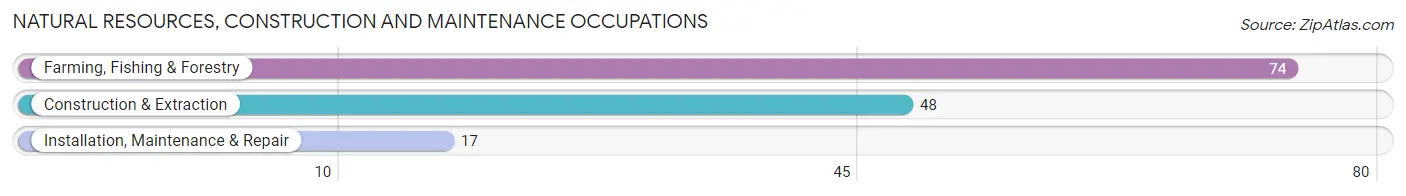
Natural Resources, Construction and Maintenance Occupations
The most common Natural Resources, Construction and Maintenance occupations in Stratford are Farming, Fishing & Forestry (74 | 9.0%), Construction & Extraction (48 | 5.9%), and Installation, Maintenance & Repair (17 | 2.1%).
Natural Resources, Construction and Maintenance Occupations by Sex
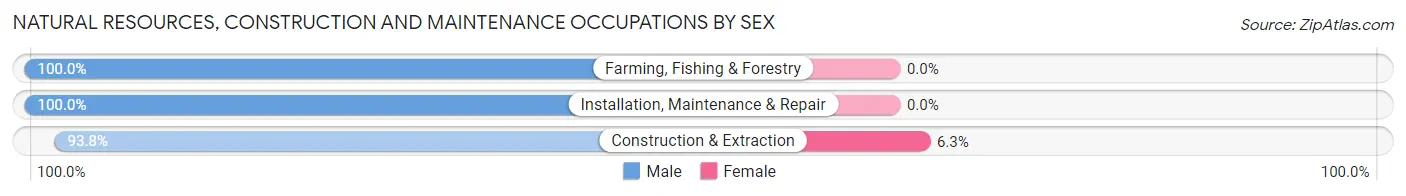
| Occupation | Male | Female |
| Farming, Fishing & Forestry | 74 (100.0%) | 0 (0.0%) |
| Construction & Extraction | 45 (93.8%) | 3 (6.2%) |
| Installation, Maintenance & Repair | 17 (100.0%) | 0 (0.0%) |
| Total (Category) | 136 (97.8%) | 3 (2.2%) |
| Total (Overall) | 468 (57.1%) | 351 (42.9%) |
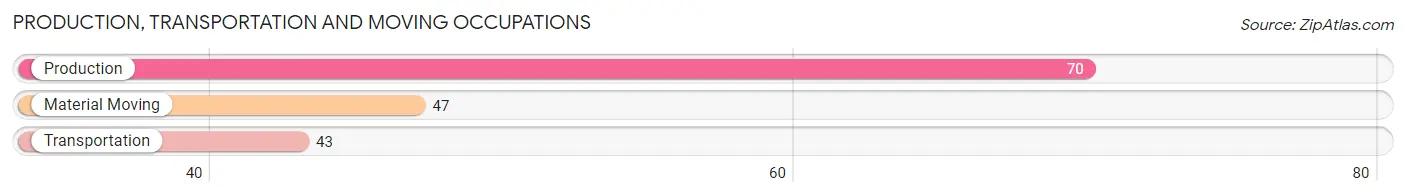
Production, Transportation and Moving Occupations
The most common Production, Transportation and Moving occupations in Stratford are Production (70 | 8.6%), Material Moving (47 | 5.7%), and Transportation (43 | 5.2%).
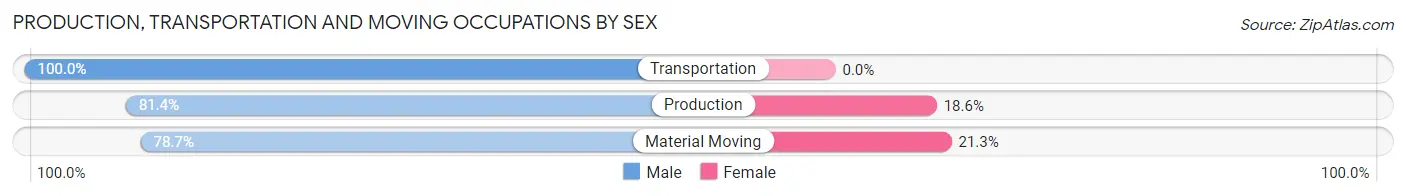
Production, Transportation and Moving Occupations by Sex
| Occupation | Male | Female |
| Production | 57 (81.4%) | 13 (18.6%) |
| Transportation | 43 (100.0%) | 0 (0.0%) |
| Material Moving | 37 (78.7%) | 10 (21.3%) |
| Total (Category) | 137 (85.6%) | 23 (14.4%) |
| Total (Overall) | 468 (57.1%) | 351 (42.9%) |
Employment Industries by Sex in Stratford
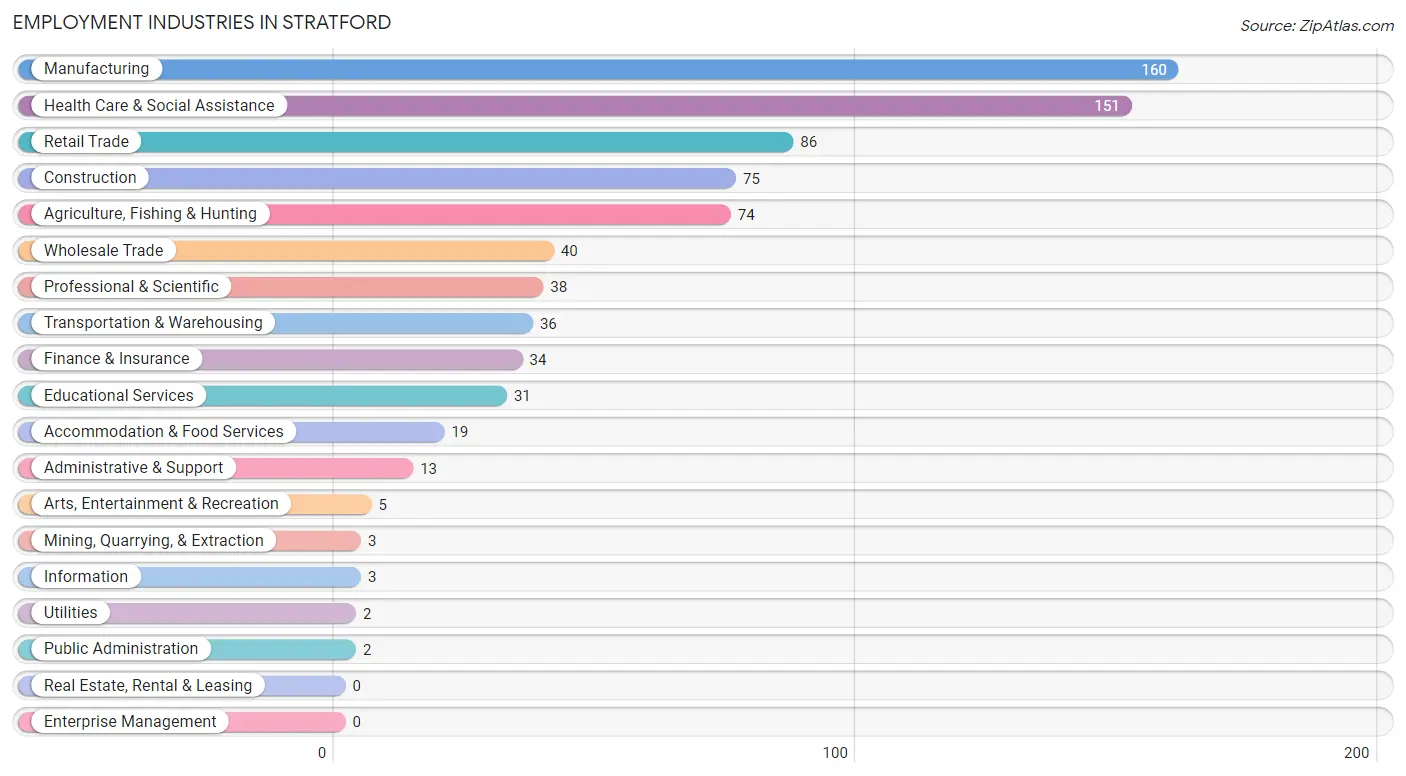
Employment Industries in Stratford
The major employment industries in Stratford include Manufacturing (160 | 19.5%), Health Care & Social Assistance (151 | 18.4%), Retail Trade (86 | 10.5%), Construction (75 | 9.2%), and Agriculture, Fishing & Hunting (74 | 9.0%).
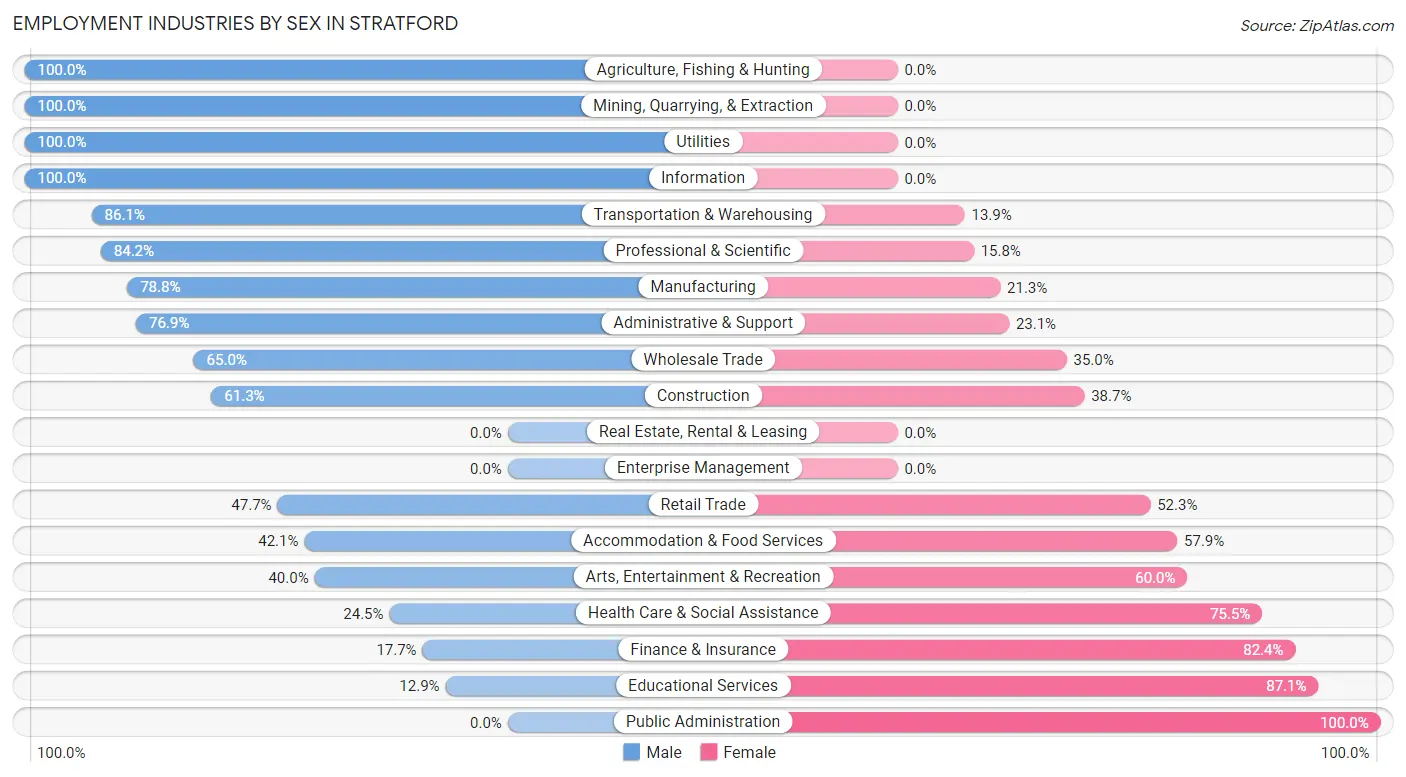
Employment Industries by Sex in Stratford
The Stratford industries that see more men than women are Agriculture, Fishing & Hunting (100.0%), Mining, Quarrying, & Extraction (100.0%), and Utilities (100.0%), whereas the industries that tend to have a higher number of women are Public Administration (100.0%), Educational Services (87.1%), and Finance & Insurance (82.4%).
| Industry | Male | Female |
| Agriculture, Fishing & Hunting | 74 (100.0%) | 0 (0.0%) |
| Mining, Quarrying, & Extraction | 3 (100.0%) | 0 (0.0%) |
| Construction | 46 (61.3%) | 29 (38.7%) |
| Manufacturing | 126 (78.7%) | 34 (21.2%) |
| Wholesale Trade | 26 (65.0%) | 14 (35.0%) |
| Retail Trade | 41 (47.7%) | 45 (52.3%) |
| Transportation & Warehousing | 31 (86.1%) | 5 (13.9%) |
| Utilities | 2 (100.0%) | 0 (0.0%) |
| Information | 3 (100.0%) | 0 (0.0%) |
| Finance & Insurance | 6 (17.6%) | 28 (82.4%) |
| Real Estate, Rental & Leasing | 0 (0.0%) | 0 (0.0%) |
| Professional & Scientific | 32 (84.2%) | 6 (15.8%) |
| Enterprise Management | 0 (0.0%) | 0 (0.0%) |
| Administrative & Support | 10 (76.9%) | 3 (23.1%) |
| Educational Services | 4 (12.9%) | 27 (87.1%) |
| Health Care & Social Assistance | 37 (24.5%) | 114 (75.5%) |
| Arts, Entertainment & Recreation | 2 (40.0%) | 3 (60.0%) |
| Accommodation & Food Services | 8 (42.1%) | 11 (57.9%) |
| Public Administration | 0 (0.0%) | 2 (100.0%) |
| Total | 468 (57.1%) | 351 (42.9%) |
Education in Stratford
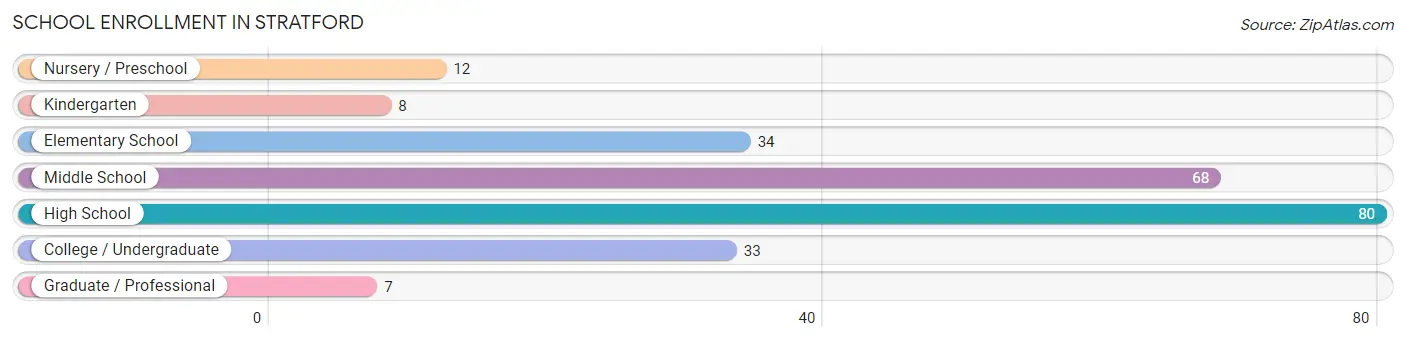
School Enrollment in Stratford
The most common levels of schooling among the 242 students in Stratford are high school (80 | 33.1%), middle school (68 | 28.1%), and elementary school (34 | 14.1%).
| School Level | # Students | % Students |
| Nursery / Preschool | 12 | 5.0% |
| Kindergarten | 8 | 3.3% |
| Elementary School | 34 | 14.1% |
| Middle School | 68 | 28.1% |
| High School | 80 | 33.1% |
| College / Undergraduate | 33 | 13.6% |
| Graduate / Professional | 7 | 2.9% |
| Total | 242 | 100.0% |
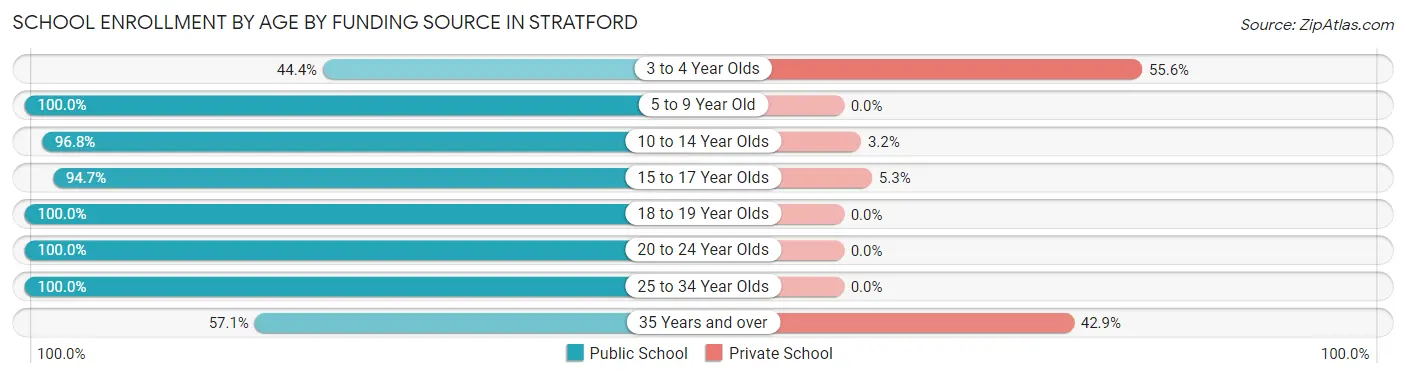
School Enrollment by Age by Funding Source in Stratford
Out of a total of 242 students who are enrolled in schools in Stratford, 17 (7.0%) attend a private institution, while the remaining 225 (93.0%) are enrolled in public schools. The age group of 3 to 4 year olds has the highest likelihood of being enrolled in private schools, with 5 (55.6% in the age bracket) enrolled. Conversely, the age group of 5 to 9 year old has the lowest likelihood of being enrolled in a private school, with 42 (100.0% in the age bracket) attending a public institution.
| Age Bracket | Public School | Private School |
| 3 to 4 Year Olds | 4 (44.4%) | 5 (55.6%) |
| 5 to 9 Year Old | 42 (100.0%) | 0 (0.0%) |
| 10 to 14 Year Olds | 90 (96.8%) | 3 (3.2%) |
| 15 to 17 Year Olds | 54 (94.7%) | 3 (5.3%) |
| 18 to 19 Year Olds | 4 (100.0%) | 0 (0.0%) |
| 20 to 24 Year Olds | 14 (100.0%) | 0 (0.0%) |
| 25 to 34 Year Olds | 9 (100.0%) | 0 (0.0%) |
| 35 Years and over | 8 (57.1%) | 6 (42.9%) |
| Total | 225 (93.0%) | 17 (7.0%) |
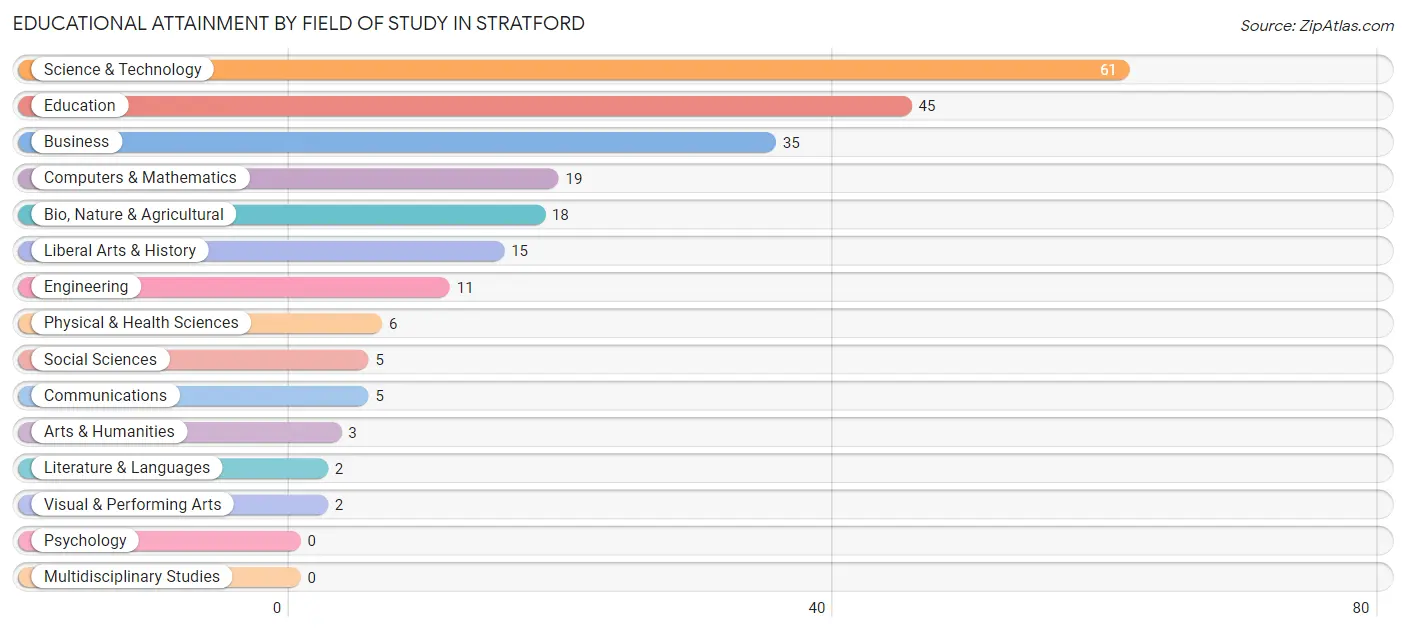
Educational Attainment by Field of Study in Stratford
Science & technology (61 | 26.9%), education (45 | 19.8%), business (35 | 15.4%), computers & mathematics (19 | 8.4%), and bio, nature & agricultural (18 | 7.9%) are the most common fields of study among 227 individuals in Stratford who have obtained a bachelor's degree or higher.
| Field of Study | # Graduates | % Graduates |
| Computers & Mathematics | 19 | 8.4% |
| Bio, Nature & Agricultural | 18 | 7.9% |
| Physical & Health Sciences | 6 | 2.6% |
| Psychology | 0 | 0.0% |
| Social Sciences | 5 | 2.2% |
| Engineering | 11 | 4.9% |
| Multidisciplinary Studies | 0 | 0.0% |
| Science & Technology | 61 | 26.9% |
| Business | 35 | 15.4% |
| Education | 45 | 19.8% |
| Literature & Languages | 2 | 0.9% |
| Liberal Arts & History | 15 | 6.6% |
| Visual & Performing Arts | 2 | 0.9% |
| Communications | 5 | 2.2% |
| Arts & Humanities | 3 | 1.3% |
| Total | 227 | 100.0% |
Transportation & Commute in Stratford
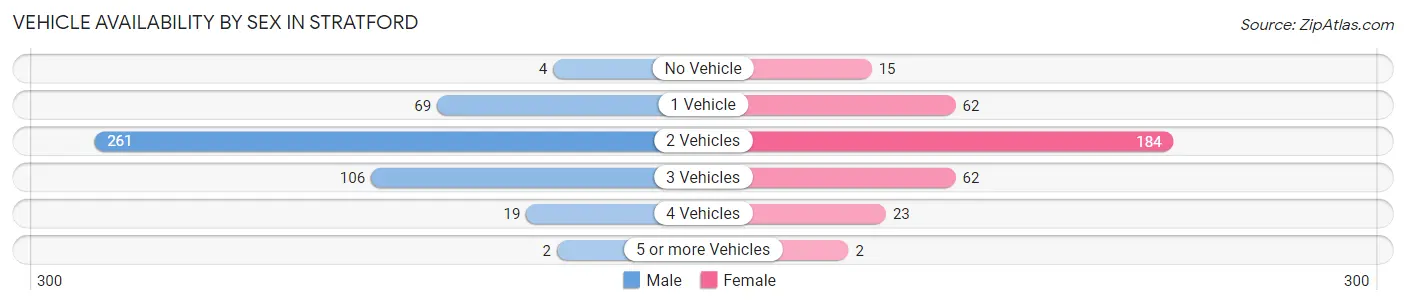
Vehicle Availability by Sex in Stratford
The most prevalent vehicle ownership categories in Stratford are males with 2 vehicles (261, accounting for 56.6%) and females with 2 vehicles (184, making up 75.0%).
| Vehicles Available | Male | Female |
| No Vehicle | 4 (0.9%) | 15 (4.3%) |
| 1 Vehicle | 69 (15.0%) | 62 (17.8%) |
| 2 Vehicles | 261 (56.6%) | 184 (52.9%) |
| 3 Vehicles | 106 (23.0%) | 62 (17.8%) |
| 4 Vehicles | 19 (4.1%) | 23 (6.6%) |
| 5 or more Vehicles | 2 (0.4%) | 2 (0.6%) |
| Total | 461 (100.0%) | 348 (100.0%) |
Commute Time in Stratford
The most frequently occuring commute durations in Stratford are 20 to 24 minutes (189 commuters, 25.3%), 15 to 19 minutes (147 commuters, 19.7%), and less than 5 minutes (84 commuters, 11.3%).
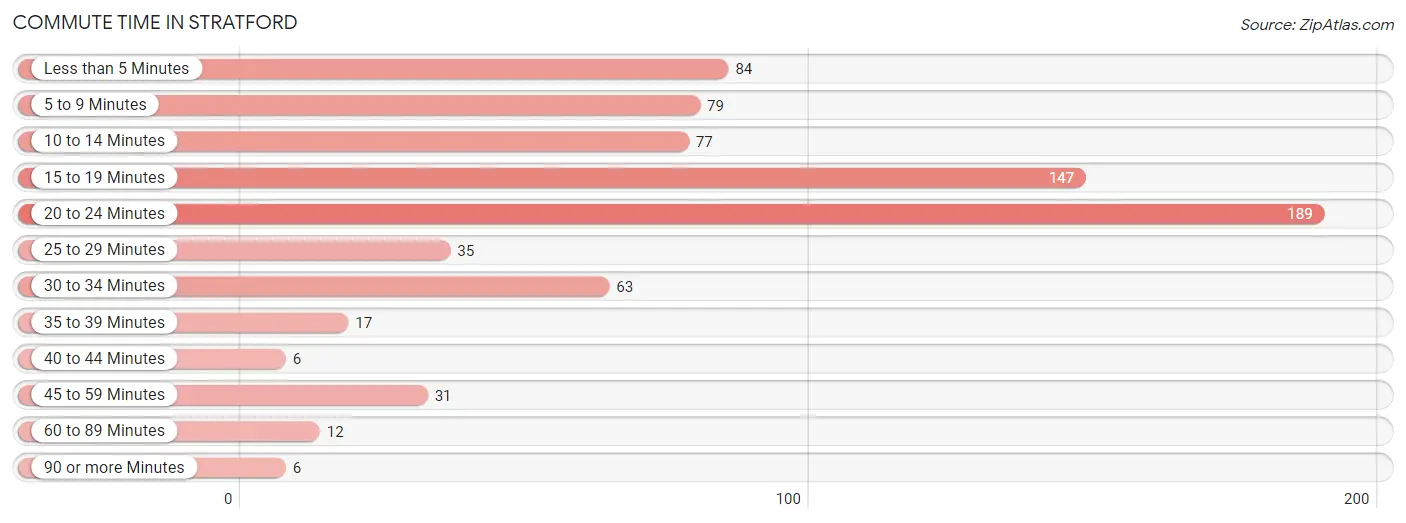
| Commute Time | # Commuters | % Commuters |
| Less than 5 Minutes | 84 | 11.3% |
| 5 to 9 Minutes | 79 | 10.6% |
| 10 to 14 Minutes | 77 | 10.3% |
| 15 to 19 Minutes | 147 | 19.7% |
| 20 to 24 Minutes | 189 | 25.3% |
| 25 to 29 Minutes | 35 | 4.7% |
| 30 to 34 Minutes | 63 | 8.5% |
| 35 to 39 Minutes | 17 | 2.3% |
| 40 to 44 Minutes | 6 | 0.8% |
| 45 to 59 Minutes | 31 | 4.2% |
| 60 to 89 Minutes | 12 | 1.6% |
| 90 or more Minutes | 6 | 0.8% |
Commute Time by Sex in Stratford
The most common commute times in Stratford are 20 to 24 minutes (157 commuters, 34.7%) for males and 15 to 19 minutes (75 commuters, 25.6%) for females.
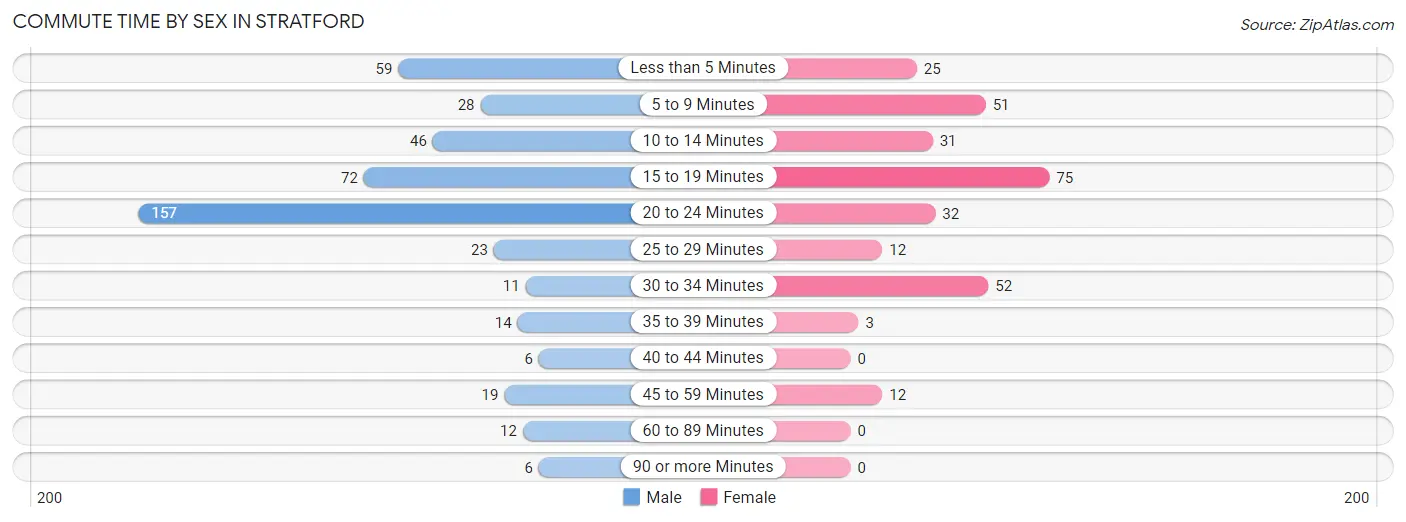
| Commute Time | Male | Female |
| Less than 5 Minutes | 59 (13.0%) | 25 (8.5%) |
| 5 to 9 Minutes | 28 (6.2%) | 51 (17.4%) |
| 10 to 14 Minutes | 46 (10.2%) | 31 (10.6%) |
| 15 to 19 Minutes | 72 (15.9%) | 75 (25.6%) |
| 20 to 24 Minutes | 157 (34.7%) | 32 (10.9%) |
| 25 to 29 Minutes | 23 (5.1%) | 12 (4.1%) |
| 30 to 34 Minutes | 11 (2.4%) | 52 (17.7%) |
| 35 to 39 Minutes | 14 (3.1%) | 3 (1.0%) |
| 40 to 44 Minutes | 6 (1.3%) | 0 (0.0%) |
| 45 to 59 Minutes | 19 (4.2%) | 12 (4.1%) |
| 60 to 89 Minutes | 12 (2.6%) | 0 (0.0%) |
| 90 or more Minutes | 6 (1.3%) | 0 (0.0%) |
Time of Departure to Work by Sex in Stratford
The most frequent times of departure to work in Stratford are 4:00 PM to 11:59 PM (82, 18.1%) for males and 7:00 AM to 7:29 AM (57, 19.5%) for females.
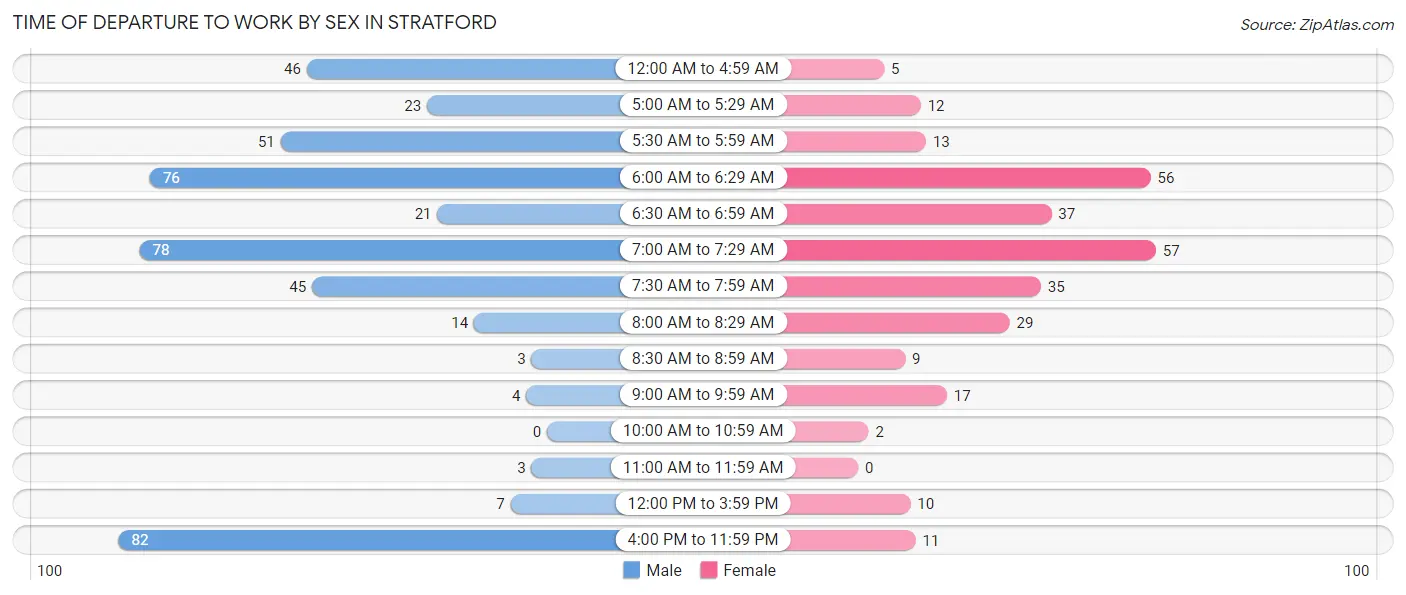
| Time of Departure | Male | Female |
| 12:00 AM to 4:59 AM | 46 (10.2%) | 5 (1.7%) |
| 5:00 AM to 5:29 AM | 23 (5.1%) | 12 (4.1%) |
| 5:30 AM to 5:59 AM | 51 (11.3%) | 13 (4.4%) |
| 6:00 AM to 6:29 AM | 76 (16.8%) | 56 (19.1%) |
| 6:30 AM to 6:59 AM | 21 (4.6%) | 37 (12.6%) |
| 7:00 AM to 7:29 AM | 78 (17.2%) | 57 (19.5%) |
| 7:30 AM to 7:59 AM | 45 (9.9%) | 35 (11.9%) |
| 8:00 AM to 8:29 AM | 14 (3.1%) | 29 (9.9%) |
| 8:30 AM to 8:59 AM | 3 (0.7%) | 9 (3.1%) |
| 9:00 AM to 9:59 AM | 4 (0.9%) | 17 (5.8%) |
| 10:00 AM to 10:59 AM | 0 (0.0%) | 2 (0.7%) |
| 11:00 AM to 11:59 AM | 3 (0.7%) | 0 (0.0%) |
| 12:00 PM to 3:59 PM | 7 (1.5%) | 10 (3.4%) |
| 4:00 PM to 11:59 PM | 82 (18.1%) | 11 (3.7%) |
| Total | 453 (100.0%) | 293 (100.0%) |
Housing Occupancy in Stratford
Occupancy by Ownership in Stratford
Of the total 626 dwellings in Stratford, owner-occupied units account for 476 (76.0%), while renter-occupied units make up 150 (24.0%).
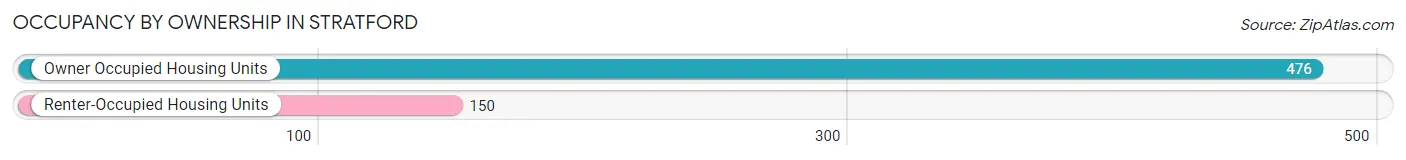
| Occupancy | # Housing Units | % Housing Units |
| Owner Occupied Housing Units | 476 | 76.0% |
| Renter-Occupied Housing Units | 150 | 24.0% |
| Total Occupied Housing Units | 626 | 100.0% |
Occupancy by Household Size in Stratford
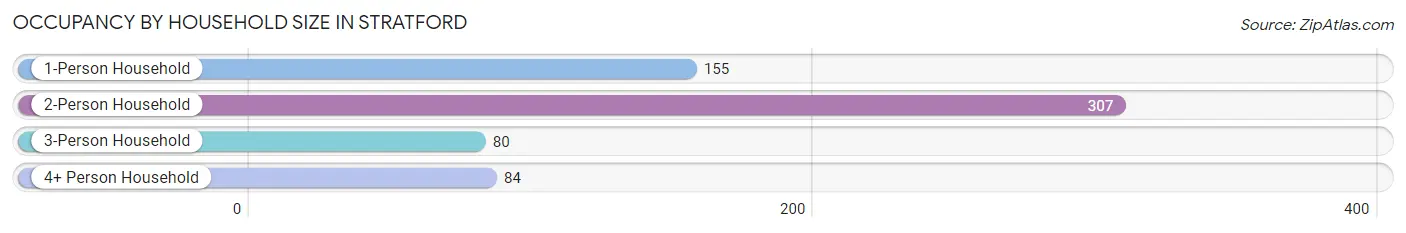
| Household Size | # Housing Units | % Housing Units |
| 1-Person Household | 155 | 24.8% |
| 2-Person Household | 307 | 49.0% |
| 3-Person Household | 80 | 12.8% |
| 4+ Person Household | 84 | 13.4% |
| Total Housing Units | 626 | 100.0% |
Occupancy by Ownership by Household Size in Stratford
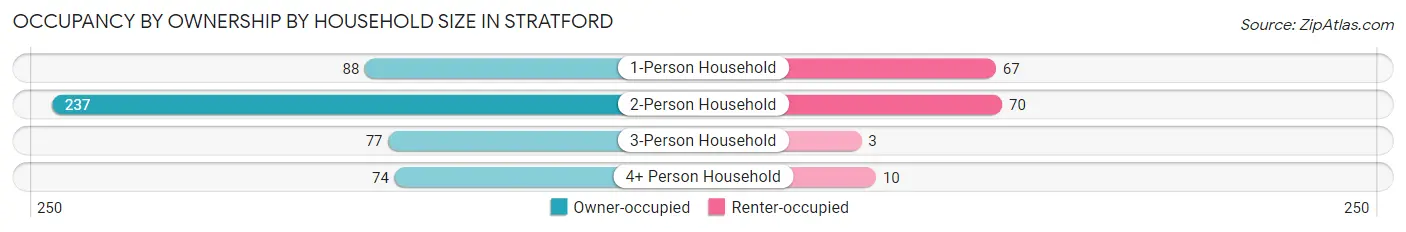
| Household Size | Owner-occupied | Renter-occupied |
| 1-Person Household | 88 (56.8%) | 67 (43.2%) |
| 2-Person Household | 237 (77.2%) | 70 (22.8%) |
| 3-Person Household | 77 (96.3%) | 3 (3.7%) |
| 4+ Person Household | 74 (88.1%) | 10 (11.9%) |
| Total Housing Units | 476 (76.0%) | 150 (24.0%) |
Occupancy by Educational Attainment in Stratford
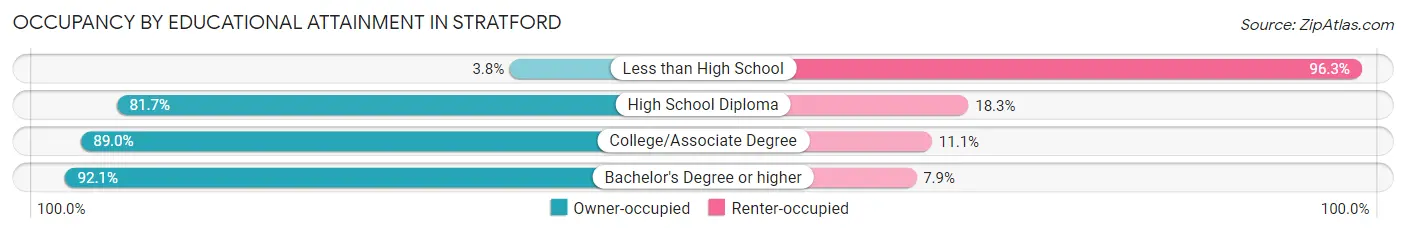
| Household Size | Owner-occupied | Renter-occupied |
| Less than High School | 3 (3.7%) | 77 (96.3%) |
| High School Diploma | 188 (81.7%) | 42 (18.3%) |
| College/Associate Degree | 169 (88.9%) | 21 (11.1%) |
| Bachelor's Degree or higher | 116 (92.1%) | 10 (7.9%) |
Occupancy by Age of Householder in Stratford
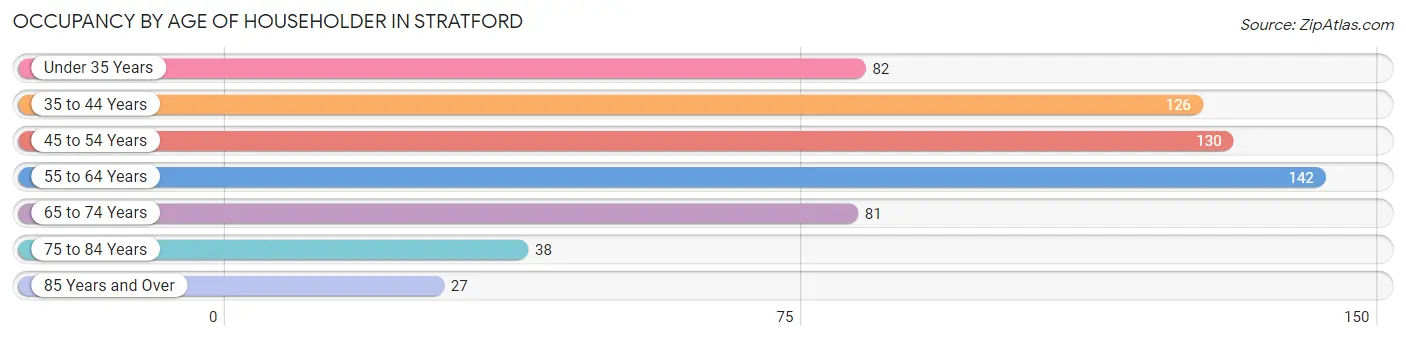
| Age Bracket | # Households | % Households |
| Under 35 Years | 82 | 13.1% |
| 35 to 44 Years | 126 | 20.1% |
| 45 to 54 Years | 130 | 20.8% |
| 55 to 64 Years | 142 | 22.7% |
| 65 to 74 Years | 81 | 12.9% |
| 75 to 84 Years | 38 | 6.1% |
| 85 Years and Over | 27 | 4.3% |
| Total | 626 | 100.0% |
Housing Finances in Stratford
Median Income by Occupancy in Stratford
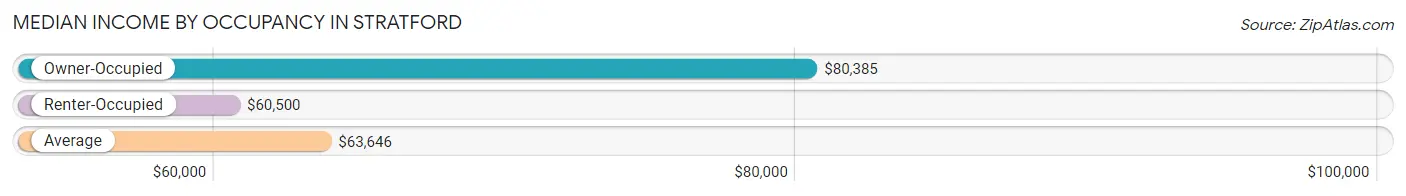
| Occupancy Type | # Households | Median Income |
| Owner-Occupied | 476 (76.0%) | $80,385 |
| Renter-Occupied | 150 (24.0%) | $60,500 |
| Average | 626 (100.0%) | $63,646 |
Occupancy by Householder Income Bracket in Stratford
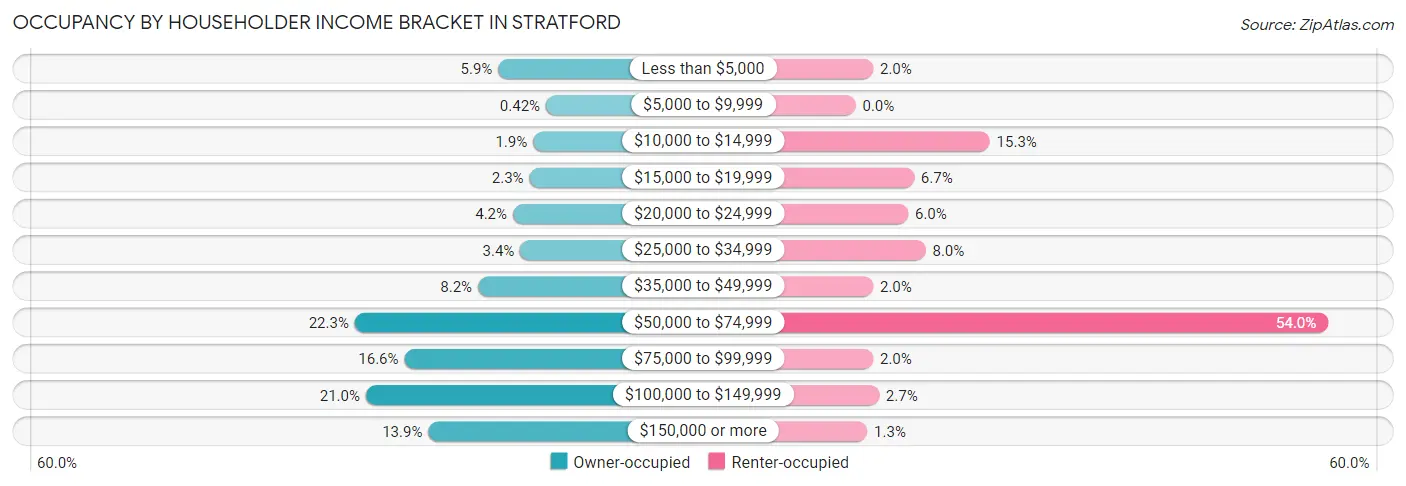
| Income Bracket | Owner-occupied | Renter-occupied |
| Less than $5,000 | 28 (5.9%) | 3 (2.0%) |
| $5,000 to $9,999 | 2 (0.4%) | 0 (0.0%) |
| $10,000 to $14,999 | 9 (1.9%) | 23 (15.3%) |
| $15,000 to $19,999 | 11 (2.3%) | 10 (6.7%) |
| $20,000 to $24,999 | 20 (4.2%) | 9 (6.0%) |
| $25,000 to $34,999 | 16 (3.4%) | 12 (8.0%) |
| $35,000 to $49,999 | 39 (8.2%) | 3 (2.0%) |
| $50,000 to $74,999 | 106 (22.3%) | 81 (54.0%) |
| $75,000 to $99,999 | 79 (16.6%) | 3 (2.0%) |
| $100,000 to $149,999 | 100 (21.0%) | 4 (2.7%) |
| $150,000 or more | 66 (13.9%) | 2 (1.3%) |
| Total | 476 (100.0%) | 150 (100.0%) |
Monthly Housing Cost Tiers in Stratford
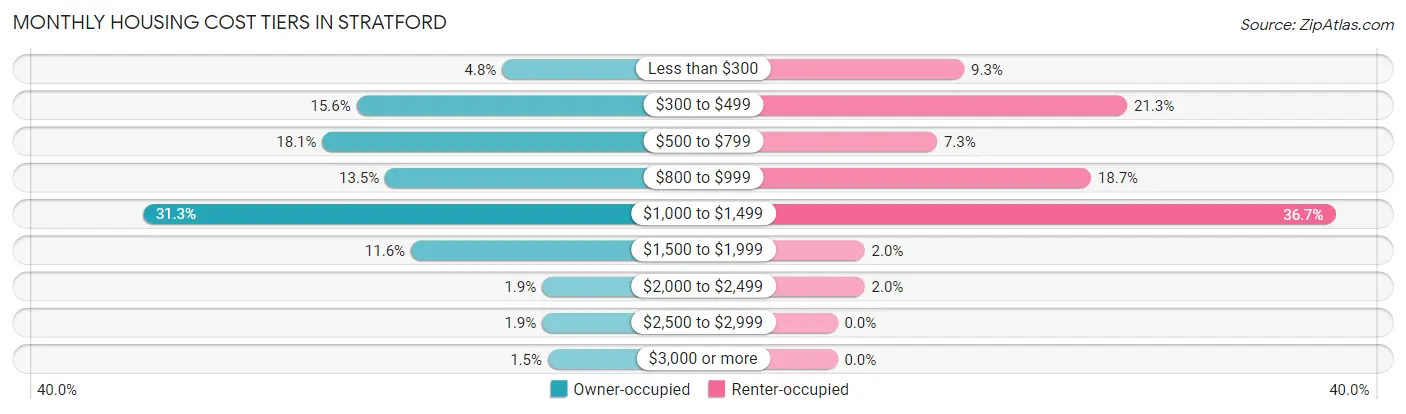
| Monthly Cost | Owner-occupied | Renter-occupied |
| Less than $300 | 23 (4.8%) | 14 (9.3%) |
| $300 to $499 | 74 (15.5%) | 32 (21.3%) |
| $500 to $799 | 86 (18.1%) | 11 (7.3%) |
| $800 to $999 | 64 (13.5%) | 28 (18.7%) |
| $1,000 to $1,499 | 149 (31.3%) | 55 (36.7%) |
| $1,500 to $1,999 | 55 (11.6%) | 3 (2.0%) |
| $2,000 to $2,499 | 9 (1.9%) | 3 (2.0%) |
| $2,500 to $2,999 | 9 (1.9%) | 0 (0.0%) |
| $3,000 or more | 7 (1.5%) | 0 (0.0%) |
| Total | 476 (100.0%) | 150 (100.0%) |
Physical Housing Characteristics in Stratford
Housing Structures in Stratford
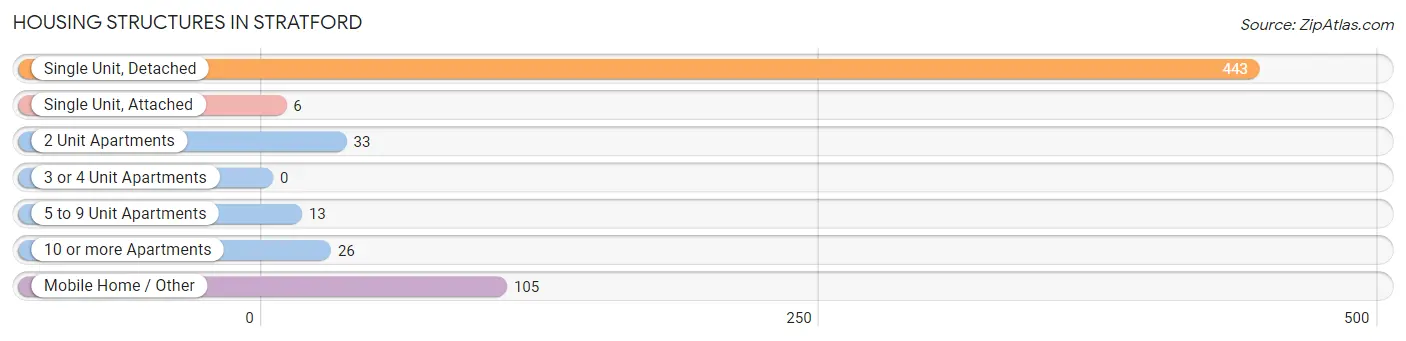
| Structure Type | # Housing Units | % Housing Units |
| Single Unit, Detached | 443 | 70.8% |
| Single Unit, Attached | 6 | 1.0% |
| 2 Unit Apartments | 33 | 5.3% |
| 3 or 4 Unit Apartments | 0 | 0.0% |
| 5 to 9 Unit Apartments | 13 | 2.1% |
| 10 or more Apartments | 26 | 4.2% |
| Mobile Home / Other | 105 | 16.8% |
| Total | 626 | 100.0% |
Housing Structures by Occupancy in Stratford
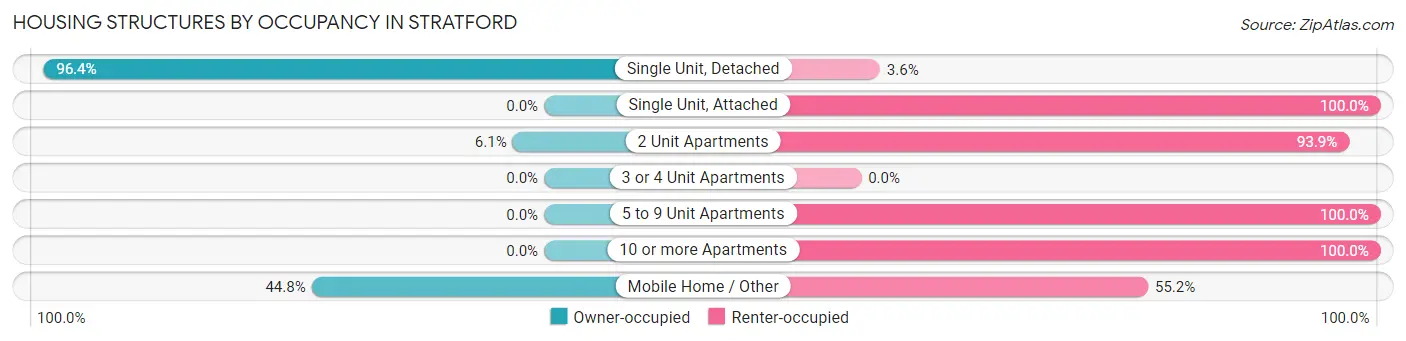
| Structure Type | Owner-occupied | Renter-occupied |
| Single Unit, Detached | 427 (96.4%) | 16 (3.6%) |
| Single Unit, Attached | 0 (0.0%) | 6 (100.0%) |
| 2 Unit Apartments | 2 (6.1%) | 31 (93.9%) |
| 3 or 4 Unit Apartments | 0 (0.0%) | 0 (0.0%) |
| 5 to 9 Unit Apartments | 0 (0.0%) | 13 (100.0%) |
| 10 or more Apartments | 0 (0.0%) | 26 (100.0%) |
| Mobile Home / Other | 47 (44.8%) | 58 (55.2%) |
| Total | 476 (76.0%) | 150 (24.0%) |
Housing Structures by Number of Rooms in Stratford
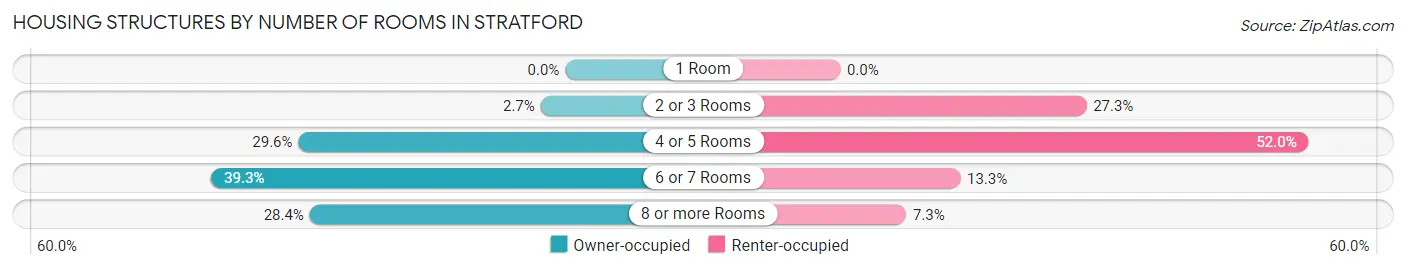
| Number of Rooms | Owner-occupied | Renter-occupied |
| 1 Room | 0 (0.0%) | 0 (0.0%) |
| 2 or 3 Rooms | 13 (2.7%) | 41 (27.3%) |
| 4 or 5 Rooms | 141 (29.6%) | 78 (52.0%) |
| 6 or 7 Rooms | 187 (39.3%) | 20 (13.3%) |
| 8 or more Rooms | 135 (28.4%) | 11 (7.3%) |
| Total | 476 (100.0%) | 150 (100.0%) |
Housing Structure by Heating Type in Stratford
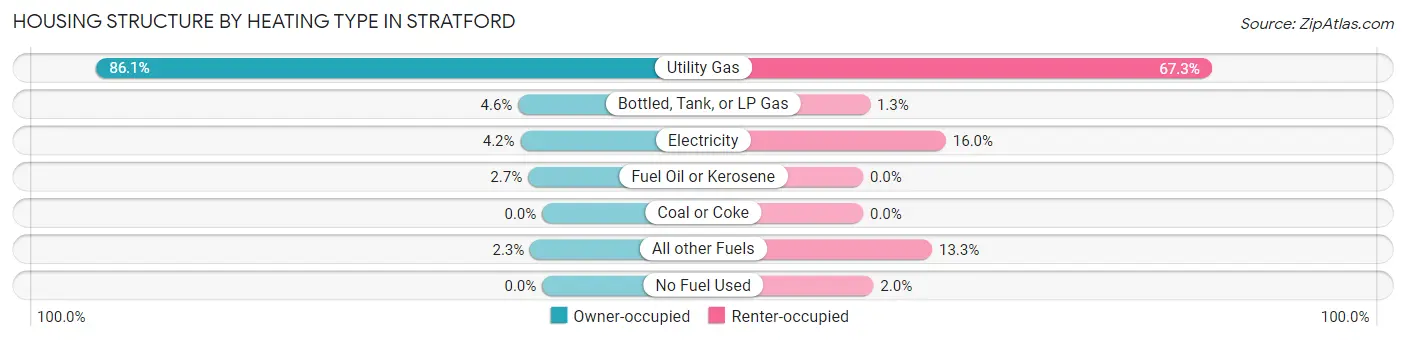
| Heating Type | Owner-occupied | Renter-occupied |
| Utility Gas | 410 (86.1%) | 101 (67.3%) |
| Bottled, Tank, or LP Gas | 22 (4.6%) | 2 (1.3%) |
| Electricity | 20 (4.2%) | 24 (16.0%) |
| Fuel Oil or Kerosene | 13 (2.7%) | 0 (0.0%) |
| Coal or Coke | 0 (0.0%) | 0 (0.0%) |
| All other Fuels | 11 (2.3%) | 20 (13.3%) |
| No Fuel Used | 0 (0.0%) | 3 (2.0%) |
| Total | 476 (100.0%) | 150 (100.0%) |
Household Vehicle Usage in Stratford
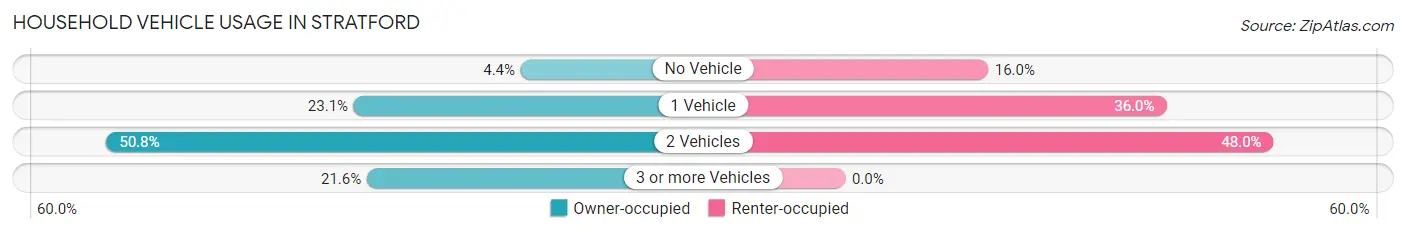
| Vehicles per Household | Owner-occupied | Renter-occupied |
| No Vehicle | 21 (4.4%) | 24 (16.0%) |
| 1 Vehicle | 110 (23.1%) | 54 (36.0%) |
| 2 Vehicles | 242 (50.8%) | 72 (48.0%) |
| 3 or more Vehicles | 103 (21.6%) | 0 (0.0%) |
| Total | 476 (100.0%) | 150 (100.0%) |
Real Estate & Mortgages in Stratford
Real Estate and Mortgage Overview in Stratford
| Characteristic | Without Mortgage | With Mortgage |
| Housing Units | 223 | 253 |
| Median Property Value | $152,100 | $211,800 |
| Median Household Income | $58,417 | $25 |
| Monthly Housing Costs | $540 | $7 |
| Real Estate Taxes | $2,689 | $3 |
Property Value by Mortgage Status in Stratford
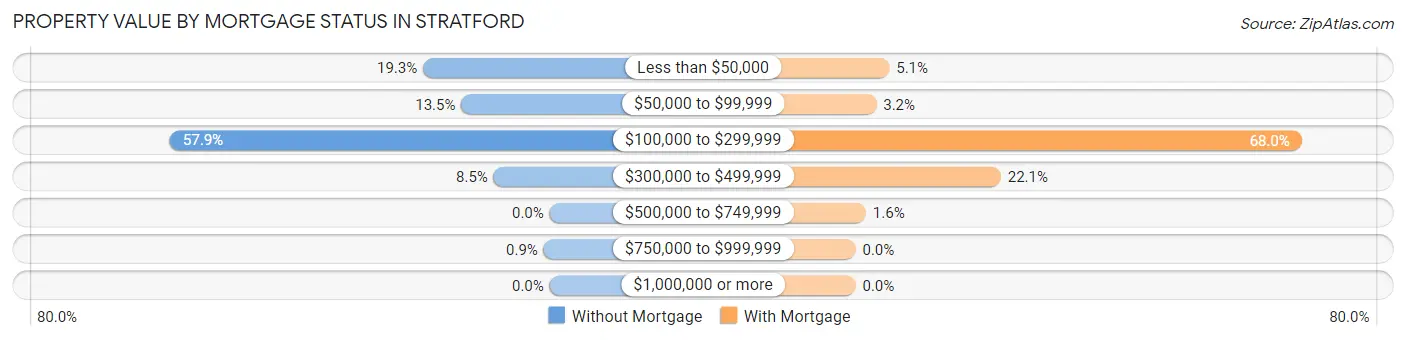
| Property Value | Without Mortgage | With Mortgage |
| Less than $50,000 | 43 (19.3%) | 13 (5.1%) |
| $50,000 to $99,999 | 30 (13.5%) | 8 (3.2%) |
| $100,000 to $299,999 | 129 (57.9%) | 172 (68.0%) |
| $300,000 to $499,999 | 19 (8.5%) | 56 (22.1%) |
| $500,000 to $749,999 | 0 (0.0%) | 4 (1.6%) |
| $750,000 to $999,999 | 2 (0.9%) | 0 (0.0%) |
| $1,000,000 or more | 0 (0.0%) | 0 (0.0%) |
| Total | 223 (100.0%) | 253 (100.0%) |
Household Income by Mortgage Status in Stratford
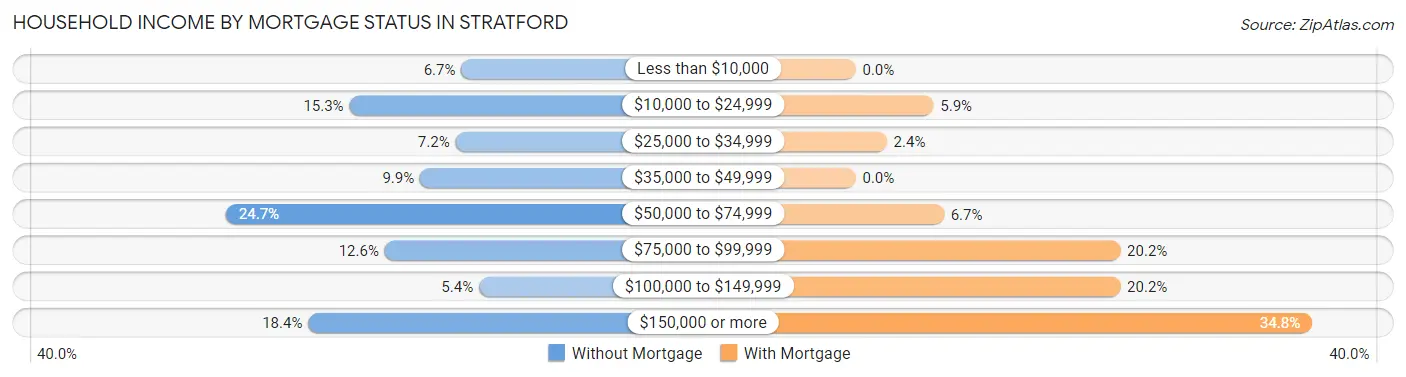
| Household Income | Without Mortgage | With Mortgage |
| Less than $10,000 | 15 (6.7%) | 0 (0.0%) |
| $10,000 to $24,999 | 34 (15.2%) | 15 (5.9%) |
| $25,000 to $34,999 | 16 (7.2%) | 6 (2.4%) |
| $35,000 to $49,999 | 22 (9.9%) | 0 (0.0%) |
| $50,000 to $74,999 | 55 (24.7%) | 17 (6.7%) |
| $75,000 to $99,999 | 28 (12.6%) | 51 (20.2%) |
| $100,000 to $149,999 | 12 (5.4%) | 51 (20.2%) |
| $150,000 or more | 41 (18.4%) | 88 (34.8%) |
| Total | 223 (100.0%) | 253 (100.0%) |
Property Value to Household Income Ratio in Stratford
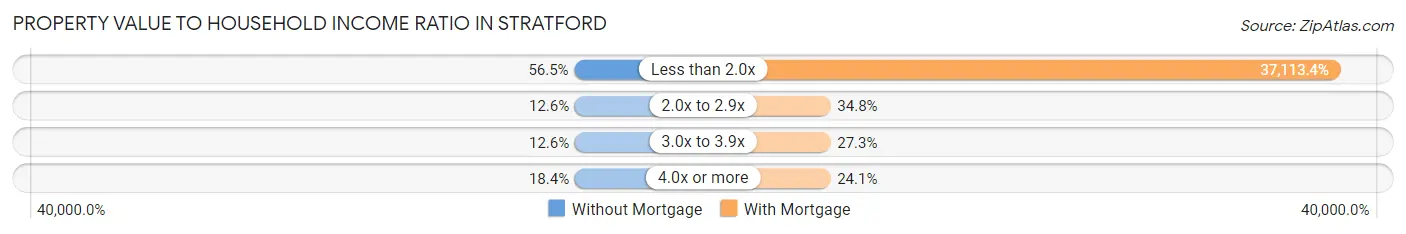
| Value-to-Income Ratio | Without Mortgage | With Mortgage |
| Less than 2.0x | 126 (56.5%) | 93,897 (37,113.4%) |
| 2.0x to 2.9x | 28 (12.6%) | 88 (34.8%) |
| 3.0x to 3.9x | 28 (12.6%) | 69 (27.3%) |
| 4.0x or more | 41 (18.4%) | 61 (24.1%) |
| Total | 223 (100.0%) | 253 (100.0%) |
Real Estate Taxes by Mortgage Status in Stratford
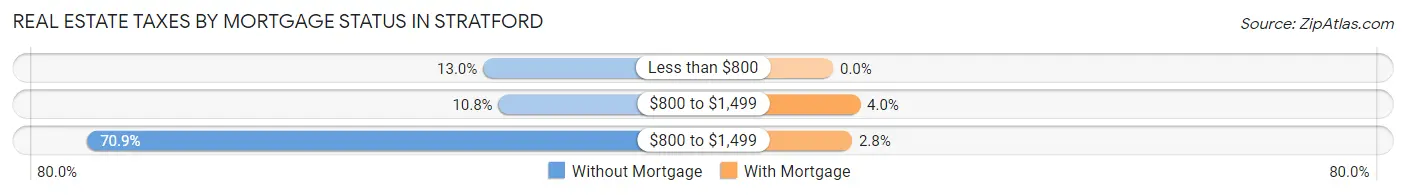
| Property Taxes | Without Mortgage | With Mortgage |
| Less than $800 | 29 (13.0%) | 0 (0.0%) |
| $800 to $1,499 | 24 (10.8%) | 10 (4.0%) |
| $800 to $1,499 | 158 (70.9%) | 7 (2.8%) |
| Total | 223 (100.0%) | 253 (100.0%) |
Health & Disability in Stratford
Health Insurance Coverage by Age in Stratford
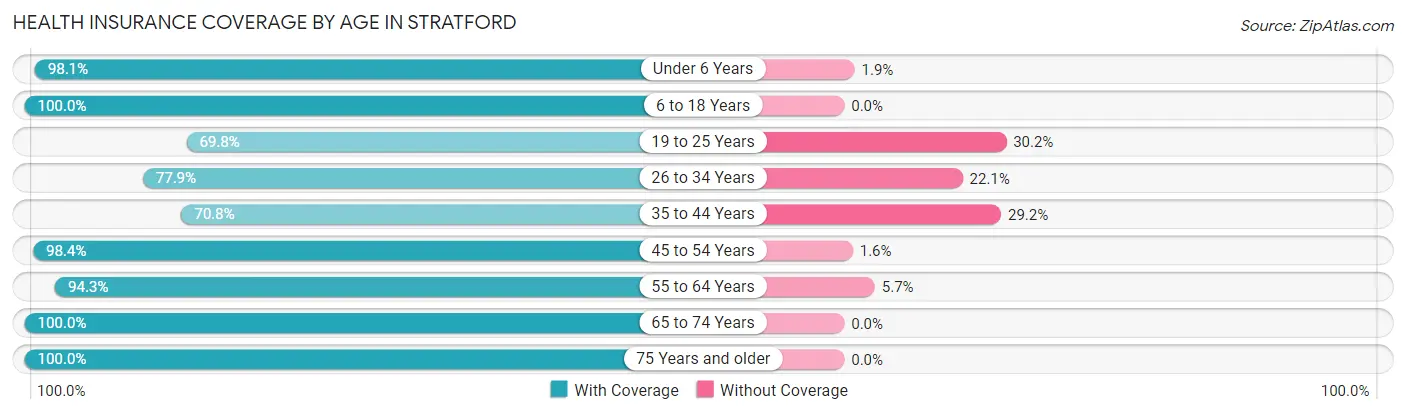
| Age Bracket | With Coverage | Without Coverage |
| Under 6 Years | 102 (98.1%) | 2 (1.9%) |
| 6 to 18 Years | 200 (100.0%) | 0 (0.0%) |
| 19 to 25 Years | 37 (69.8%) | 16 (30.2%) |
| 26 to 34 Years | 106 (77.9%) | 30 (22.1%) |
| 35 to 44 Years | 138 (70.8%) | 57 (29.2%) |
| 45 to 54 Years | 187 (98.4%) | 3 (1.6%) |
| 55 to 64 Years | 248 (94.3%) | 15 (5.7%) |
| 65 to 74 Years | 134 (100.0%) | 0 (0.0%) |
| 75 Years and older | 89 (100.0%) | 0 (0.0%) |
| Total | 1,241 (91.0%) | 123 (9.0%) |
Health Insurance Coverage by Citizenship Status in Stratford
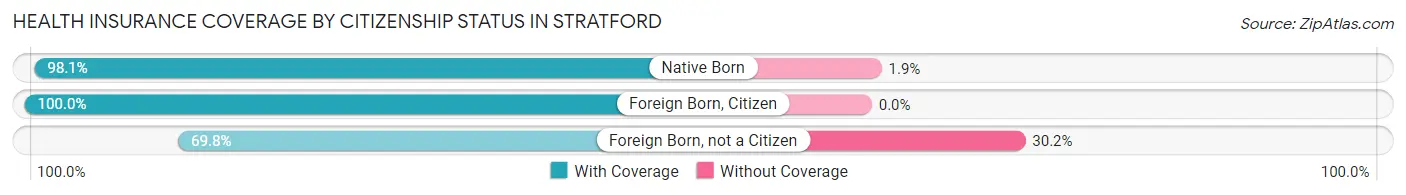
| Citizenship Status | With Coverage | Without Coverage |
| Native Born | 102 (98.1%) | 2 (1.9%) |
| Foreign Born, Citizen | 200 (100.0%) | 0 (0.0%) |
| Foreign Born, not a Citizen | 37 (69.8%) | 16 (30.2%) |
Health Insurance Coverage by Household Income in Stratford
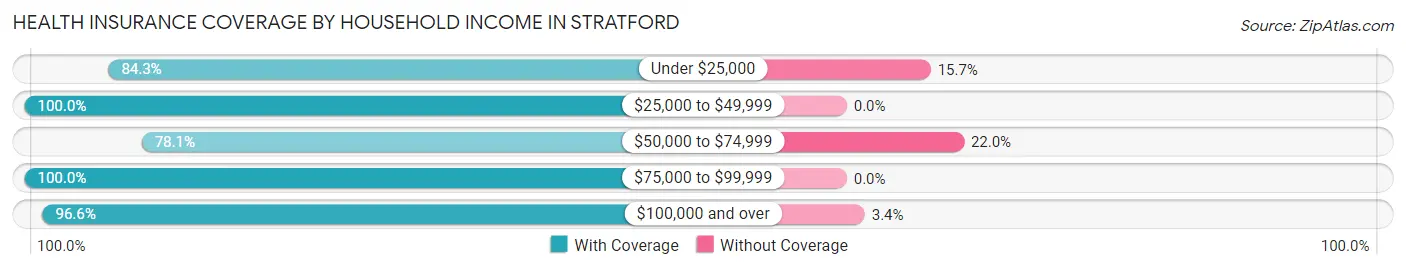
| Household Income | With Coverage | Without Coverage |
| Under $25,000 | 134 (84.3%) | 25 (15.7%) |
| $25,000 to $49,999 | 120 (100.0%) | 0 (0.0%) |
| $50,000 to $74,999 | 288 (78.0%) | 81 (22.0%) |
| $75,000 to $99,999 | 195 (100.0%) | 0 (0.0%) |
| $100,000 and over | 487 (96.6%) | 17 (3.4%) |
Public vs Private Health Insurance Coverage by Age in Stratford
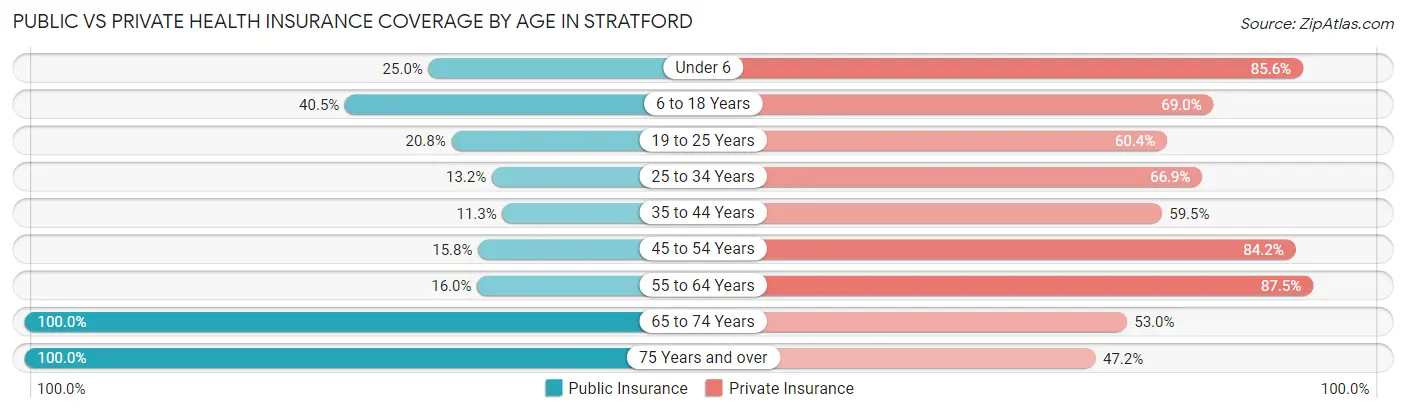
| Age Bracket | Public Insurance | Private Insurance |
| Under 6 | 26 (25.0%) | 89 (85.6%) |
| 6 to 18 Years | 81 (40.5%) | 138 (69.0%) |
| 19 to 25 Years | 11 (20.7%) | 32 (60.4%) |
| 25 to 34 Years | 18 (13.2%) | 91 (66.9%) |
| 35 to 44 Years | 22 (11.3%) | 116 (59.5%) |
| 45 to 54 Years | 30 (15.8%) | 160 (84.2%) |
| 55 to 64 Years | 42 (16.0%) | 230 (87.5%) |
| 65 to 74 Years | 134 (100.0%) | 71 (53.0%) |
| 75 Years and over | 89 (100.0%) | 42 (47.2%) |
| Total | 453 (33.2%) | 969 (71.0%) |
Disability Status by Sex by Age in Stratford
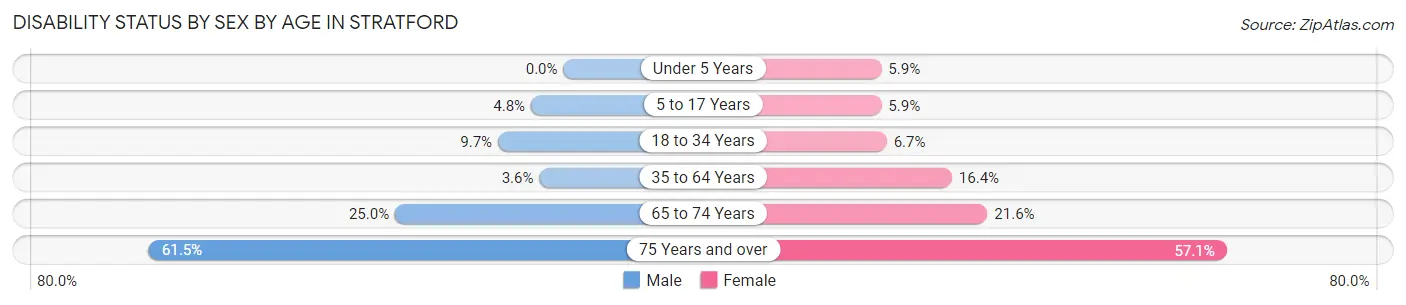
| Age Bracket | Male | Female |
| Under 5 Years | 0 (0.0%) | 2 (5.9%) |
| 5 to 17 Years | 5 (4.8%) | 6 (5.9%) |
| 18 to 34 Years | 10 (9.7%) | 6 (6.7%) |
| 35 to 64 Years | 12 (3.6%) | 51 (16.4%) |
| 65 to 74 Years | 15 (25.0%) | 16 (21.6%) |
| 75 Years and over | 16 (61.5%) | 36 (57.1%) |
Disability Class by Sex by Age in Stratford
Disability Class: Hearing Difficulty
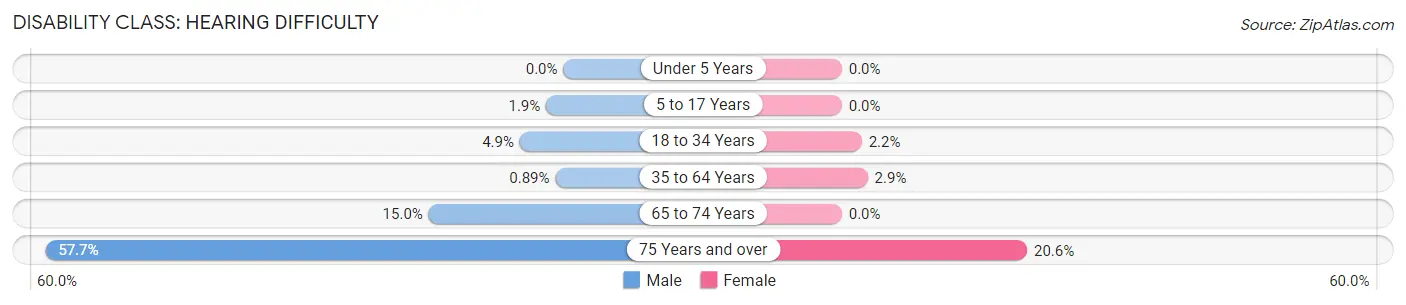
| Age Bracket | Male | Female |
| Under 5 Years | 0 (0.0%) | 0 (0.0%) |
| 5 to 17 Years | 2 (1.9%) | 0 (0.0%) |
| 18 to 34 Years | 5 (4.9%) | 2 (2.2%) |
| 35 to 64 Years | 3 (0.9%) | 9 (2.9%) |
| 65 to 74 Years | 9 (15.0%) | 0 (0.0%) |
| 75 Years and over | 15 (57.7%) | 13 (20.6%) |
Disability Class: Vision Difficulty
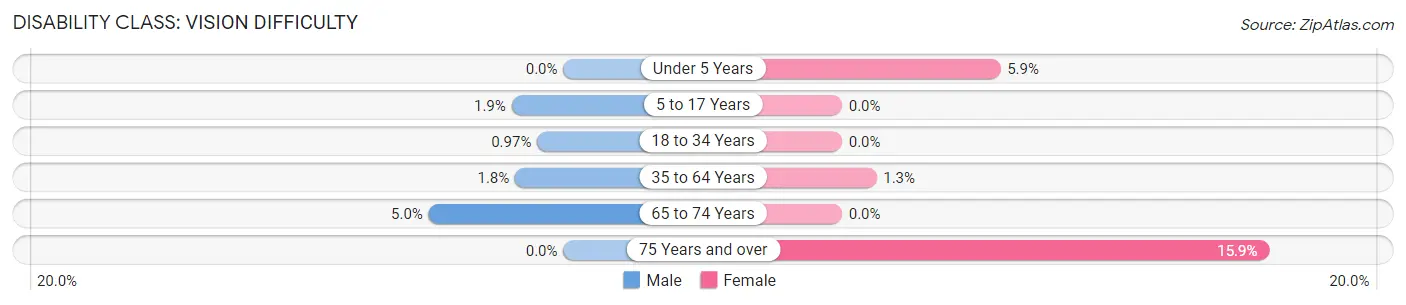
| Age Bracket | Male | Female |
| Under 5 Years | 0 (0.0%) | 2 (5.9%) |
| 5 to 17 Years | 2 (1.9%) | 0 (0.0%) |
| 18 to 34 Years | 1 (1.0%) | 0 (0.0%) |
| 35 to 64 Years | 6 (1.8%) | 4 (1.3%) |
| 65 to 74 Years | 3 (5.0%) | 0 (0.0%) |
| 75 Years and over | 0 (0.0%) | 10 (15.9%) |
Disability Class: Cognitive Difficulty
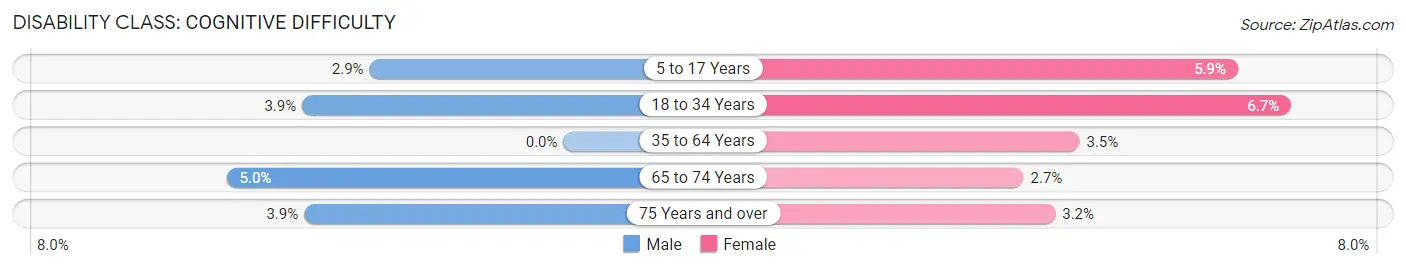
| Age Bracket | Male | Female |
| 5 to 17 Years | 3 (2.9%) | 6 (5.9%) |
| 18 to 34 Years | 4 (3.9%) | 6 (6.7%) |
| 35 to 64 Years | 0 (0.0%) | 11 (3.5%) |
| 65 to 74 Years | 3 (5.0%) | 2 (2.7%) |
| 75 Years and over | 1 (3.8%) | 2 (3.2%) |
Disability Class: Ambulatory Difficulty
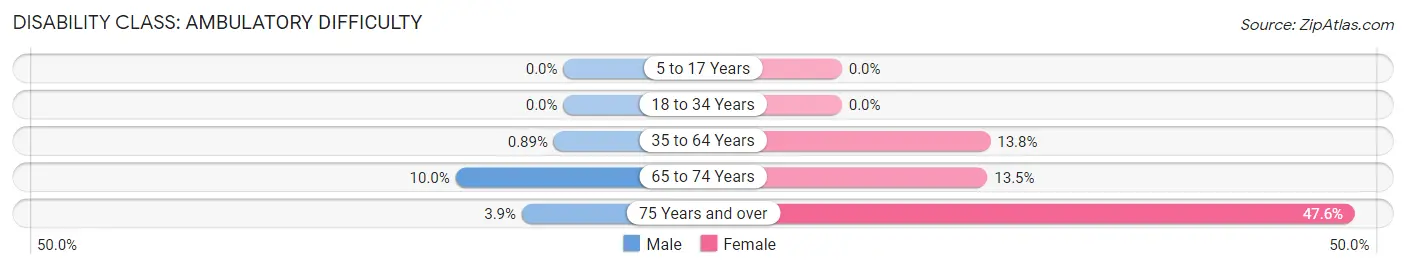
| Age Bracket | Male | Female |
| 5 to 17 Years | 0 (0.0%) | 0 (0.0%) |
| 18 to 34 Years | 0 (0.0%) | 0 (0.0%) |
| 35 to 64 Years | 3 (0.9%) | 43 (13.8%) |
| 65 to 74 Years | 6 (10.0%) | 10 (13.5%) |
| 75 Years and over | 1 (3.8%) | 30 (47.6%) |
Disability Class: Self-Care Difficulty
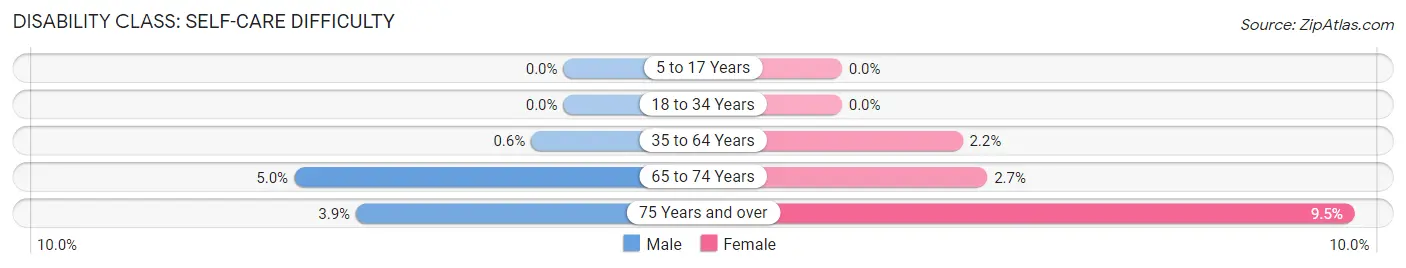
| Age Bracket | Male | Female |
| 5 to 17 Years | 0 (0.0%) | 0 (0.0%) |
| 18 to 34 Years | 0 (0.0%) | 0 (0.0%) |
| 35 to 64 Years | 2 (0.6%) | 7 (2.2%) |
| 65 to 74 Years | 3 (5.0%) | 2 (2.7%) |
| 75 Years and over | 1 (3.8%) | 6 (9.5%) |
Technology Access in Stratford
Computing Device Access in Stratford
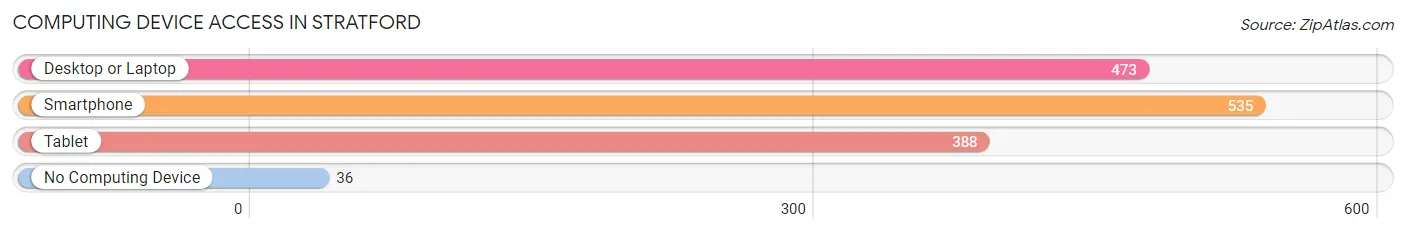
| Device Type | # Households | % Households |
| Desktop or Laptop | 473 | 75.6% |
| Smartphone | 535 | 85.5% |
| Tablet | 388 | 62.0% |
| No Computing Device | 36 | 5.8% |
| Total | 626 | 100.0% |
Internet Access in Stratford
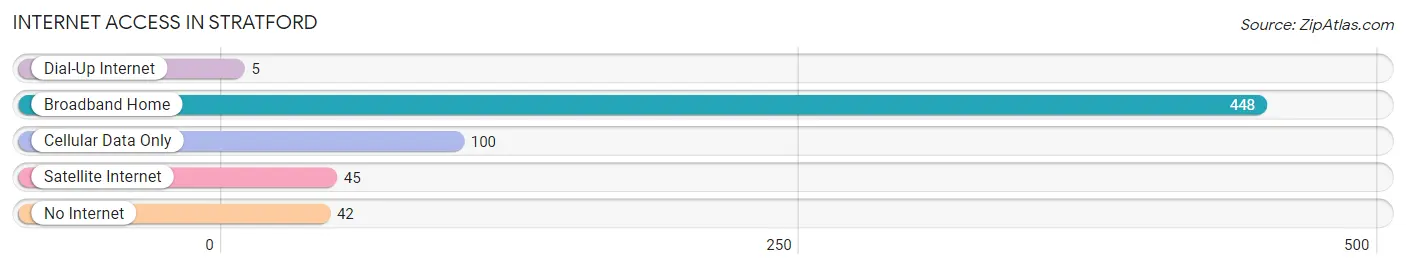
| Internet Type | # Households | % Households |
| Dial-Up Internet | 5 | 0.8% |
| Broadband Home | 448 | 71.6% |
| Cellular Data Only | 100 | 16.0% |
| Satellite Internet | 45 | 7.2% |
| No Internet | 42 | 6.7% |
| Total | 626 | 100.0% |
Stratford Summary
Stratford is a village located in Marathon County, Wisconsin, United States. The population was 1,845 at the 2010 census. It is part of the Wausau, Wisconsin Metropolitan Statistical Area.
History
Stratford was founded in 1876 by a group of settlers from Stratford, Ontario, Canada. The village was named after the Canadian city, and the settlers brought with them many of the same customs and traditions. The first settlers were mostly of German and Irish descent, and the village quickly grew to become a thriving agricultural community.
In the early 1900s, Stratford began to experience a period of industrial growth. The first industry to arrive was the Stratford Canning Company, which opened in 1906. This was followed by the opening of the Stratford Creamery in 1908, and the Stratford Cheese Company in 1910. These industries provided employment for many of the village’s residents, and helped to spur further growth.
In the 1920s, Stratford experienced a period of rapid growth. The village was incorporated in 1923, and the population had grown to 1,500 by 1930. This growth was largely due to the arrival of the Chicago and Northwestern Railroad, which provided a direct connection to the larger cities of Wisconsin.
Geography
Stratford is located at 44°45'17" North, 89°45'17" West (44.754722, -89.754722). According to the United States Census Bureau, the village has a total area of 1.3 square miles (3.4 km2), all of it land.
Economy
Stratford’s economy is largely based on agriculture and manufacturing. The village is home to several large farms, which produce a variety of crops, including corn, soybeans, and wheat. The Stratford Cheese Company is one of the largest employers in the village, and produces a variety of cheeses for sale throughout the region.
The village is also home to several small businesses, including restaurants, retail stores, and service providers. Stratford is also home to a number of small manufacturing companies, which produce a variety of products, including furniture, clothing, and automotive parts.
Demographics
As of the census of 2010, there were 1,845 people, 745 households, and 486 families residing in the village. The population density was 1,417.3 people per square mile (546.7/km2). There were 809 housing units at an average density of 617.7 per square mile (238.3/km2). The racial makeup of the village was 97.2% White, 0.2% African American, 0.2% Native American, 0.4% Asian, 0.2% from other races, and 1.9% from two or more races. Hispanic or Latino of any race were 1.2% of the population.
There were 745 households, out of which 30.2% had children under the age of 18 living with them, 49.3% were married couples living together, 9.7% had a female householder with no husband present, and 36.2% were non-families. 30.2% of all households were made up of individuals, and 14.2% had someone living alone who was 65 years of age or older. The average household size was 2.45 and the average family size was 3.06.
In the village, the population was spread out, with 25.2% under the age of 18, 7.2% from 18 to 24, 28.2% from 25 to 44, 22.2% from 45 to 64, and 17.2% who were 65 years of age or older. The median age was 38 years. For every 100 females, there were 97.2 males. For every 100 females age 18 and over, there were 94.2 males.
The median income for a household in the village was $41,250, and the median income for a family was $50,000. Males had a median income of $35,000 versus $25,000 for females. The per capita income for the village was $19,945. About 4.2% of families and 6.2% of the population were below the poverty line, including 8.2% of those under age 18 and 5.2% of those age 65 or over.
Common Questions
What is Per Capita Income in Stratford?
Per Capita income in Stratford is $41,274.
What is the Median Family Income in Stratford?
Median Family Income in Stratford is $83,889.
What is the Median Household income in Stratford?
Median Household Income in Stratford is $63,646.
What is Income or Wage Gap in Stratford?
Income or Wage Gap in Stratford is 18.4%.
Women in Stratford earn 81.6 cents for every dollar earned by a man.
What is Inequality or Gini Index in Stratford?
Inequality or Gini Index in Stratford is 0.46.
What is the Total Population of Stratford?
Total Population of Stratford is 1,364.
What is the Total Male Population of Stratford?
Total Male Population of Stratford is 689.
What is the Total Female Population of Stratford?
Total Female Population of Stratford is 675.
What is the Ratio of Males per 100 Females in Stratford?
There are 102.07 Males per 100 Females in Stratford.
What is the Ratio of Females per 100 Males in Stratford?
There are 97.97 Females per 100 Males in Stratford.
What is the Median Population Age in Stratford?
Median Population Age in Stratford is 44.3 Years.
What is the Average Family Size in Stratford
Average Family Size in Stratford is 2.6 People.
What is the Average Household Size in Stratford
Average Household Size in Stratford is 2.1 People.
How Large is the Labor Force in Stratford?
There are 834 People in the Labor Forcein in Stratford.
What is the Percentage of People in the Labor Force in Stratford?
75.1% of People are in the Labor Force in Stratford.
What is the Unemployment Rate in Stratford?
Unemployment Rate in Stratford is 1.8%.