Herbster, WI Map & Demographics
Herbster Map
Herbster Overview
$50,472
PER CAPITA INCOME
$73,333
AVG FAMILY INCOME
$61,250
AVG HOUSEHOLD INCOME
0.48
INEQUALITY / GINI INDEX
107
TOTAL POPULATION
57
MALE POPULATION
50
FEMALE POPULATION
114.00
MALES / 100 FEMALES
87.72
FEMALES / 100 MALES
61.1
MEDIAN AGE
2.1
AVG FAMILY SIZE
1.9
AVG HOUSEHOLD SIZE
61
LABOR FORCE [ PEOPLE ]
57.0%
PERCENT IN LABOR FORCE
Herbster Zip Codes
Herbster Area Codes
Income in Herbster
Income Overview in Herbster
Per Capita Income in Herbster is $50,472, while median incomes of families and households are $73,333 and $61,250 respectively.
| Characteristic | Number | Measure |
| Per Capita Income | 107 | $50,472 |
| Median Family Income | 42 | $73,333 |
| Mean Family Income | 42 | $112,160 |
| Median Household Income | 55 | $61,250 |
| Mean Household Income | 55 | $100,404 |
| Income Deficit | 42 | $0 |
| Wage / Income Gap (%) | 107 | 0.00% |
| Wage / Income Gap ($) | 107 | 100.00¢ per $1 |
| Gini / Inequality Index | 107 | 0.48 |
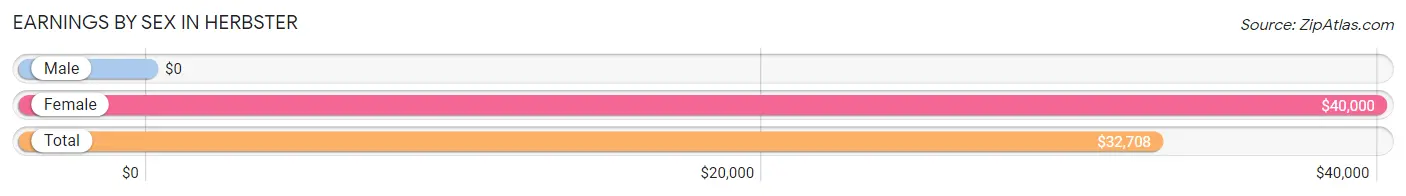
Earnings by Sex in Herbster
| Sex | Number | Average Earnings |
| Male | 27 (42.9%) | $0 |
| Female | 36 (57.1%) | $40,000 |
| Total | 63 (100.0%) | $32,708 |
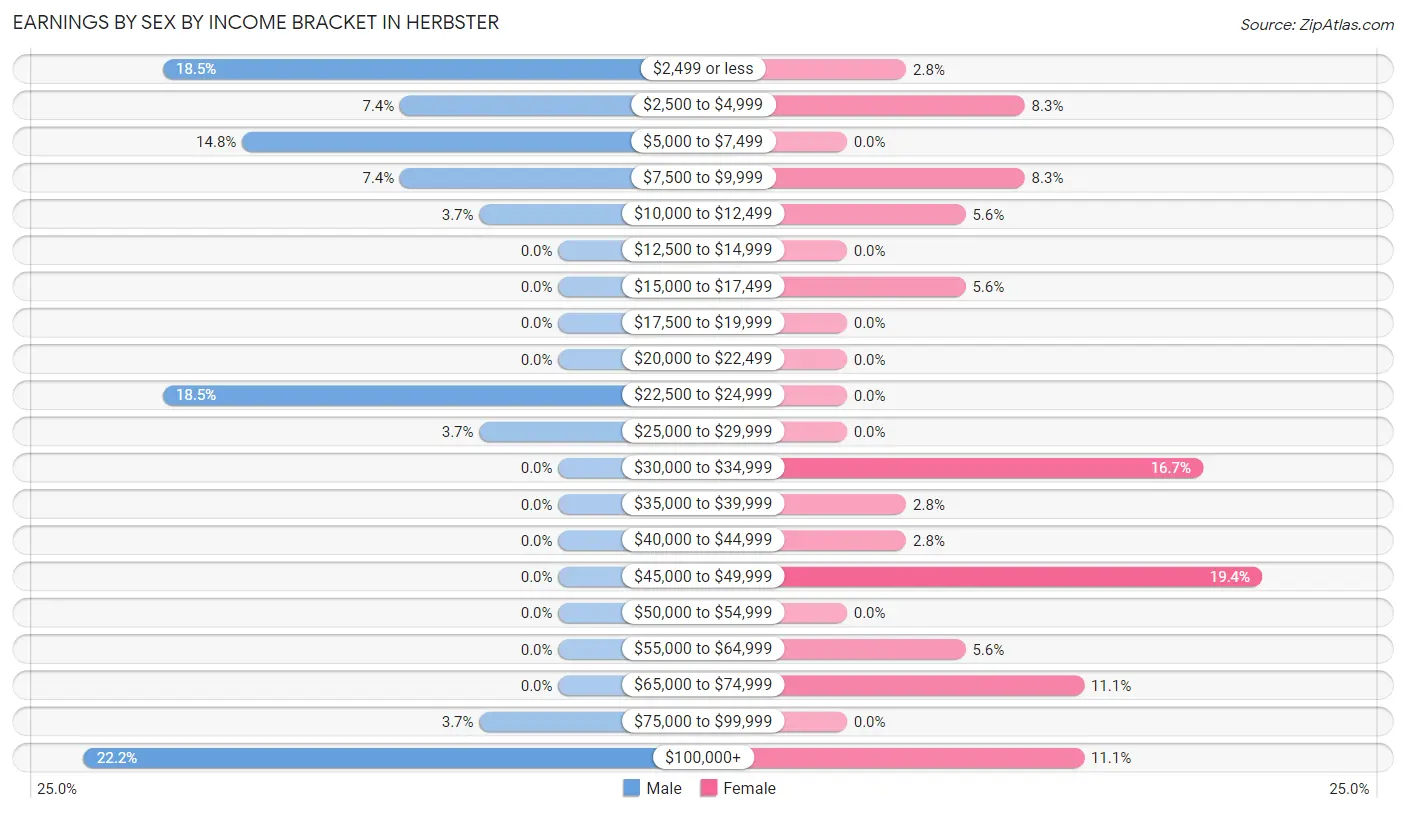
Earnings by Sex by Income Bracket in Herbster
The most common earnings brackets in Herbster are $100,000+ for men (6 | 22.2%) and $45,000 to $49,999 for women (7 | 19.4%).
| Income | Male | Female |
| $2,499 or less | 5 (18.5%) | 1 (2.8%) |
| $2,500 to $4,999 | 2 (7.4%) | 3 (8.3%) |
| $5,000 to $7,499 | 4 (14.8%) | 0 (0.0%) |
| $7,500 to $9,999 | 2 (7.4%) | 3 (8.3%) |
| $10,000 to $12,499 | 1 (3.7%) | 2 (5.6%) |
| $12,500 to $14,999 | 0 (0.0%) | 0 (0.0%) |
| $15,000 to $17,499 | 0 (0.0%) | 2 (5.6%) |
| $17,500 to $19,999 | 0 (0.0%) | 0 (0.0%) |
| $20,000 to $22,499 | 0 (0.0%) | 0 (0.0%) |
| $22,500 to $24,999 | 5 (18.5%) | 0 (0.0%) |
| $25,000 to $29,999 | 1 (3.7%) | 0 (0.0%) |
| $30,000 to $34,999 | 0 (0.0%) | 6 (16.7%) |
| $35,000 to $39,999 | 0 (0.0%) | 1 (2.8%) |
| $40,000 to $44,999 | 0 (0.0%) | 1 (2.8%) |
| $45,000 to $49,999 | 0 (0.0%) | 7 (19.4%) |
| $50,000 to $54,999 | 0 (0.0%) | 0 (0.0%) |
| $55,000 to $64,999 | 0 (0.0%) | 2 (5.6%) |
| $65,000 to $74,999 | 0 (0.0%) | 4 (11.1%) |
| $75,000 to $99,999 | 1 (3.7%) | 0 (0.0%) |
| $100,000+ | 6 (22.2%) | 4 (11.1%) |
| Total | 27 (100.0%) | 36 (100.0%) |
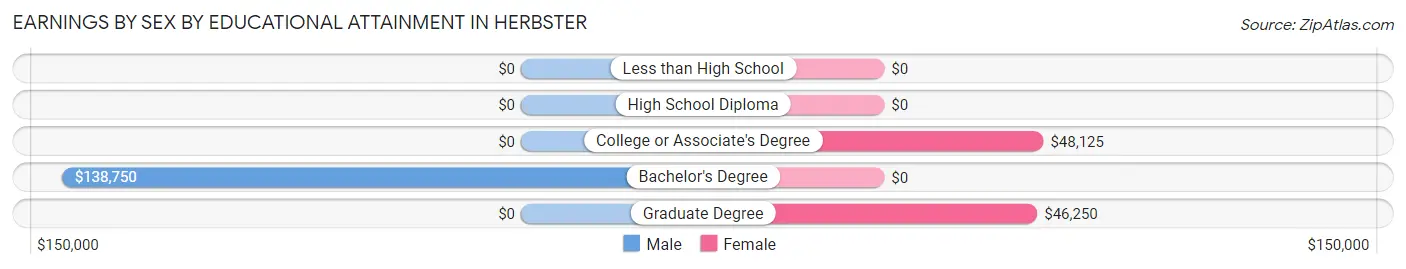
Earnings by Sex by Educational Attainment in Herbster
| Educational Attainment | Male Income | Female Income |
| Less than High School | - | - |
| High School Diploma | - | - |
| College or Associate's Degree | - | - |
| Bachelor's Degree | $138,750 | $0 |
| Graduate Degree | - | - |
| Total | - | - |
Family Income in Herbster
Family Income Brackets in Herbster
According to the Herbster family income data, there are 13 families falling into the $50,000 to $74,999 income range, which is the most common income bracket and makes up 30.9% of all families.
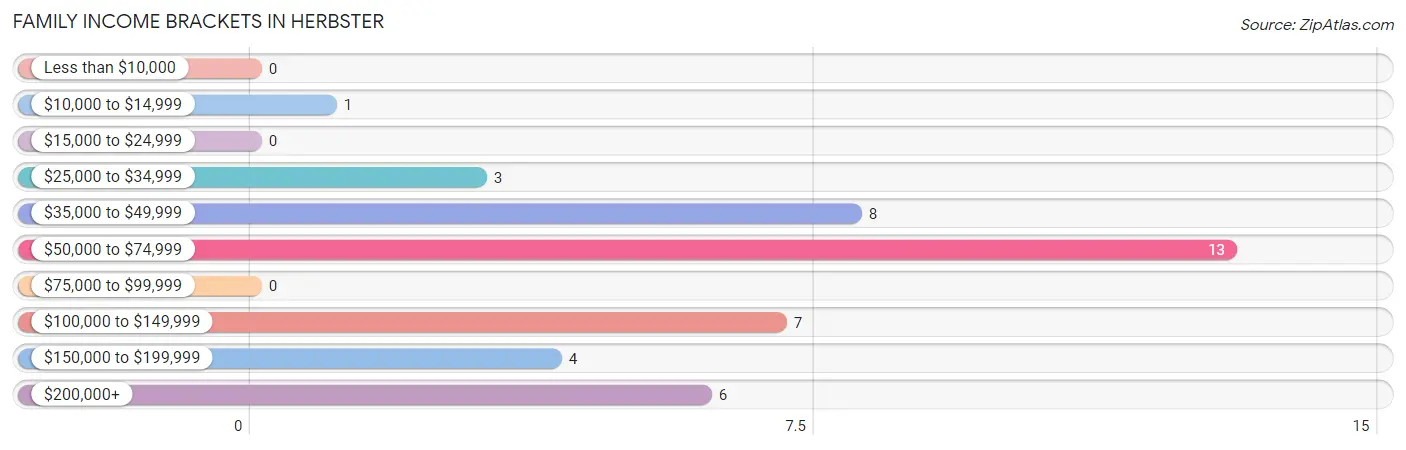
| Income Bracket | # Families | % Families |
| Less than $10,000 | 0 | 0.0% |
| $10,000 to $14,999 | 1 | 2.4% |
| $15,000 to $24,999 | 0 | 0.0% |
| $25,000 to $34,999 | 3 | 7.1% |
| $35,000 to $49,999 | 8 | 19.0% |
| $50,000 to $74,999 | 13 | 31.0% |
| $75,000 to $99,999 | 0 | 0.0% |
| $100,000 to $149,999 | 7 | 16.7% |
| $150,000 to $199,999 | 4 | 9.5% |
| $200,000+ | 6 | 14.3% |
Family Income by Famaliy Size in Herbster
2-person families (33 | 78.6%) account for the highest median family income in Herbster with $74,792 per family, while 2-person families (33 | 78.6%) have the highest median income of $37,396 per family member.
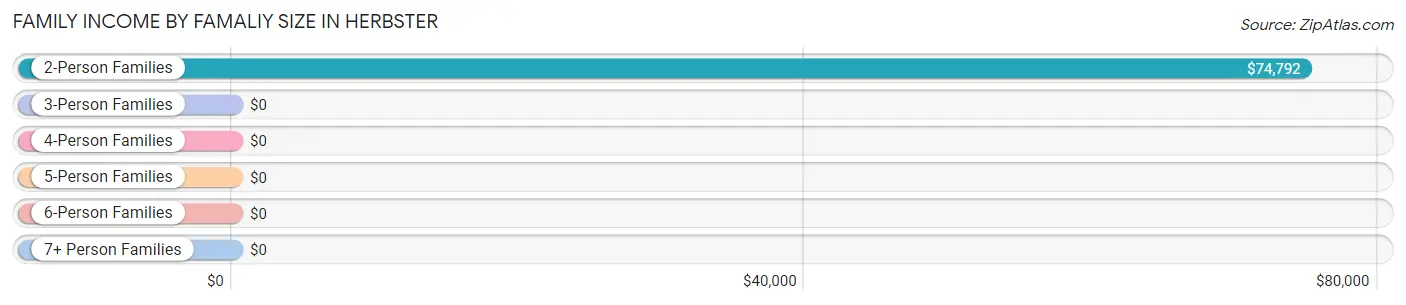
| Income Bracket | # Families | Median Income |
| 2-Person Families | 33 (78.6%) | $74,792 |
| 3-Person Families | 6 (14.3%) | $0 |
| 4-Person Families | 3 (7.1%) | $0 |
| 5-Person Families | 0 (0.0%) | $0 |
| 6-Person Families | 0 (0.0%) | $0 |
| 7+ Person Families | 0 (0.0%) | $0 |
| Total | 42 (100.0%) | $73,333 |
Family Income by Number of Earners in Herbster
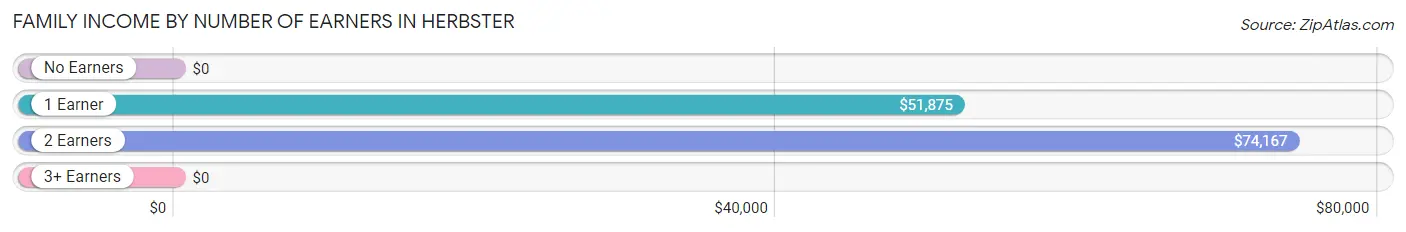
| Number of Earners | # Families | Median Income |
| No Earners | 10 (23.8%) | $0 |
| 1 Earner | 9 (21.4%) | $51,875 |
| 2 Earners | 22 (52.4%) | $74,167 |
| 3+ Earners | 1 (2.4%) | $0 |
| Total | 42 (100.0%) | $73,333 |
Household Income in Herbster
Household Income Brackets in Herbster
With 13 households falling in the category, the $50,000 to $74,999 income range is the most frequent in Herbster, accounting for 23.6% of all households.
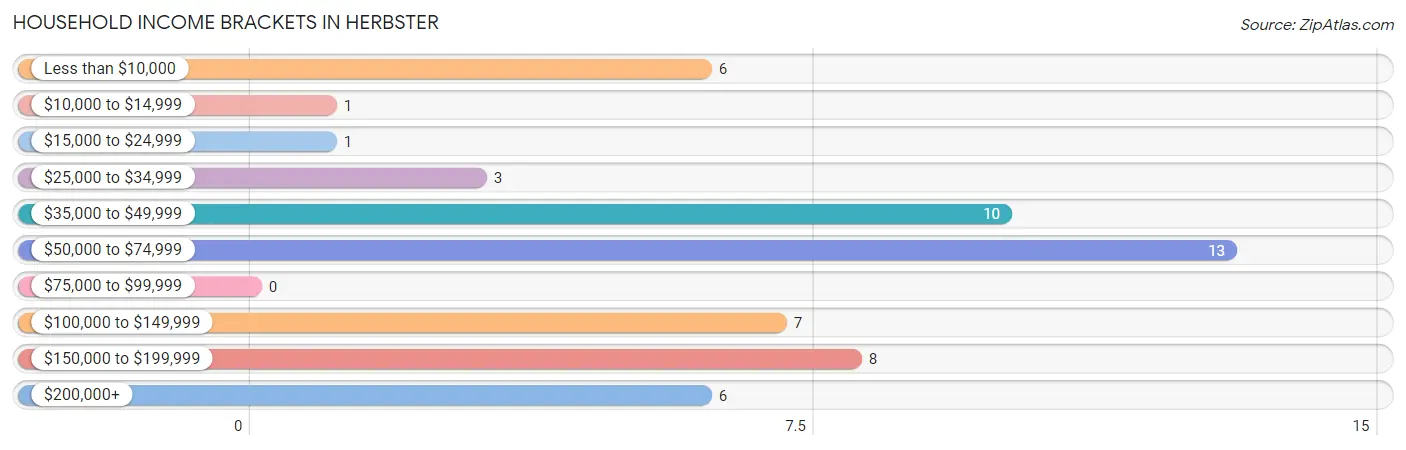
| Income Bracket | # Households | % Households |
| Less than $10,000 | 6 | 10.9% |
| $10,000 to $14,999 | 1 | 1.8% |
| $15,000 to $24,999 | 1 | 1.8% |
| $25,000 to $34,999 | 3 | 5.5% |
| $35,000 to $49,999 | 10 | 18.2% |
| $50,000 to $74,999 | 13 | 23.6% |
| $75,000 to $99,999 | 0 | 0.0% |
| $100,000 to $149,999 | 7 | 12.7% |
| $150,000 to $199,999 | 8 | 14.5% |
| $200,000+ | 6 | 10.9% |
Household Income by Householder Age in Herbster
The median household income in Herbster is $61,250, with the highest median household income of $47,321 found in the 45 to 64 years age bracket for the primary householder. A total of 29 households (52.7%) fall into this category.
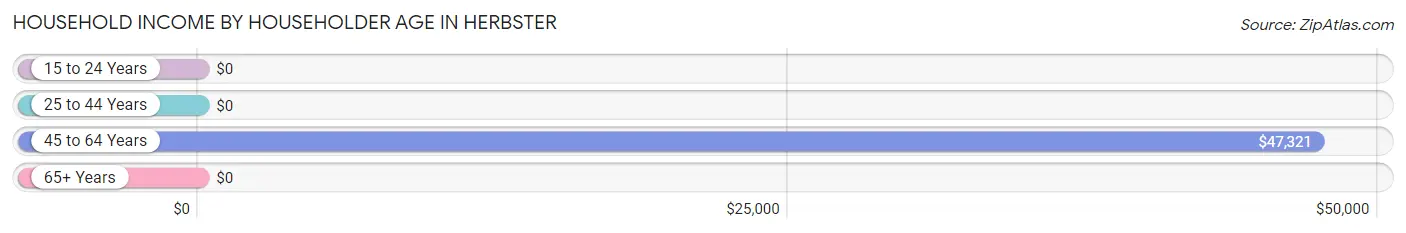
| Income Bracket | # Households | Median Income |
| 15 to 24 Years | 0 (0.0%) | $0 |
| 25 to 44 Years | 4 (7.3%) | $0 |
| 45 to 64 Years | 29 (52.7%) | $47,321 |
| 65+ Years | 22 (40.0%) | $0 |
| Total | 55 (100.0%) | $61,250 |
Poverty in Herbster
Income Below Poverty by Sex and Age in Herbster
With 17.5% poverty level for males and 6.0% for females among the residents of Herbster, 45 to 54 year old males and 65 to 74 year old females are the most vulnerable to poverty, with 4 males (44.4%) and 1 females (9.1%) in their respective age groups living below the poverty level.
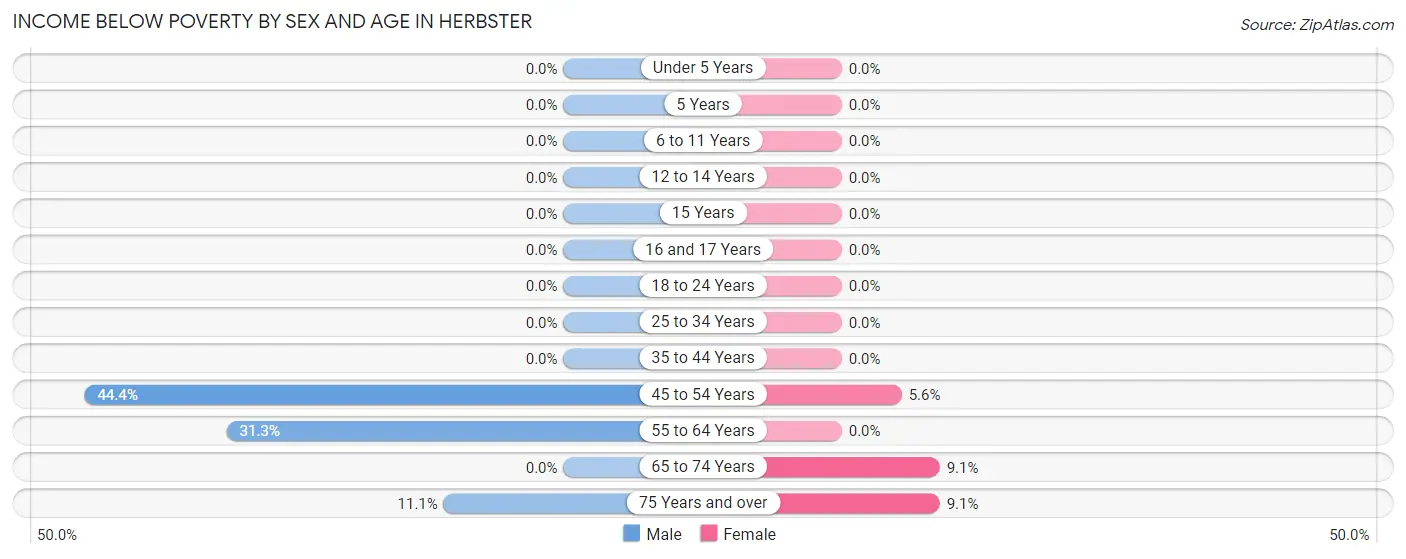
| Age Bracket | Male | Female |
| Under 5 Years | 0 (0.0%) | 0 (0.0%) |
| 5 Years | 0 (0.0%) | 0 (0.0%) |
| 6 to 11 Years | 0 (0.0%) | 0 (0.0%) |
| 12 to 14 Years | 0 (0.0%) | 0 (0.0%) |
| 15 Years | 0 (0.0%) | 0 (0.0%) |
| 16 and 17 Years | 0 (0.0%) | 0 (0.0%) |
| 18 to 24 Years | 0 (0.0%) | 0 (0.0%) |
| 25 to 34 Years | 0 (0.0%) | 0 (0.0%) |
| 35 to 44 Years | 0 (0.0%) | 0 (0.0%) |
| 45 to 54 Years | 4 (44.4%) | 1 (5.6%) |
| 55 to 64 Years | 5 (31.2%) | 0 (0.0%) |
| 65 to 74 Years | 0 (0.0%) | 1 (9.1%) |
| 75 Years and over | 1 (11.1%) | 1 (9.1%) |
| Total | 10 (17.5%) | 3 (6.0%) |
Income Above Poverty by Sex and Age in Herbster
According to the poverty statistics in Herbster, males aged 16 and 17 years and females aged 35 to 44 years are the age groups that are most secure financially, with 100.0% of males and 100.0% of females in these age groups living above the poverty line.
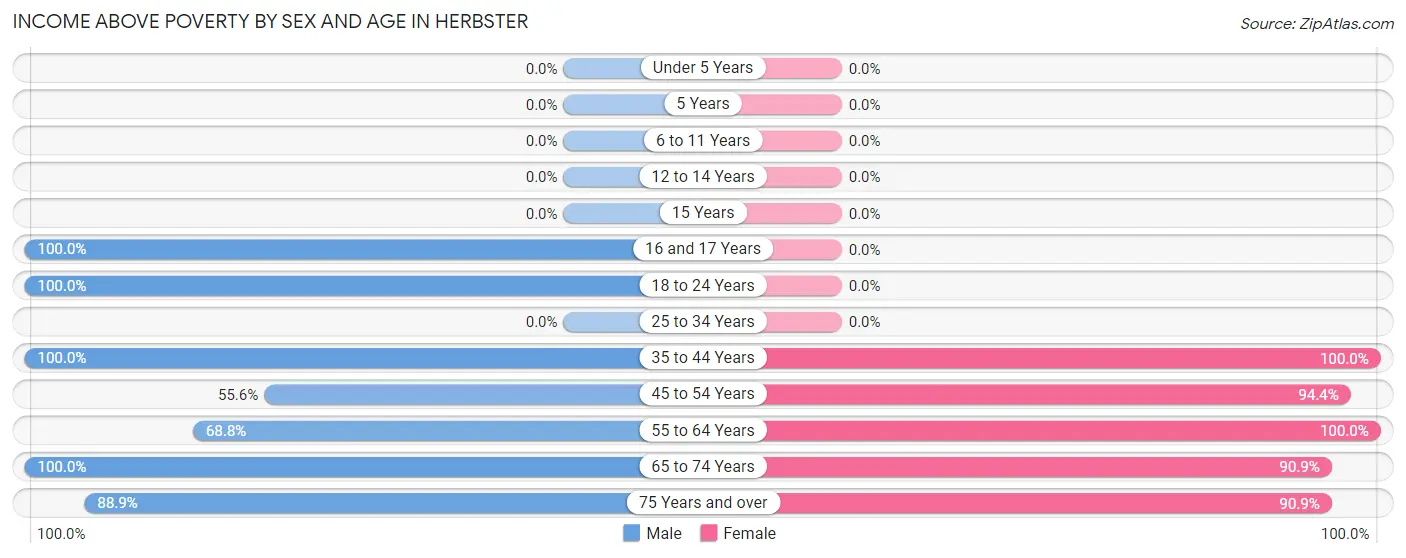
| Age Bracket | Male | Female |
| Under 5 Years | 0 (0.0%) | 0 (0.0%) |
| 5 Years | 0 (0.0%) | 0 (0.0%) |
| 6 to 11 Years | 0 (0.0%) | 0 (0.0%) |
| 12 to 14 Years | 0 (0.0%) | 0 (0.0%) |
| 15 Years | 0 (0.0%) | 0 (0.0%) |
| 16 and 17 Years | 6 (100.0%) | 0 (0.0%) |
| 18 to 24 Years | 7 (100.0%) | 0 (0.0%) |
| 25 to 34 Years | 0 (0.0%) | 0 (0.0%) |
| 35 to 44 Years | 1 (100.0%) | 4 (100.0%) |
| 45 to 54 Years | 5 (55.6%) | 17 (94.4%) |
| 55 to 64 Years | 11 (68.8%) | 6 (100.0%) |
| 65 to 74 Years | 9 (100.0%) | 10 (90.9%) |
| 75 Years and over | 8 (88.9%) | 10 (90.9%) |
| Total | 47 (82.5%) | 47 (94.0%) |
Income Below Poverty Among Married-Couple Families in Herbster
The poverty statistics for married-couple families in Herbster show that 2.7% or 1 of the total 37 families live below the poverty line. Families with no children have the highest poverty rate of 2.9%, comprising of 1 families. On the other hand, families with 1 or 2 children have the lowest poverty rate of 0.0%, which includes 0 families.
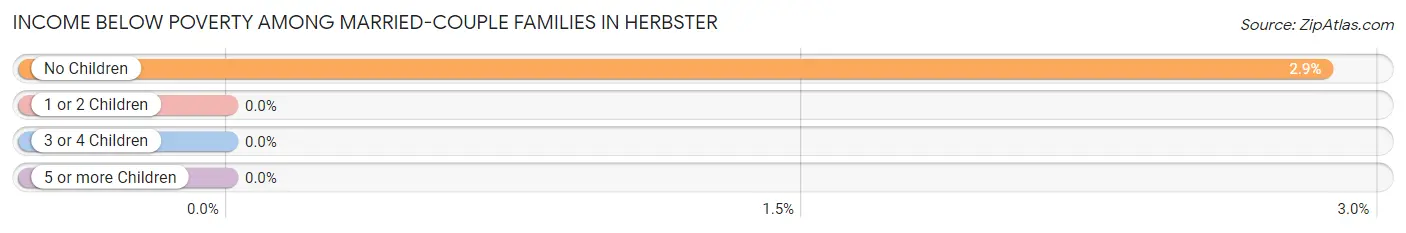
| Children | Above Poverty | Below Poverty |
| No Children | 34 (97.1%) | 1 (2.9%) |
| 1 or 2 Children | 2 (100.0%) | 0 (0.0%) |
| 3 or 4 Children | 0 (0.0%) | 0 (0.0%) |
| 5 or more Children | 0 (0.0%) | 0 (0.0%) |
| Total | 36 (97.3%) | 1 (2.7%) |
Income Below Poverty Among Single-Parent Households in Herbster
| Children | Single Father | Single Mother |
| No Children | 0 (0.0%) | 0 (0.0%) |
| 1 or 2 Children | 0 (0.0%) | 0 (0.0%) |
| 3 or 4 Children | 0 (0.0%) | 0 (0.0%) |
| 5 or more Children | 0 (0.0%) | 0 (0.0%) |
| Total | 0 (0.0%) | 0 (0.0%) |
Income Below Poverty Among Married-Couple vs Single-Parent Households in Herbster
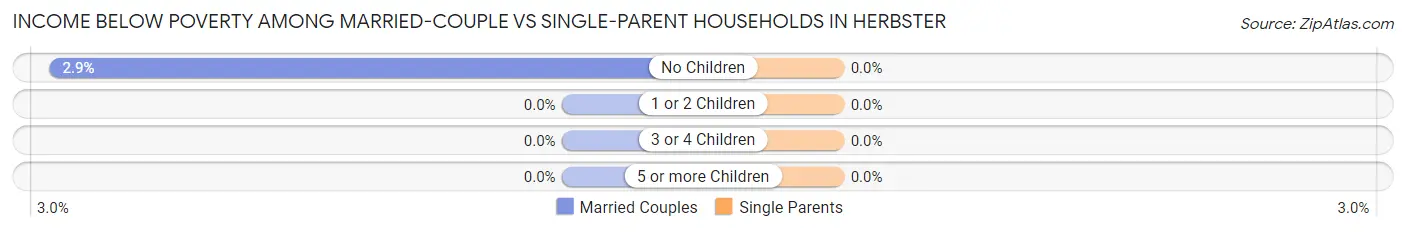
| Children | Married-Couple Families | Single-Parent Households |
| No Children | 1 (2.9%) | 0 (0.0%) |
| 1 or 2 Children | 0 (0.0%) | 0 (0.0%) |
| 3 or 4 Children | 0 (0.0%) | 0 (0.0%) |
| 5 or more Children | 0 (0.0%) | 0 (0.0%) |
| Total | 1 (2.7%) | 0 (0.0%) |
Race in Herbster
The most populous races in Herbster are , and White / Caucasian (107 | 100.0%).
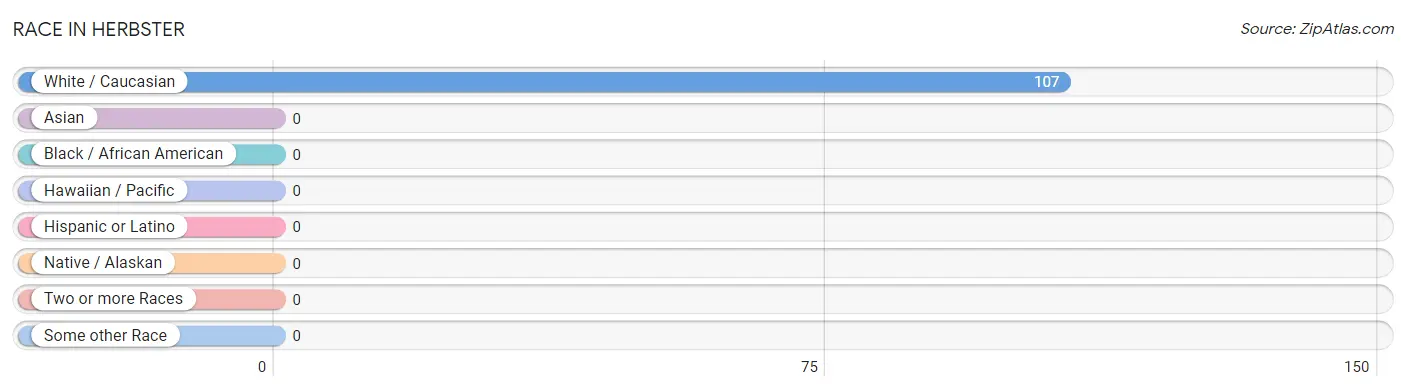
| Race | # Population | % Population |
| Asian | 0 | 0.0% |
| Black / African American | 0 | 0.0% |
| Hawaiian / Pacific | 0 | 0.0% |
| Hispanic or Latino | 0 | 0.0% |
| Native / Alaskan | 0 | 0.0% |
| White / Caucasian | 107 | 100.0% |
| Two or more Races | 0 | 0.0% |
| Some other Race | 0 | 0.0% |
| Total | 107 | 100.0% |
Ancestry in Herbster
The most populous ancestries reported in Herbster are German (32 | 29.9%), Norwegian (27 | 25.2%), Swedish (13 | 12.1%), Dutch (10 | 9.3%), and French (10 | 9.3%), together accounting for 86.0% of all Herbster residents.
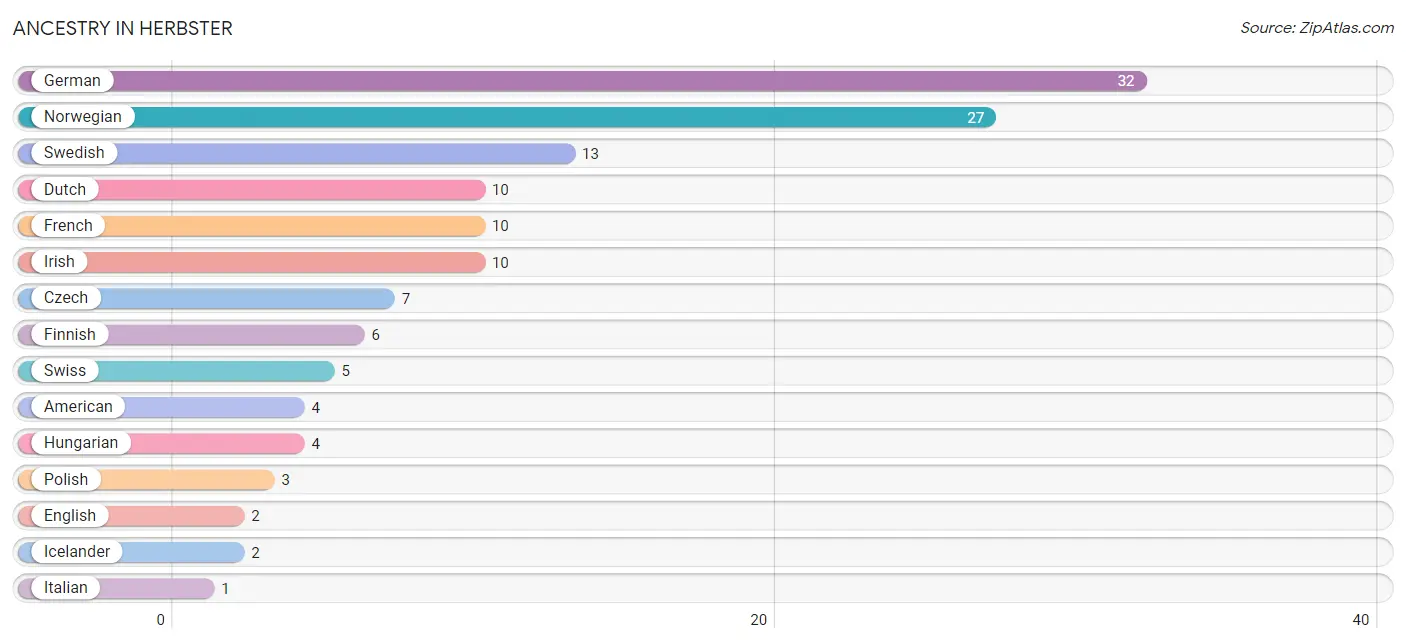
| Ancestry | # Population | % Population |
| American | 4 | 3.7% |
| Czech | 7 | 6.5% |
| Dutch | 10 | 9.3% |
| English | 2 | 1.9% |
| Finnish | 6 | 5.6% |
| French | 10 | 9.3% |
| German | 32 | 29.9% |
| Hungarian | 4 | 3.7% |
| Icelander | 2 | 1.9% |
| Irish | 10 | 9.3% |
| Italian | 1 | 0.9% |
| Norwegian | 27 | 25.2% |
| Polish | 3 | 2.8% |
| Russian | 1 | 0.9% |
| Swedish | 13 | 12.1% |
| Swiss | 5 | 4.7% | View All 16 Rows |
Immigrants in Herbster

| Immigration Origin | # Population | % Population | View All 0 Rows |
Sex and Age in Herbster
Sex and Age in Herbster
The most populous age groups in Herbster are 60 to 64 Years (10 | 17.5%) for men and 50 to 54 Years (10 | 20.0%) for women.
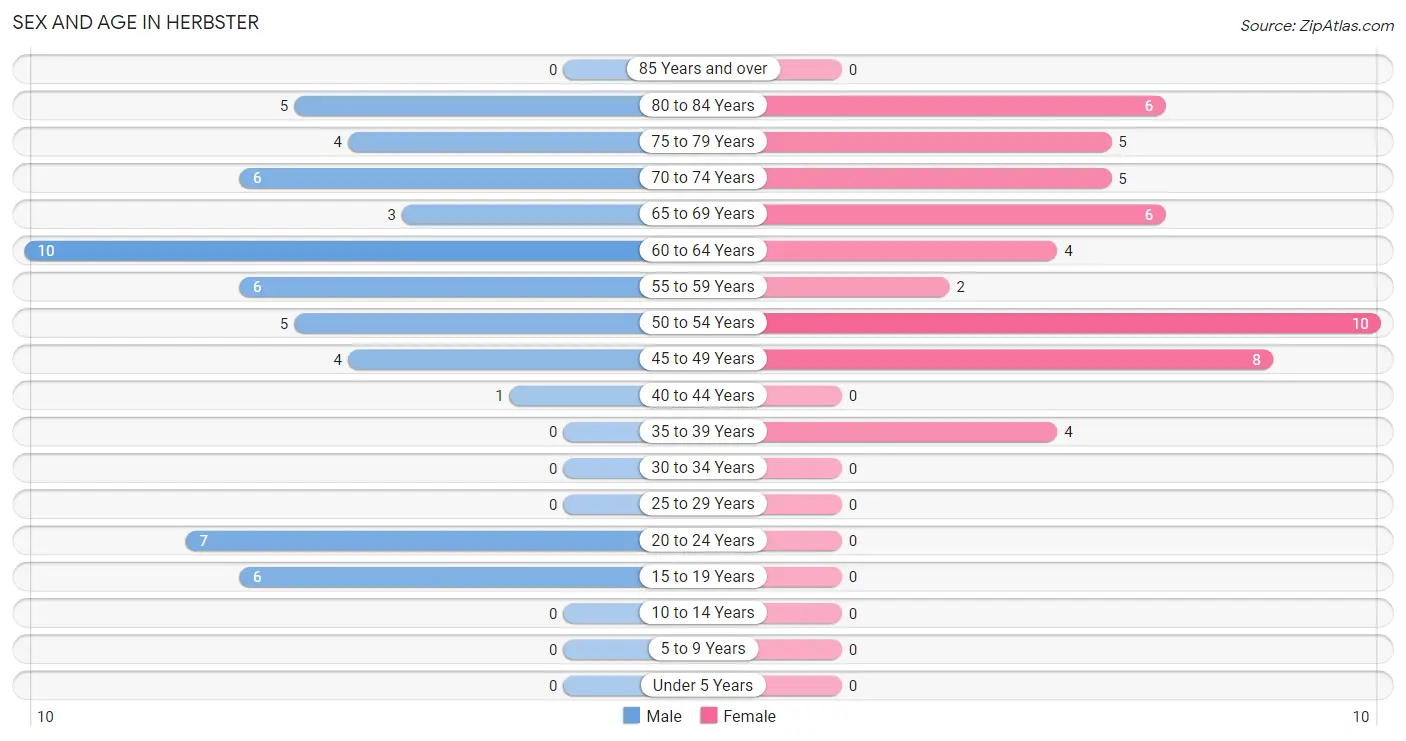
| Age Bracket | Male | Female |
| Under 5 Years | 0 (0.0%) | 0 (0.0%) |
| 5 to 9 Years | 0 (0.0%) | 0 (0.0%) |
| 10 to 14 Years | 0 (0.0%) | 0 (0.0%) |
| 15 to 19 Years | 6 (10.5%) | 0 (0.0%) |
| 20 to 24 Years | 7 (12.3%) | 0 (0.0%) |
| 25 to 29 Years | 0 (0.0%) | 0 (0.0%) |
| 30 to 34 Years | 0 (0.0%) | 0 (0.0%) |
| 35 to 39 Years | 0 (0.0%) | 4 (8.0%) |
| 40 to 44 Years | 1 (1.8%) | 0 (0.0%) |
| 45 to 49 Years | 4 (7.0%) | 8 (16.0%) |
| 50 to 54 Years | 5 (8.8%) | 10 (20.0%) |
| 55 to 59 Years | 6 (10.5%) | 2 (4.0%) |
| 60 to 64 Years | 10 (17.5%) | 4 (8.0%) |
| 65 to 69 Years | 3 (5.3%) | 6 (12.0%) |
| 70 to 74 Years | 6 (10.5%) | 5 (10.0%) |
| 75 to 79 Years | 4 (7.0%) | 5 (10.0%) |
| 80 to 84 Years | 5 (8.8%) | 6 (12.0%) |
| 85 Years and over | 0 (0.0%) | 0 (0.0%) |
| Total | 57 (100.0%) | 50 (100.0%) |
Families and Households in Herbster
Median Family Size in Herbster
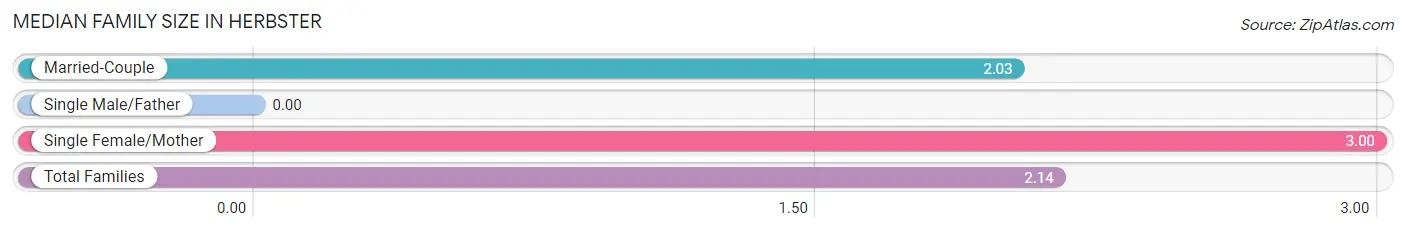
| Family Type | # Families | Family Size |
| Married-Couple | 37 (88.1%) | 2.03 |
| Single Male/Father | 0 (0.0%) | - |
| Single Female/Mother | 5 (11.9%) | 3.00 |
| Total Families | 42 (100.0%) | 2.14 |
Median Household Size in Herbster
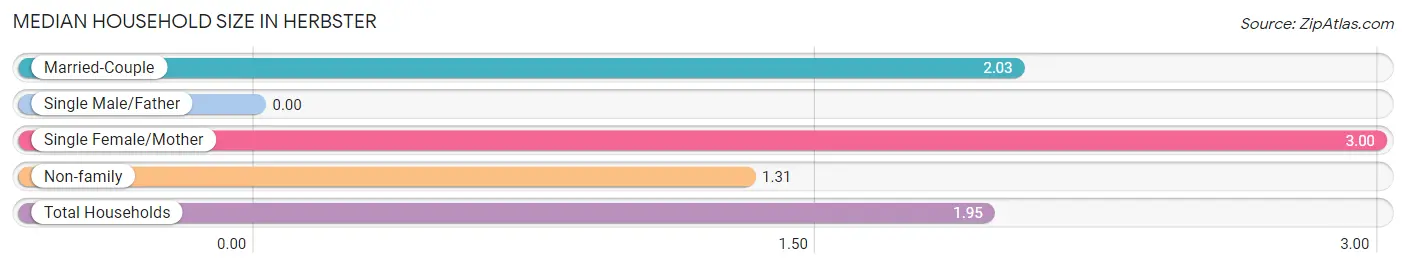
| Household Type | # Households | Household Size |
| Married-Couple | 37 (67.3%) | 2.03 |
| Single Male/Father | 0 (0.0%) | - |
| Single Female/Mother | 5 (9.1%) | 3.00 |
| Non-family | 13 (23.6%) | 1.31 |
| Total Households | 55 (100.0%) | 1.95 |
Household Size by Marriage Status in Herbster
Out of a total of 55 households in Herbster, 42 (76.4%) are family households, while 13 (23.6%) are nonfamily households. The most numerous type of family households are 2-person households, comprising 33, and the most common type of nonfamily households are 1-person households, comprising 9.
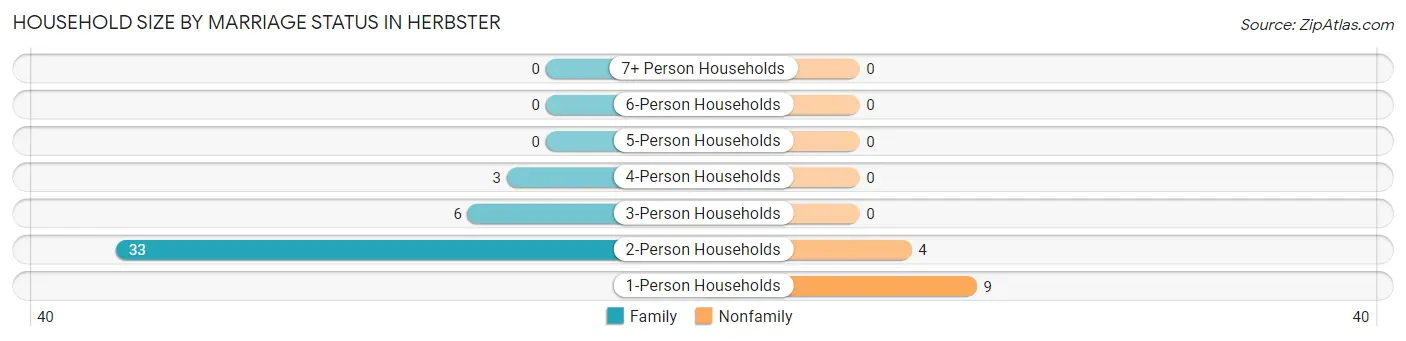
| Household Size | Family Households | Nonfamily Households |
| 1-Person Households | - | 9 (16.4%) |
| 2-Person Households | 33 (60.0%) | 4 (7.3%) |
| 3-Person Households | 6 (10.9%) | 0 (0.0%) |
| 4-Person Households | 3 (5.4%) | 0 (0.0%) |
| 5-Person Households | 0 (0.0%) | 0 (0.0%) |
| 6-Person Households | 0 (0.0%) | 0 (0.0%) |
| 7+ Person Households | 0 (0.0%) | 0 (0.0%) |
| Total | 42 (76.4%) | 13 (23.6%) |
Female Fertility in Herbster
Fertility by Age in Herbster
| Age Bracket | Women with Births | Births / 1,000 Women |
| 15 to 19 years | 0 (0.0%) | 0.0 |
| 20 to 34 years | 0 (0.0%) | 0.0 |
| 35 to 50 years | 0 (0.0%) | 0.0 |
| Total | 0 (0.0%) | 0.0 |
Fertility by Age by Marriage Status in Herbster
| Age Bracket | Married | Unmarried |
| 15 to 19 years | 0 (0.0%) | 0 (0.0%) |
| 20 to 34 years | 0 (0.0%) | 0 (0.0%) |
| 35 to 50 years | 0 (0.0%) | 0 (0.0%) |
| Total | 0 (0.0%) | 0 (0.0%) |
Fertility by Education in Herbster
| Educational Attainment | Women with Births | Births / 1,000 Women |
| Less than High School | 0 (0.0%) | 0.0 |
| High School Diploma | 0 (0.0%) | 0.0 |
| College or Associate's Degree | 0 (0.0%) | 0.0 |
| Bachelor's Degree | 0 (0.0%) | 0.0 |
| Graduate Degree | 0 (0.0%) | 0.0 |
| Total | 0 (0.0%) | 0.0 |
Fertility by Education by Marriage Status in Herbster
| Educational Attainment | Married | Unmarried |
| Less than High School | 0 (0.0%) | 0 (0.0%) |
| High School Diploma | 0 (0.0%) | 0 (0.0%) |
| College or Associate's Degree | 0 (0.0%) | 0 (0.0%) |
| Bachelor's Degree | 0 (0.0%) | 0 (0.0%) |
| Graduate Degree | 0 (0.0%) | 0 (0.0%) |
| Total | 0 (0.0%) | 0 (0.0%) |
Employment Characteristics in Herbster
Employment by Class of Employer in Herbster
Among the 55 employed individuals in Herbster, private company employees (30 | 54.5%), local government employees (19 | 34.5%), and not-for-profit organizations (3 | 5.4%) make up the most common classes of employment.
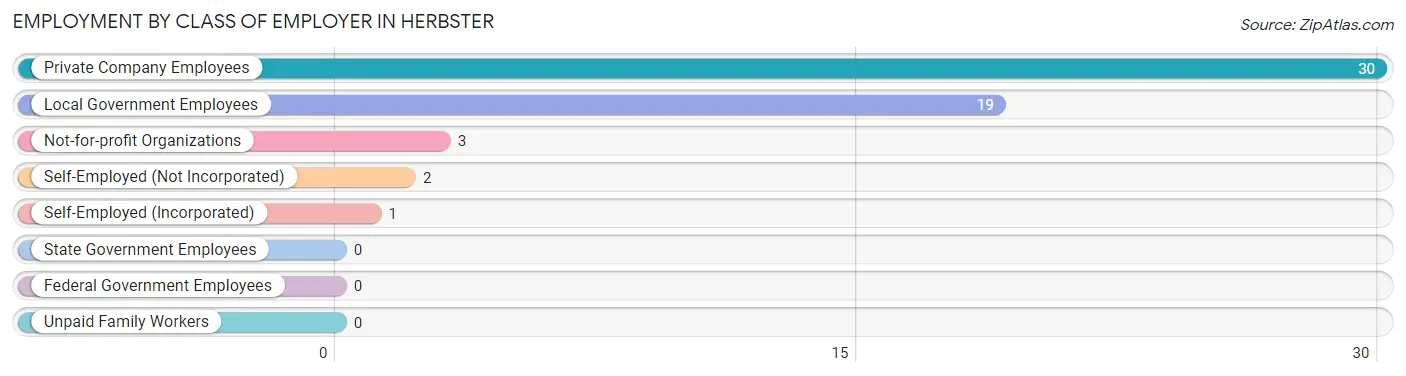
| Employer Class | # Employees | % Employees |
| Private Company Employees | 30 | 54.5% |
| Self-Employed (Incorporated) | 1 | 1.8% |
| Self-Employed (Not Incorporated) | 2 | 3.6% |
| Not-for-profit Organizations | 3 | 5.4% |
| Local Government Employees | 19 | 34.5% |
| State Government Employees | 0 | 0.0% |
| Federal Government Employees | 0 | 0.0% |
| Unpaid Family Workers | 0 | 0.0% |
| Total | 55 | 100.0% |
Employment Status by Age in Herbster
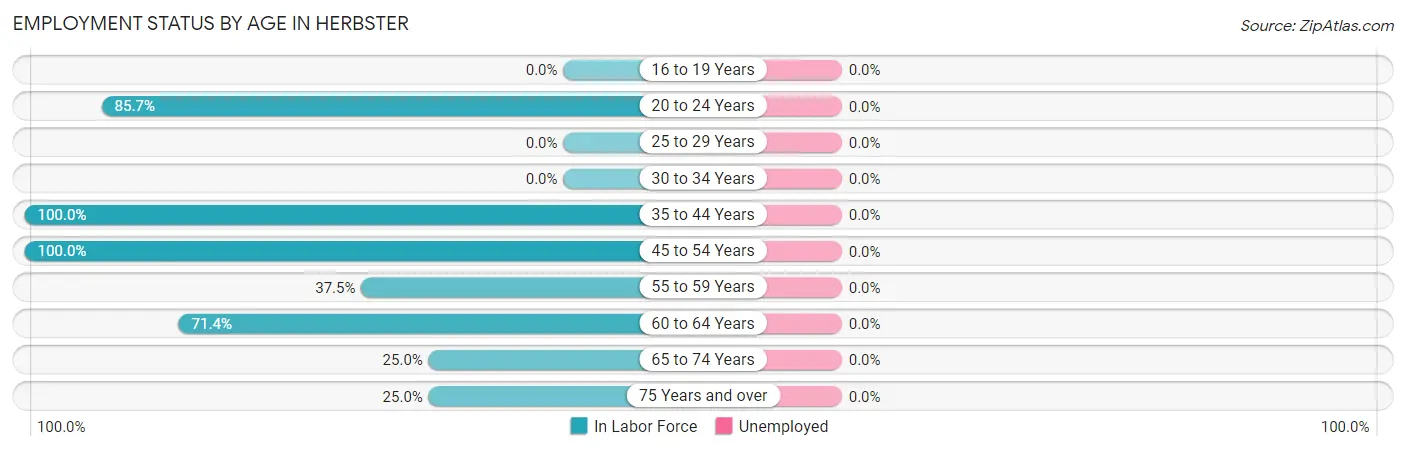
| Age Bracket | In Labor Force | Unemployed |
| 16 to 19 Years | 0 (0.0%) | 0 (0.0%) |
| 20 to 24 Years | 6 (85.7%) | 0 (0.0%) |
| 25 to 29 Years | 0 (0.0%) | 0 (0.0%) |
| 30 to 34 Years | 0 (0.0%) | 0 (0.0%) |
| 35 to 44 Years | 5 (100.0%) | 0 (0.0%) |
| 45 to 54 Years | 27 (100.0%) | 0 (0.0%) |
| 55 to 59 Years | 3 (37.5%) | 0 (0.0%) |
| 60 to 64 Years | 10 (71.4%) | 0 (0.0%) |
| 65 to 74 Years | 5 (25.0%) | 0 (0.0%) |
| 75 Years and over | 5 (25.0%) | 0 (0.0%) |
| Total | 61 (57.0%) | 0 (0.0%) |
Employment Status by Educational Attainment in Herbster
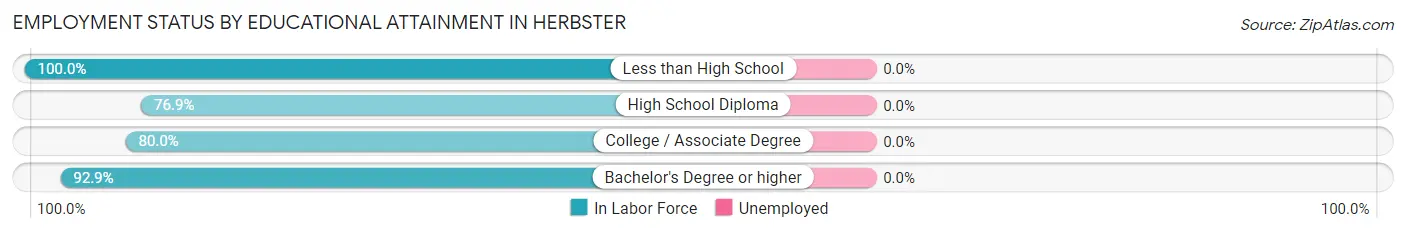
| Educational Attainment | In Labor Force | Unemployed |
| Less than High School | 2 (100.0%) | 0 (0.0%) |
| High School Diploma | 10 (76.9%) | 0 (0.0%) |
| College / Associate Degree | 20 (80.0%) | 0 (0.0%) |
| Bachelor's Degree or higher | 13 (92.9%) | 0 (0.0%) |
| Total | 45 (83.3%) | 0 (0.0%) |
Employment Occupations by Sex in Herbster
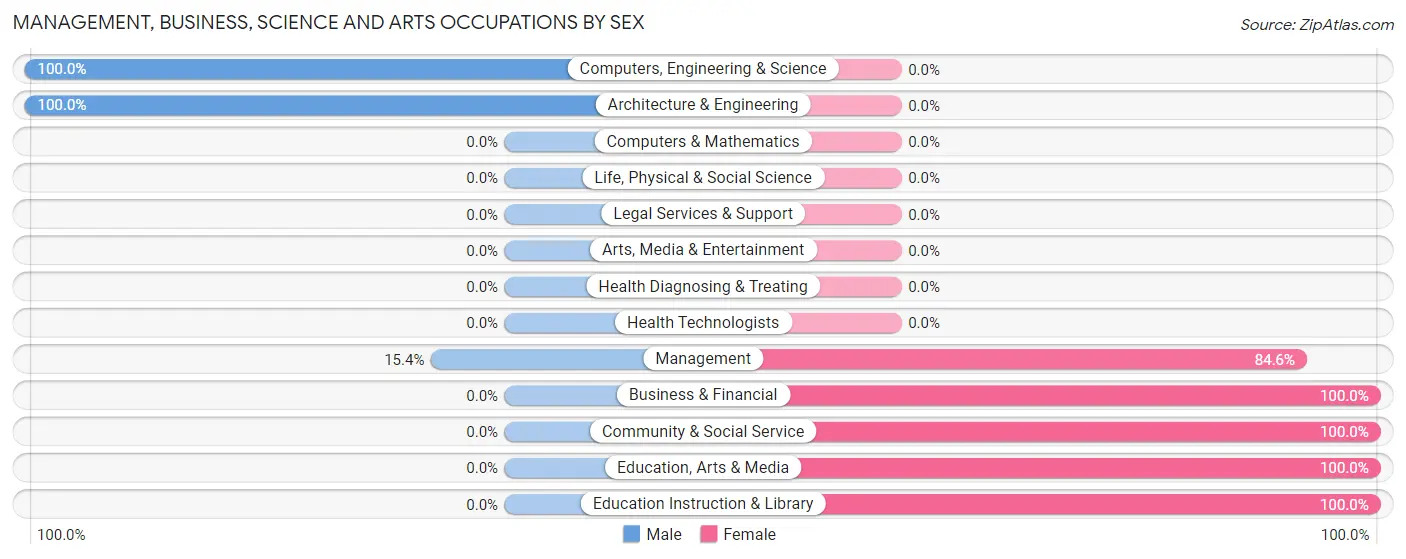
Management, Business, Science and Arts Occupations
The most common Management, Business, Science and Arts occupations in Herbster are Management (13 | 21.3%), Community & Social Service (11 | 18.0%), Education Instruction & Library (6 | 9.8%), Education, Arts & Media (5 | 8.2%), and Computers, Engineering & Science (3 | 4.9%).
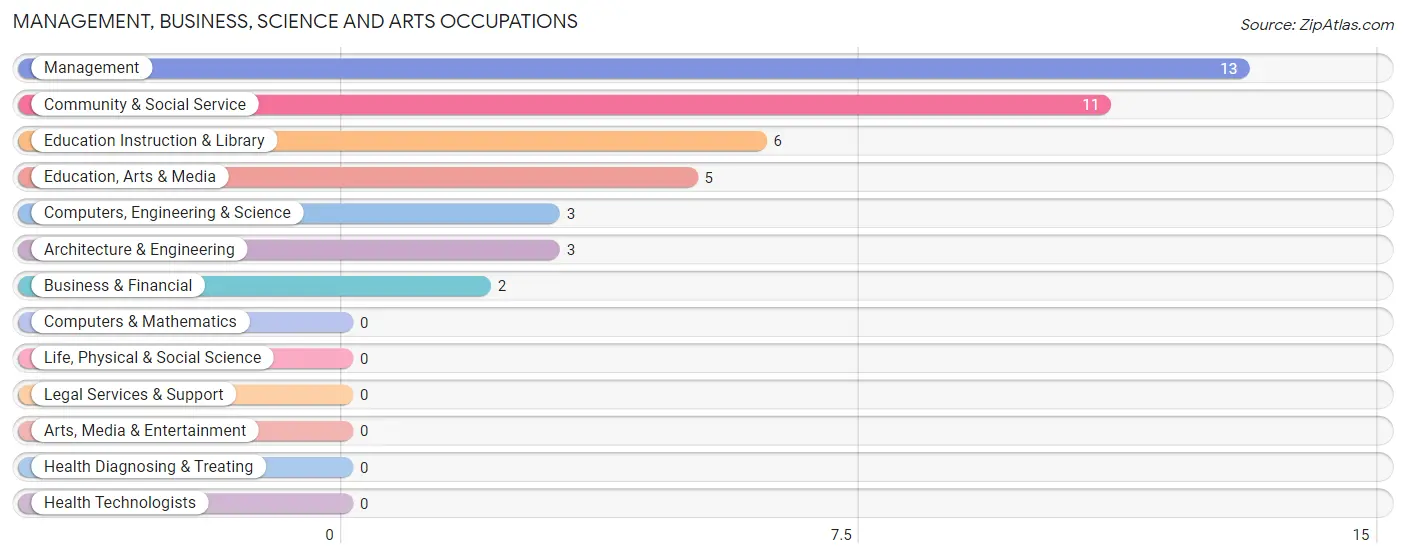
Management, Business, Science and Arts Occupations by Sex
Within the Management, Business, Science and Arts occupations in Herbster, the most male-oriented occupations are Computers, Engineering & Science (100.0%), Architecture & Engineering (100.0%), and Management (15.4%), while the most female-oriented occupations are Business & Financial (100.0%), Community & Social Service (100.0%), and Education, Arts & Media (100.0%).
| Occupation | Male | Female |
| Management | 2 (15.4%) | 11 (84.6%) |
| Business & Financial | 0 (0.0%) | 2 (100.0%) |
| Computers, Engineering & Science | 3 (100.0%) | 0 (0.0%) |
| Computers & Mathematics | 0 (0.0%) | 0 (0.0%) |
| Architecture & Engineering | 3 (100.0%) | 0 (0.0%) |
| Life, Physical & Social Science | 0 (0.0%) | 0 (0.0%) |
| Community & Social Service | 0 (0.0%) | 11 (100.0%) |
| Education, Arts & Media | 0 (0.0%) | 5 (100.0%) |
| Legal Services & Support | 0 (0.0%) | 0 (0.0%) |
| Education Instruction & Library | 0 (0.0%) | 6 (100.0%) |
| Arts, Media & Entertainment | 0 (0.0%) | 0 (0.0%) |
| Health Diagnosing & Treating | 0 (0.0%) | 0 (0.0%) |
| Health Technologists | 0 (0.0%) | 0 (0.0%) |
| Total (Category) | 5 (17.2%) | 24 (82.8%) |
| Total (Overall) | 25 (41.0%) | 36 (59.0%) |
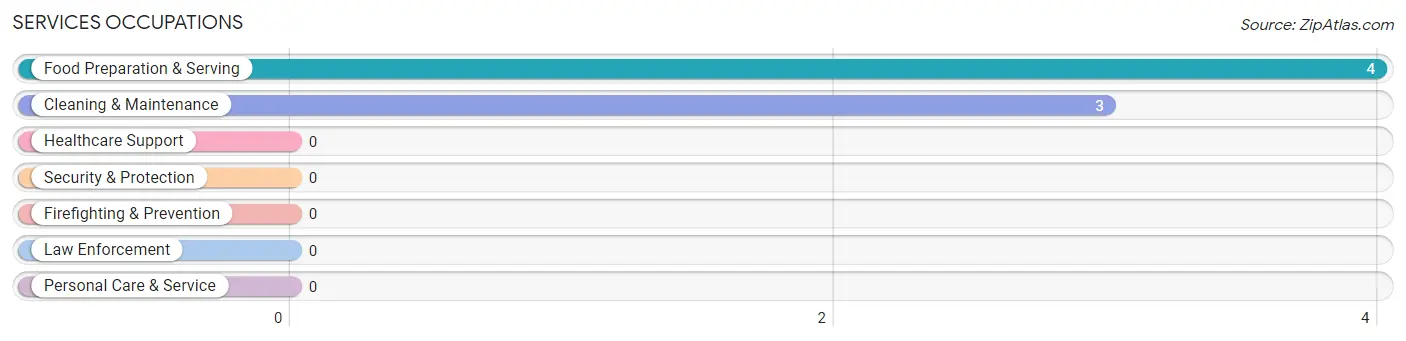
Services Occupations
The most common Services occupations in Herbster are Food Preparation & Serving (4 | 6.6%), and Cleaning & Maintenance (3 | 4.9%).
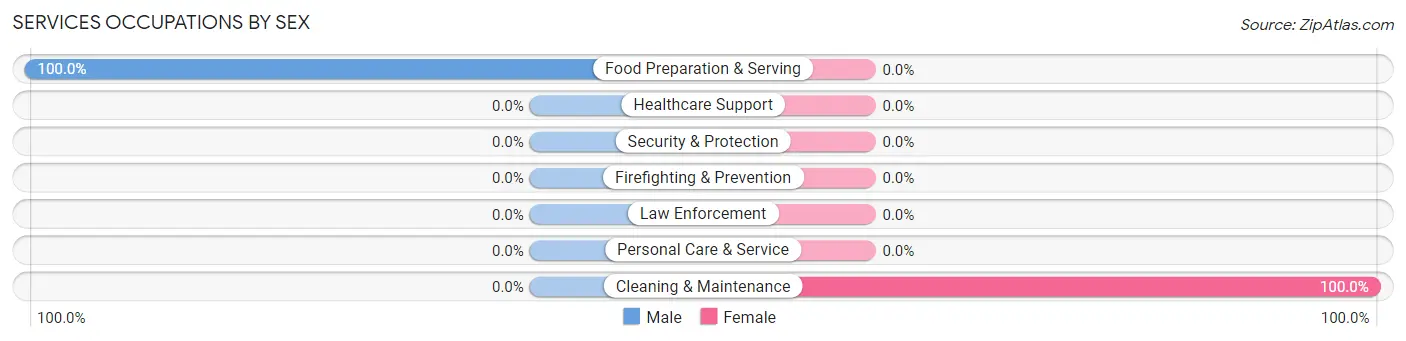
Services Occupations by Sex
| Occupation | Male | Female |
| Healthcare Support | 0 (0.0%) | 0 (0.0%) |
| Security & Protection | 0 (0.0%) | 0 (0.0%) |
| Firefighting & Prevention | 0 (0.0%) | 0 (0.0%) |
| Law Enforcement | 0 (0.0%) | 0 (0.0%) |
| Food Preparation & Serving | 4 (100.0%) | 0 (0.0%) |
| Cleaning & Maintenance | 0 (0.0%) | 3 (100.0%) |
| Personal Care & Service | 0 (0.0%) | 0 (0.0%) |
| Total (Category) | 4 (57.1%) | 3 (42.9%) |
| Total (Overall) | 25 (41.0%) | 36 (59.0%) |
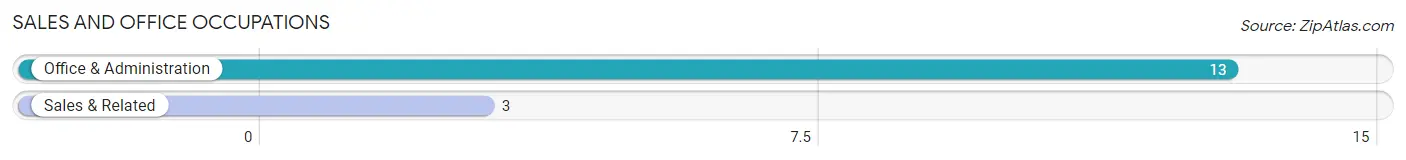
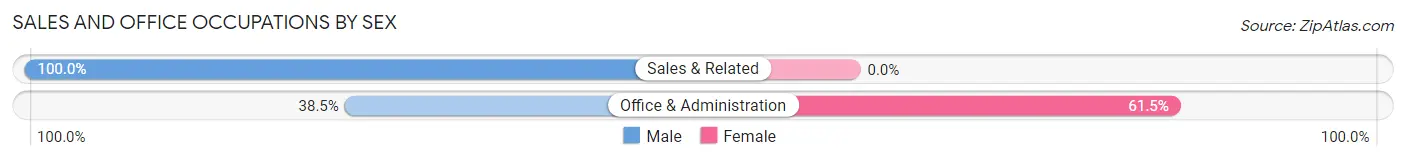
Sales and Office Occupations
The most common Sales and Office occupations in Herbster are Office & Administration (13 | 21.3%), and Sales & Related (3 | 4.9%).
Sales and Office Occupations by Sex
| Occupation | Male | Female |
| Sales & Related | 3 (100.0%) | 0 (0.0%) |
| Office & Administration | 5 (38.5%) | 8 (61.5%) |
| Total (Category) | 8 (50.0%) | 8 (50.0%) |
| Total (Overall) | 25 (41.0%) | 36 (59.0%) |
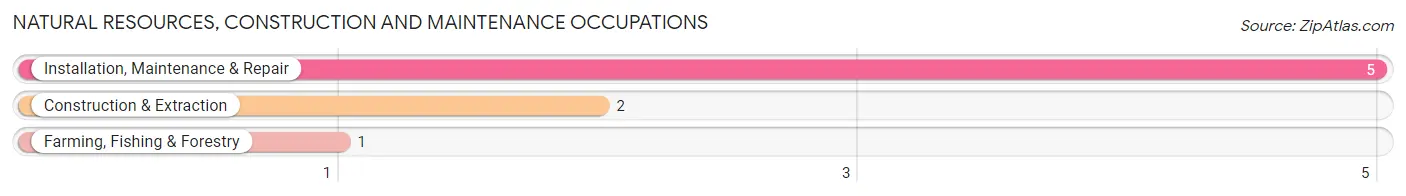
Natural Resources, Construction and Maintenance Occupations
The most common Natural Resources, Construction and Maintenance occupations in Herbster are Installation, Maintenance & Repair (5 | 8.2%), Construction & Extraction (2 | 3.3%), and Farming, Fishing & Forestry (1 | 1.6%).
Natural Resources, Construction and Maintenance Occupations by Sex
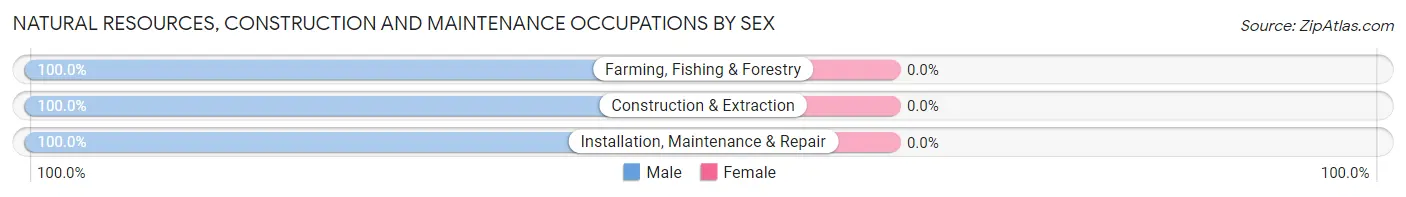
| Occupation | Male | Female |
| Farming, Fishing & Forestry | 1 (100.0%) | 0 (0.0%) |
| Construction & Extraction | 2 (100.0%) | 0 (0.0%) |
| Installation, Maintenance & Repair | 5 (100.0%) | 0 (0.0%) |
| Total (Category) | 8 (100.0%) | 0 (0.0%) |
| Total (Overall) | 25 (41.0%) | 36 (59.0%) |
Production, Transportation and Moving Occupations
The most common Production, Transportation and Moving occupations in Herbster are , and Material Moving (1 | 1.6%).
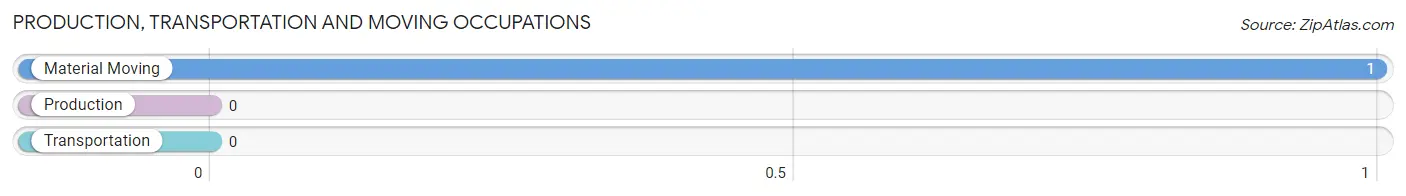
Production, Transportation and Moving Occupations by Sex
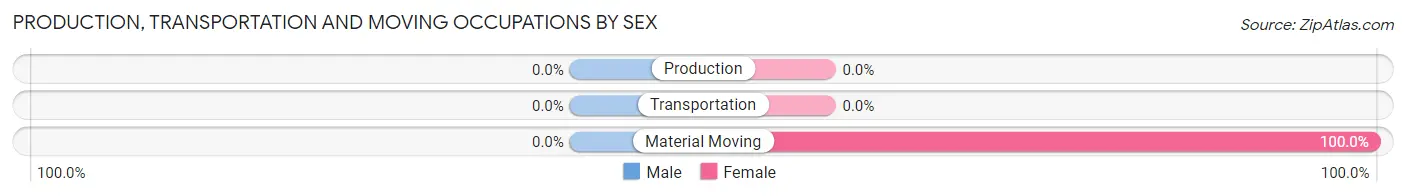
| Occupation | Male | Female |
| Production | 0 (0.0%) | 0 (0.0%) |
| Transportation | 0 (0.0%) | 0 (0.0%) |
| Material Moving | 0 (0.0%) | 1 (100.0%) |
| Total (Category) | 0 (0.0%) | 1 (100.0%) |
| Total (Overall) | 25 (41.0%) | 36 (59.0%) |
Employment Industries by Sex in Herbster
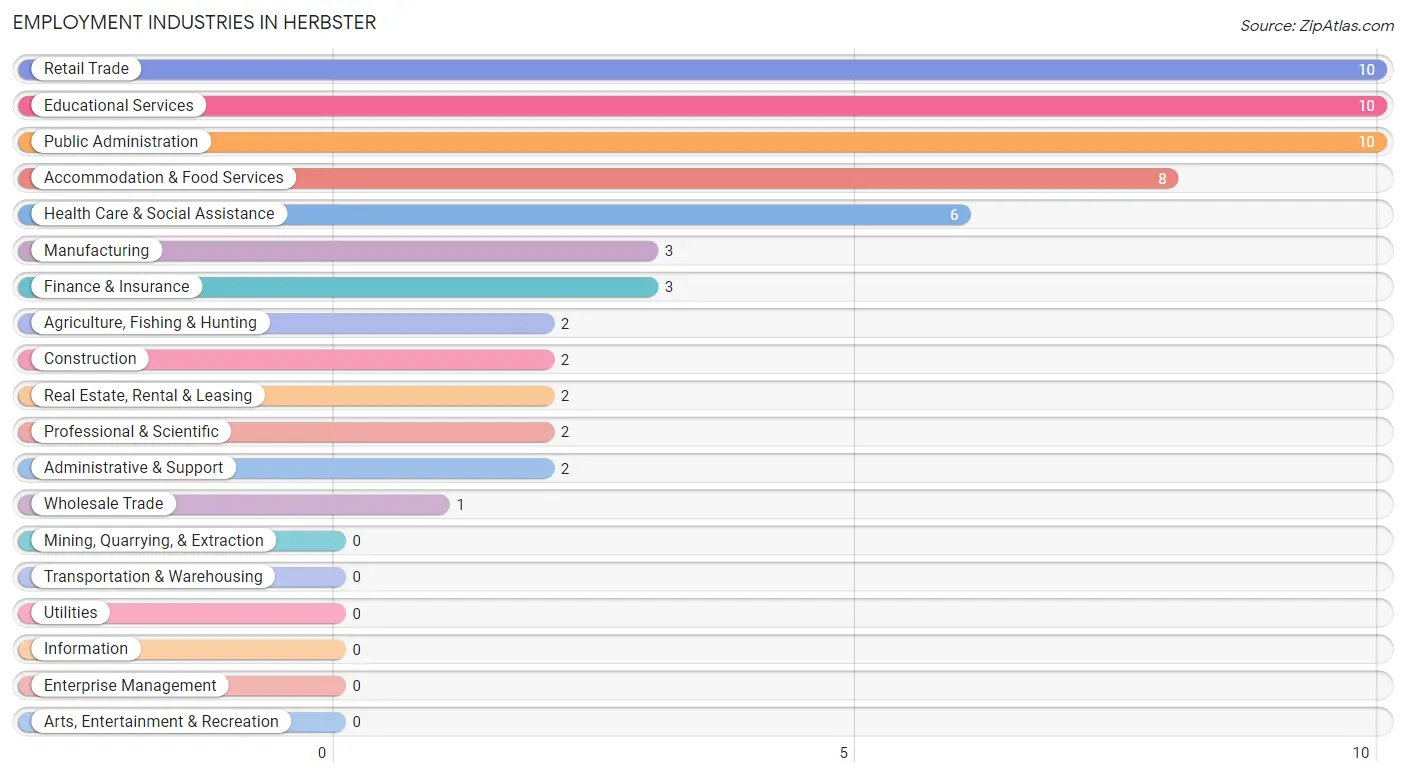
Employment Industries in Herbster
The major employment industries in Herbster include Retail Trade (10 | 16.4%), Educational Services (10 | 16.4%), Public Administration (10 | 16.4%), Accommodation & Food Services (8 | 13.1%), and Health Care & Social Assistance (6 | 9.8%).
Employment Industries by Sex in Herbster
The Herbster industries that see more men than women are Agriculture, Fishing & Hunting (100.0%), Construction (100.0%), and Manufacturing (100.0%), whereas the industries that tend to have a higher number of women are Wholesale Trade (100.0%), Real Estate, Rental & Leasing (100.0%), and Administrative & Support (100.0%).
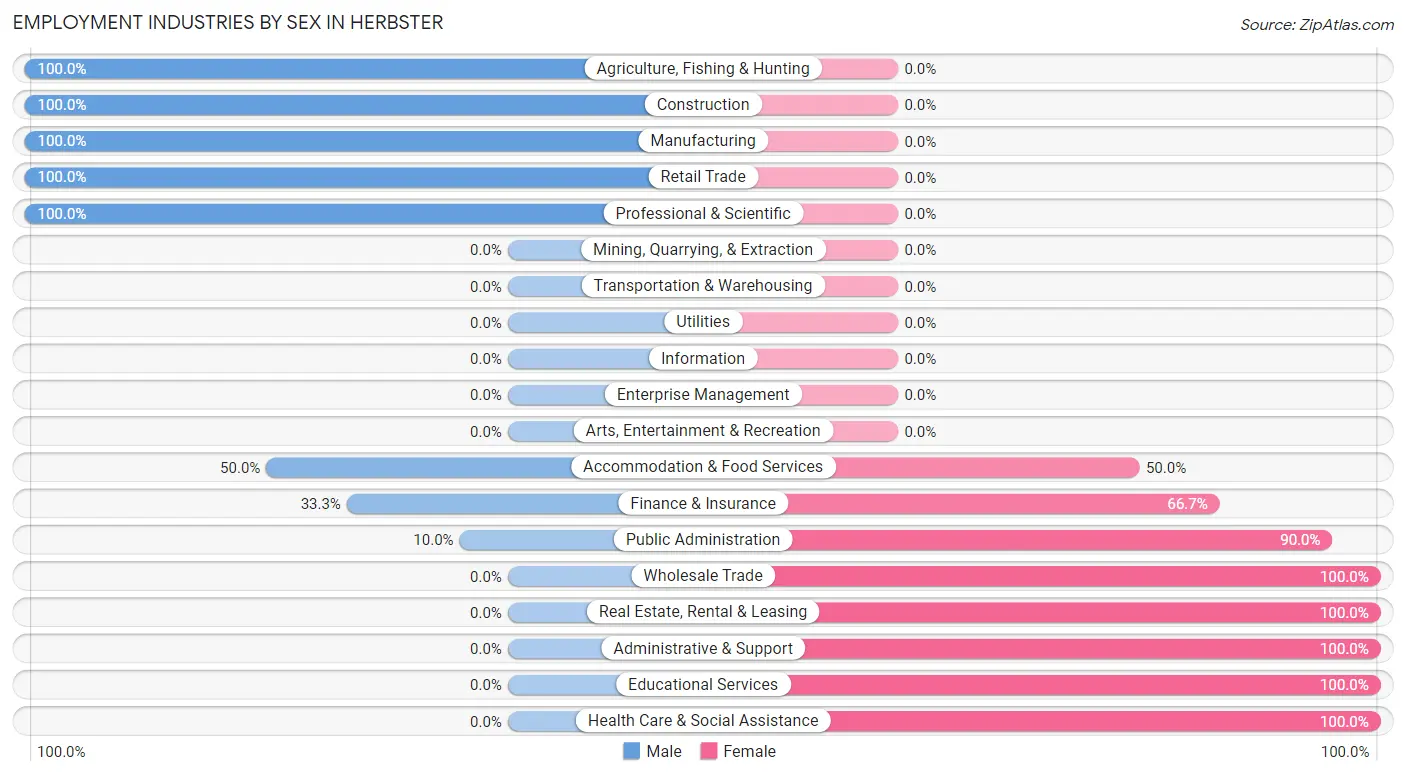
| Industry | Male | Female |
| Agriculture, Fishing & Hunting | 2 (100.0%) | 0 (0.0%) |
| Mining, Quarrying, & Extraction | 0 (0.0%) | 0 (0.0%) |
| Construction | 2 (100.0%) | 0 (0.0%) |
| Manufacturing | 3 (100.0%) | 0 (0.0%) |
| Wholesale Trade | 0 (0.0%) | 1 (100.0%) |
| Retail Trade | 10 (100.0%) | 0 (0.0%) |
| Transportation & Warehousing | 0 (0.0%) | 0 (0.0%) |
| Utilities | 0 (0.0%) | 0 (0.0%) |
| Information | 0 (0.0%) | 0 (0.0%) |
| Finance & Insurance | 1 (33.3%) | 2 (66.7%) |
| Real Estate, Rental & Leasing | 0 (0.0%) | 2 (100.0%) |
| Professional & Scientific | 2 (100.0%) | 0 (0.0%) |
| Enterprise Management | 0 (0.0%) | 0 (0.0%) |
| Administrative & Support | 0 (0.0%) | 2 (100.0%) |
| Educational Services | 0 (0.0%) | 10 (100.0%) |
| Health Care & Social Assistance | 0 (0.0%) | 6 (100.0%) |
| Arts, Entertainment & Recreation | 0 (0.0%) | 0 (0.0%) |
| Accommodation & Food Services | 4 (50.0%) | 4 (50.0%) |
| Public Administration | 1 (10.0%) | 9 (90.0%) |
| Total | 25 (41.0%) | 36 (59.0%) |
Education in Herbster
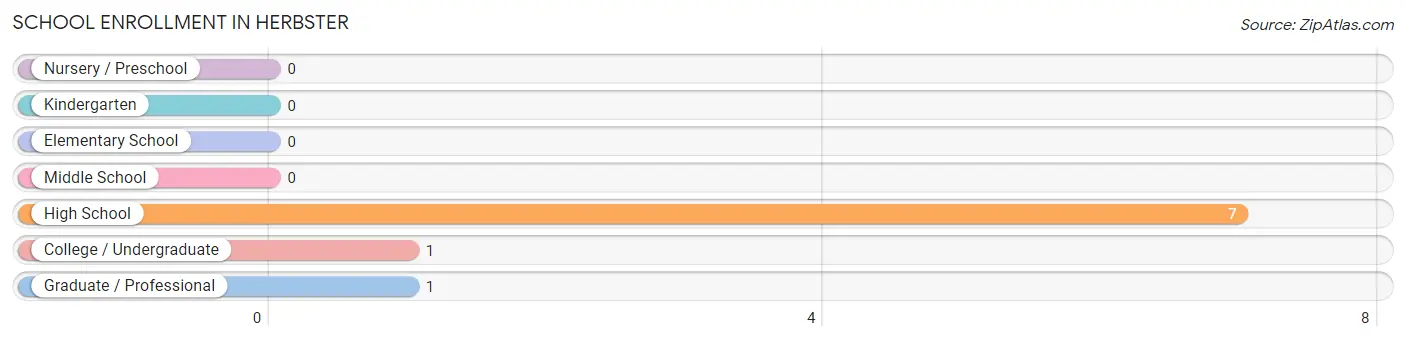
School Enrollment in Herbster
The most common levels of schooling among the 9 students in Herbster are high school (7 | 77.8%), college / undergraduate (1 | 11.1%), and graduate / professional (1 | 11.1%).
| School Level | # Students | % Students |
| Nursery / Preschool | 0 | 0.0% |
| Kindergarten | 0 | 0.0% |
| Elementary School | 0 | 0.0% |
| Middle School | 0 | 0.0% |
| High School | 7 | 77.8% |
| College / Undergraduate | 1 | 11.1% |
| Graduate / Professional | 1 | 11.1% |
| Total | 9 | 100.0% |
School Enrollment by Age by Funding Source in Herbster
Out of a total of 9 students who are enrolled in schools in Herbster, 2 (22.2%) attend a private institution, while the remaining 7 (77.8%) are enrolled in public schools. The age group of 35 years and over has the highest likelihood of being enrolled in private schools, with 1 (100.0% in the age bracket) enrolled. Conversely, the age group of 15 to 17 year olds has the lowest likelihood of being enrolled in a private school, with 6 (100.0% in the age bracket) attending a public institution.
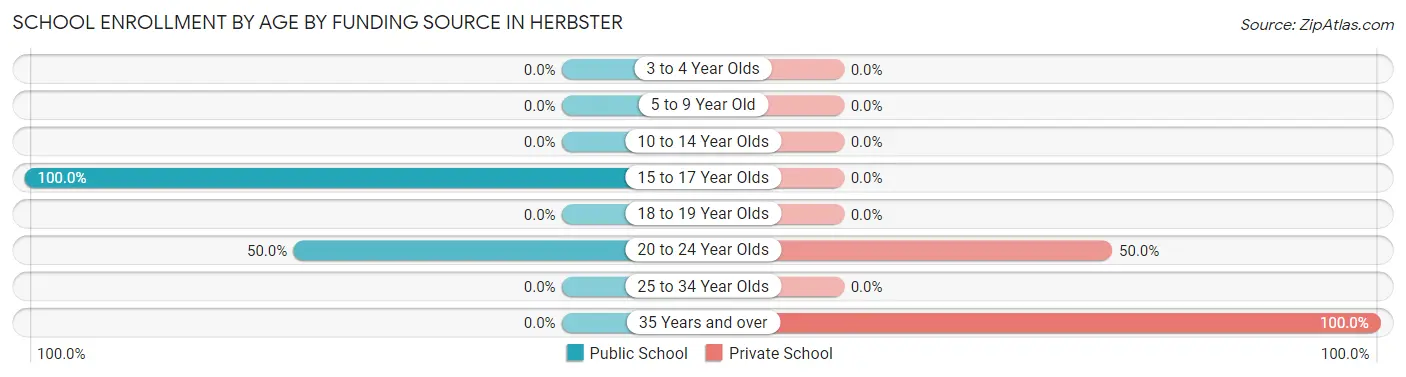
| Age Bracket | Public School | Private School |
| 3 to 4 Year Olds | 0 (0.0%) | 0 (0.0%) |
| 5 to 9 Year Old | 0 (0.0%) | 0 (0.0%) |
| 10 to 14 Year Olds | 0 (0.0%) | 0 (0.0%) |
| 15 to 17 Year Olds | 6 (100.0%) | 0 (0.0%) |
| 18 to 19 Year Olds | 0 (0.0%) | 0 (0.0%) |
| 20 to 24 Year Olds | 1 (50.0%) | 1 (50.0%) |
| 25 to 34 Year Olds | 0 (0.0%) | 0 (0.0%) |
| 35 Years and over | 0 (0.0%) | 1 (100.0%) |
| Total | 7 (77.8%) | 2 (22.2%) |
Educational Attainment by Field of Study in Herbster
Education (11 | 26.2%), physical & health sciences (6 | 14.3%), computers & mathematics (4 | 9.5%), engineering (4 | 9.5%), and bio, nature & agricultural (3 | 7.1%) are the most common fields of study among 42 individuals in Herbster who have obtained a bachelor's degree or higher.
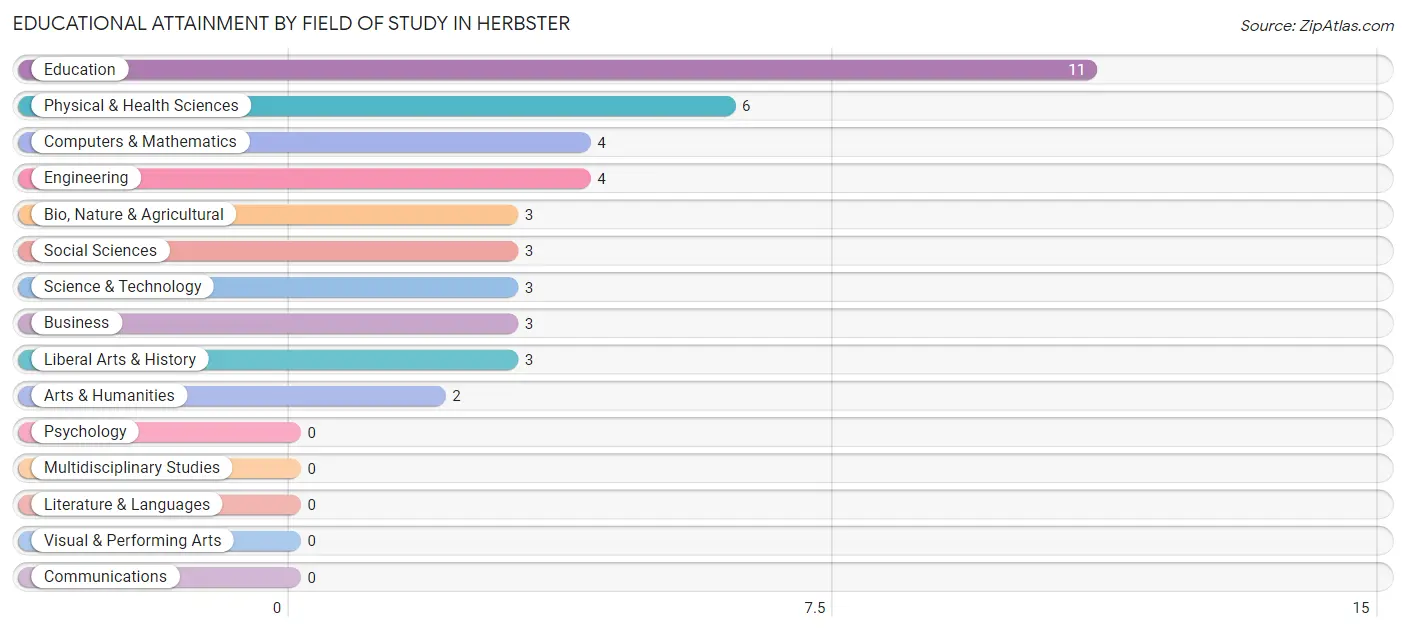
| Field of Study | # Graduates | % Graduates |
| Computers & Mathematics | 4 | 9.5% |
| Bio, Nature & Agricultural | 3 | 7.1% |
| Physical & Health Sciences | 6 | 14.3% |
| Psychology | 0 | 0.0% |
| Social Sciences | 3 | 7.1% |
| Engineering | 4 | 9.5% |
| Multidisciplinary Studies | 0 | 0.0% |
| Science & Technology | 3 | 7.1% |
| Business | 3 | 7.1% |
| Education | 11 | 26.2% |
| Literature & Languages | 0 | 0.0% |
| Liberal Arts & History | 3 | 7.1% |
| Visual & Performing Arts | 0 | 0.0% |
| Communications | 0 | 0.0% |
| Arts & Humanities | 2 | 4.8% |
| Total | 42 | 100.0% |
Transportation & Commute in Herbster
Vehicle Availability by Sex in Herbster
The most prevalent vehicle ownership categories in Herbster are males with 2 vehicles (7, accounting for 36.8%) and females with 2 vehicles (13, making up 19.4%).
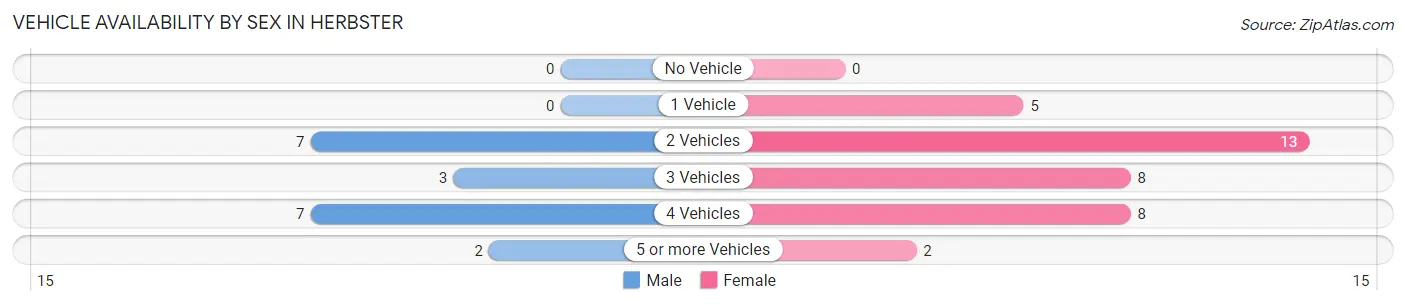
| Vehicles Available | Male | Female |
| No Vehicle | 0 (0.0%) | 0 (0.0%) |
| 1 Vehicle | 0 (0.0%) | 5 (13.9%) |
| 2 Vehicles | 7 (36.8%) | 13 (36.1%) |
| 3 Vehicles | 3 (15.8%) | 8 (22.2%) |
| 4 Vehicles | 7 (36.8%) | 8 (22.2%) |
| 5 or more Vehicles | 2 (10.5%) | 2 (5.6%) |
| Total | 19 (100.0%) | 36 (100.0%) |
Commute Time in Herbster
The most frequently occuring commute durations in Herbster are less than 5 minutes (20 commuters, 41.7%), 35 to 39 minutes (8 commuters, 16.7%), and 30 to 34 minutes (6 commuters, 12.5%).
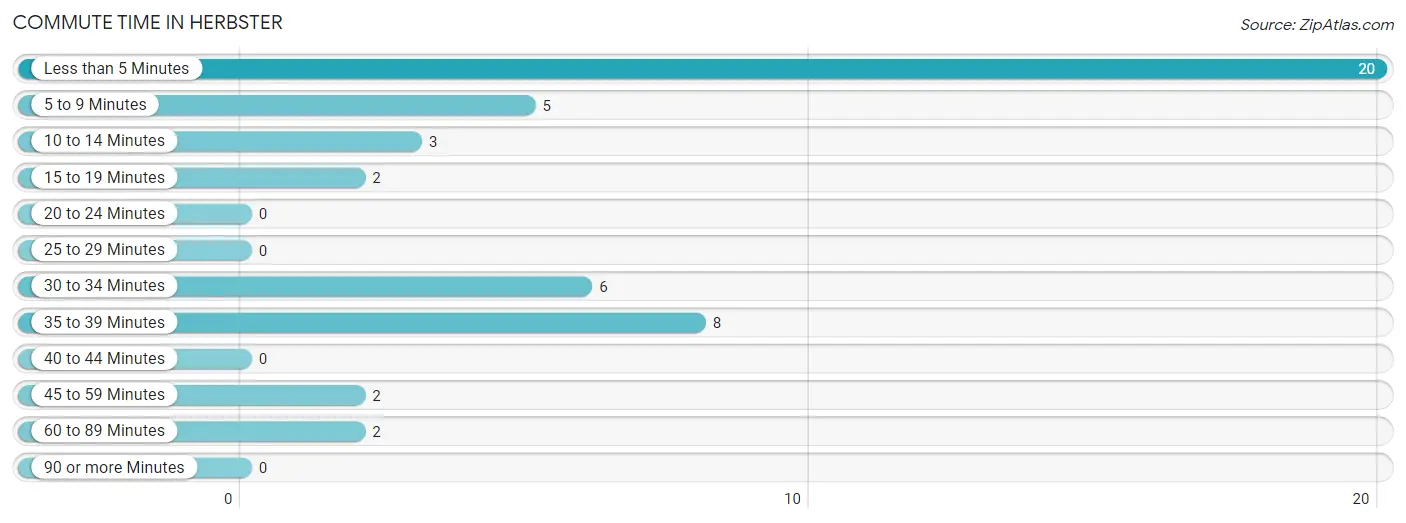
| Commute Time | # Commuters | % Commuters |
| Less than 5 Minutes | 20 | 41.7% |
| 5 to 9 Minutes | 5 | 10.4% |
| 10 to 14 Minutes | 3 | 6.2% |
| 15 to 19 Minutes | 2 | 4.2% |
| 20 to 24 Minutes | 0 | 0.0% |
| 25 to 29 Minutes | 0 | 0.0% |
| 30 to 34 Minutes | 6 | 12.5% |
| 35 to 39 Minutes | 8 | 16.7% |
| 40 to 44 Minutes | 0 | 0.0% |
| 45 to 59 Minutes | 2 | 4.2% |
| 60 to 89 Minutes | 2 | 4.2% |
| 90 or more Minutes | 0 | 0.0% |
Commute Time by Sex in Herbster
The most common commute times in Herbster are less than 5 minutes (13 commuters, 81.2%) for males and less than 5 minutes (7 commuters, 21.9%) for females.
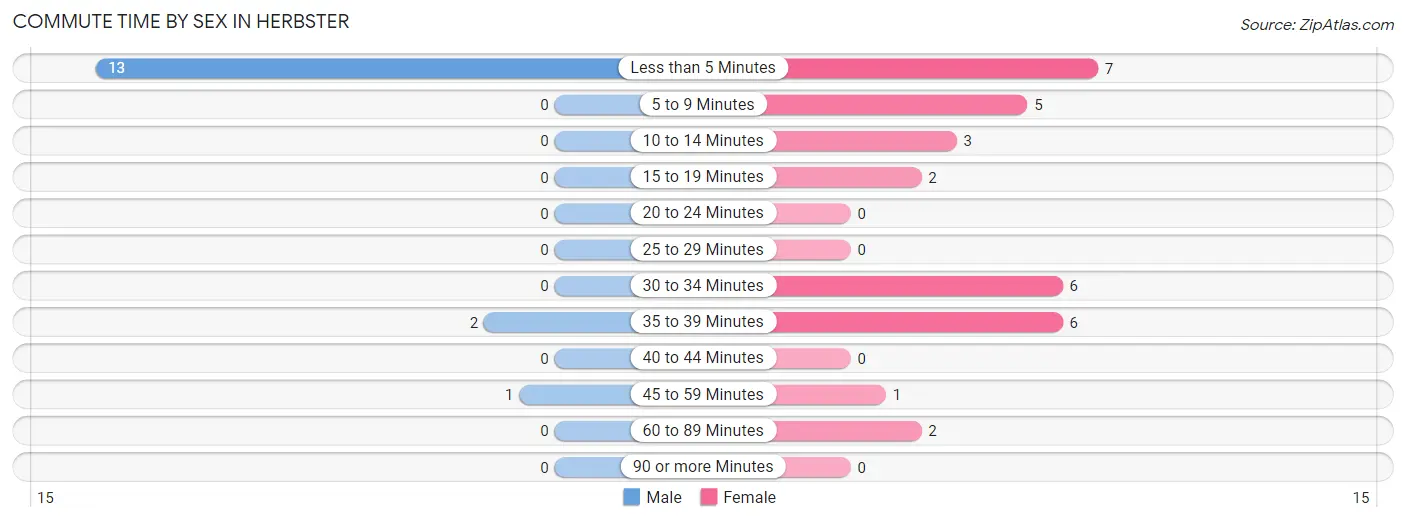
| Commute Time | Male | Female |
| Less than 5 Minutes | 13 (81.2%) | 7 (21.9%) |
| 5 to 9 Minutes | 0 (0.0%) | 5 (15.6%) |
| 10 to 14 Minutes | 0 (0.0%) | 3 (9.4%) |
| 15 to 19 Minutes | 0 (0.0%) | 2 (6.2%) |
| 20 to 24 Minutes | 0 (0.0%) | 0 (0.0%) |
| 25 to 29 Minutes | 0 (0.0%) | 0 (0.0%) |
| 30 to 34 Minutes | 0 (0.0%) | 6 (18.8%) |
| 35 to 39 Minutes | 2 (12.5%) | 6 (18.8%) |
| 40 to 44 Minutes | 0 (0.0%) | 0 (0.0%) |
| 45 to 59 Minutes | 1 (6.2%) | 1 (3.1%) |
| 60 to 89 Minutes | 0 (0.0%) | 2 (6.2%) |
| 90 or more Minutes | 0 (0.0%) | 0 (0.0%) |
Time of Departure to Work by Sex in Herbster
The most frequent times of departure to work in Herbster are 7:00 AM to 7:29 AM (12, 75.0%) for males and 4:00 PM to 11:59 PM (7, 21.9%) for females.
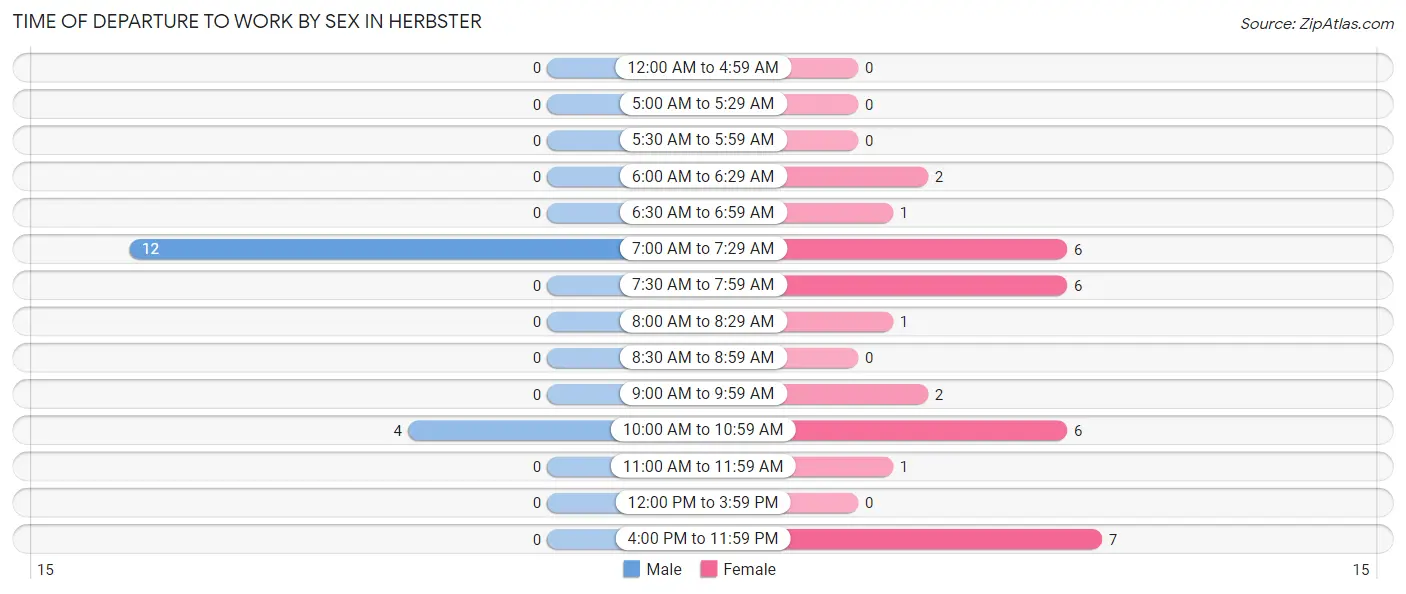
| Time of Departure | Male | Female |
| 12:00 AM to 4:59 AM | 0 (0.0%) | 0 (0.0%) |
| 5:00 AM to 5:29 AM | 0 (0.0%) | 0 (0.0%) |
| 5:30 AM to 5:59 AM | 0 (0.0%) | 0 (0.0%) |
| 6:00 AM to 6:29 AM | 0 (0.0%) | 2 (6.2%) |
| 6:30 AM to 6:59 AM | 0 (0.0%) | 1 (3.1%) |
| 7:00 AM to 7:29 AM | 12 (75.0%) | 6 (18.8%) |
| 7:30 AM to 7:59 AM | 0 (0.0%) | 6 (18.8%) |
| 8:00 AM to 8:29 AM | 0 (0.0%) | 1 (3.1%) |
| 8:30 AM to 8:59 AM | 0 (0.0%) | 0 (0.0%) |
| 9:00 AM to 9:59 AM | 0 (0.0%) | 2 (6.2%) |
| 10:00 AM to 10:59 AM | 4 (25.0%) | 6 (18.8%) |
| 11:00 AM to 11:59 AM | 0 (0.0%) | 1 (3.1%) |
| 12:00 PM to 3:59 PM | 0 (0.0%) | 0 (0.0%) |
| 4:00 PM to 11:59 PM | 0 (0.0%) | 7 (21.9%) |
| Total | 16 (100.0%) | 32 (100.0%) |
Housing Occupancy in Herbster
Occupancy by Ownership in Herbster
Of the total 55 dwellings in Herbster, owner-occupied units account for 45 (81.8%), while renter-occupied units make up 10 (18.2%).
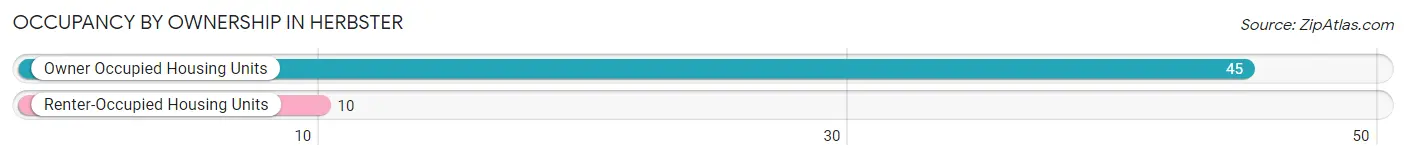
| Occupancy | # Housing Units | % Housing Units |
| Owner Occupied Housing Units | 45 | 81.8% |
| Renter-Occupied Housing Units | 10 | 18.2% |
| Total Occupied Housing Units | 55 | 100.0% |
Occupancy by Household Size in Herbster
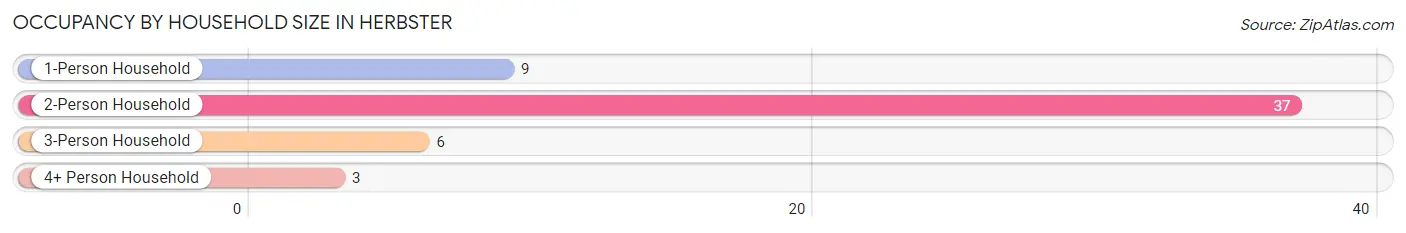
| Household Size | # Housing Units | % Housing Units |
| 1-Person Household | 9 | 16.4% |
| 2-Person Household | 37 | 67.3% |
| 3-Person Household | 6 | 10.9% |
| 4+ Person Household | 3 | 5.4% |
| Total Housing Units | 55 | 100.0% |
Occupancy by Ownership by Household Size in Herbster
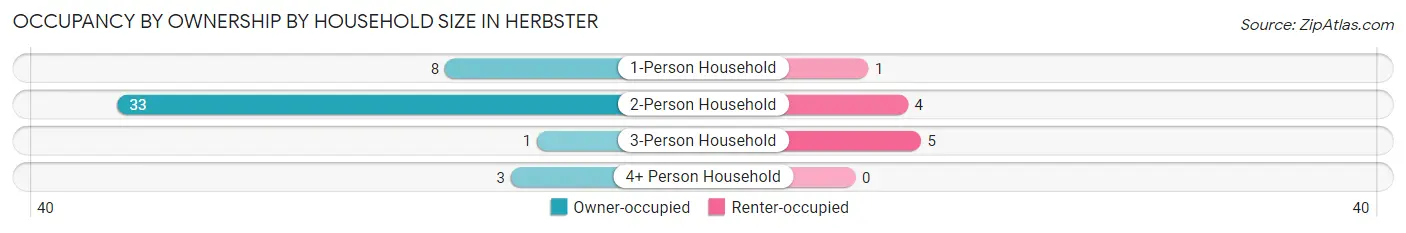
| Household Size | Owner-occupied | Renter-occupied |
| 1-Person Household | 8 (88.9%) | 1 (11.1%) |
| 2-Person Household | 33 (89.2%) | 4 (10.8%) |
| 3-Person Household | 1 (16.7%) | 5 (83.3%) |
| 4+ Person Household | 3 (100.0%) | 0 (0.0%) |
| Total Housing Units | 45 (81.8%) | 10 (18.2%) |
Occupancy by Educational Attainment in Herbster
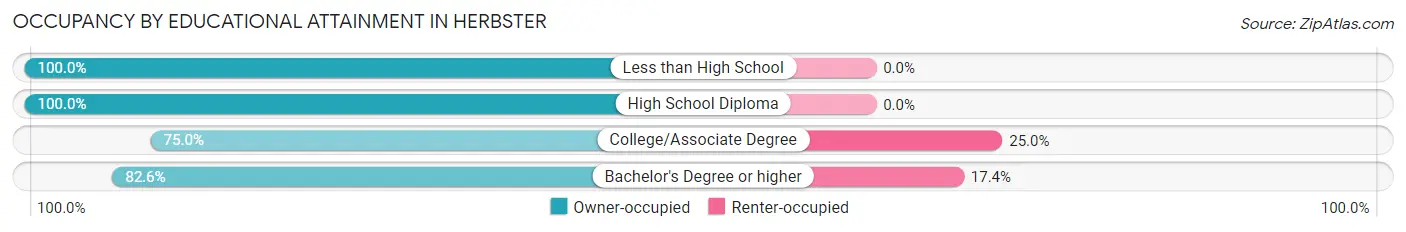
| Household Size | Owner-occupied | Renter-occupied |
| Less than High School | 1 (100.0%) | 0 (0.0%) |
| High School Diploma | 7 (100.0%) | 0 (0.0%) |
| College/Associate Degree | 18 (75.0%) | 6 (25.0%) |
| Bachelor's Degree or higher | 19 (82.6%) | 4 (17.4%) |
Occupancy by Age of Householder in Herbster
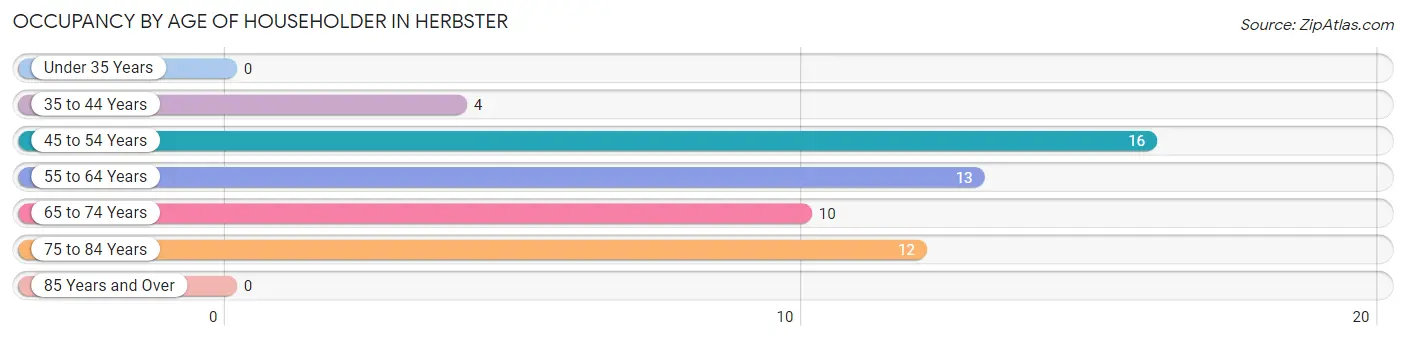
| Age Bracket | # Households | % Households |
| Under 35 Years | 0 | 0.0% |
| 35 to 44 Years | 4 | 7.3% |
| 45 to 54 Years | 16 | 29.1% |
| 55 to 64 Years | 13 | 23.6% |
| 65 to 74 Years | 10 | 18.2% |
| 75 to 84 Years | 12 | 21.8% |
| 85 Years and Over | 0 | 0.0% |
| Total | 55 | 100.0% |
Housing Finances in Herbster
Median Income by Occupancy in Herbster
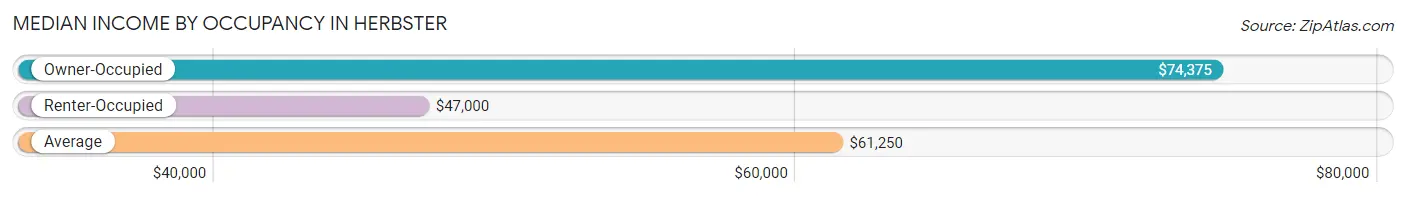
| Occupancy Type | # Households | Median Income |
| Owner-Occupied | 45 (81.8%) | $74,375 |
| Renter-Occupied | 10 (18.2%) | $47,000 |
| Average | 55 (100.0%) | $61,250 |
Occupancy by Householder Income Bracket in Herbster
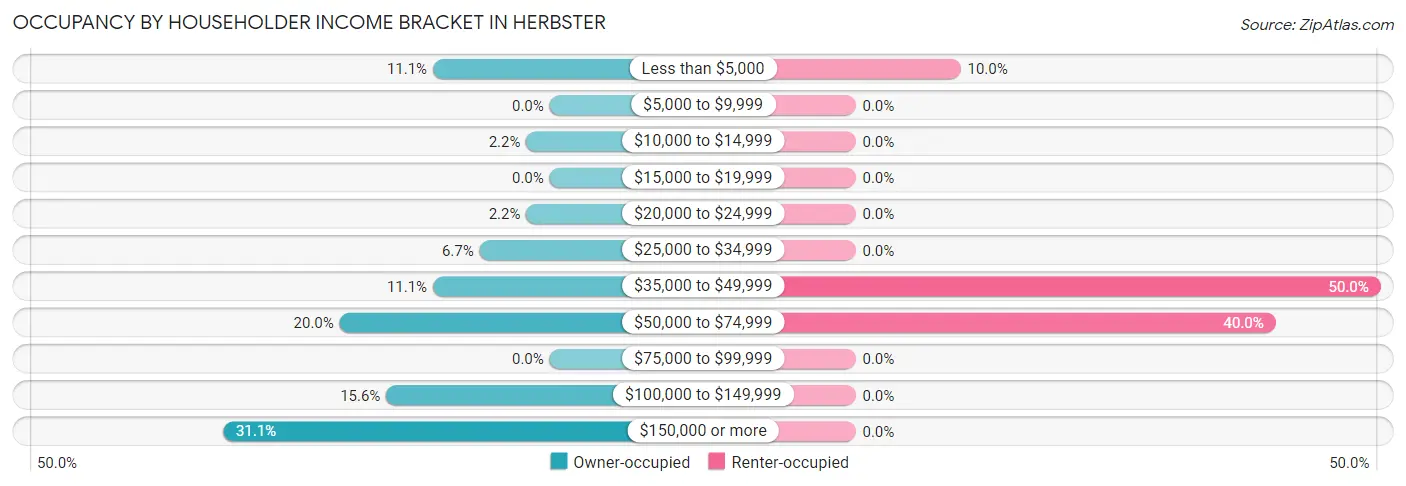
| Income Bracket | Owner-occupied | Renter-occupied |
| Less than $5,000 | 5 (11.1%) | 1 (10.0%) |
| $5,000 to $9,999 | 0 (0.0%) | 0 (0.0%) |
| $10,000 to $14,999 | 1 (2.2%) | 0 (0.0%) |
| $15,000 to $19,999 | 0 (0.0%) | 0 (0.0%) |
| $20,000 to $24,999 | 1 (2.2%) | 0 (0.0%) |
| $25,000 to $34,999 | 3 (6.7%) | 0 (0.0%) |
| $35,000 to $49,999 | 5 (11.1%) | 5 (50.0%) |
| $50,000 to $74,999 | 9 (20.0%) | 4 (40.0%) |
| $75,000 to $99,999 | 0 (0.0%) | 0 (0.0%) |
| $100,000 to $149,999 | 7 (15.6%) | 0 (0.0%) |
| $150,000 or more | 14 (31.1%) | 0 (0.0%) |
| Total | 45 (100.0%) | 10 (100.0%) |
Monthly Housing Cost Tiers in Herbster
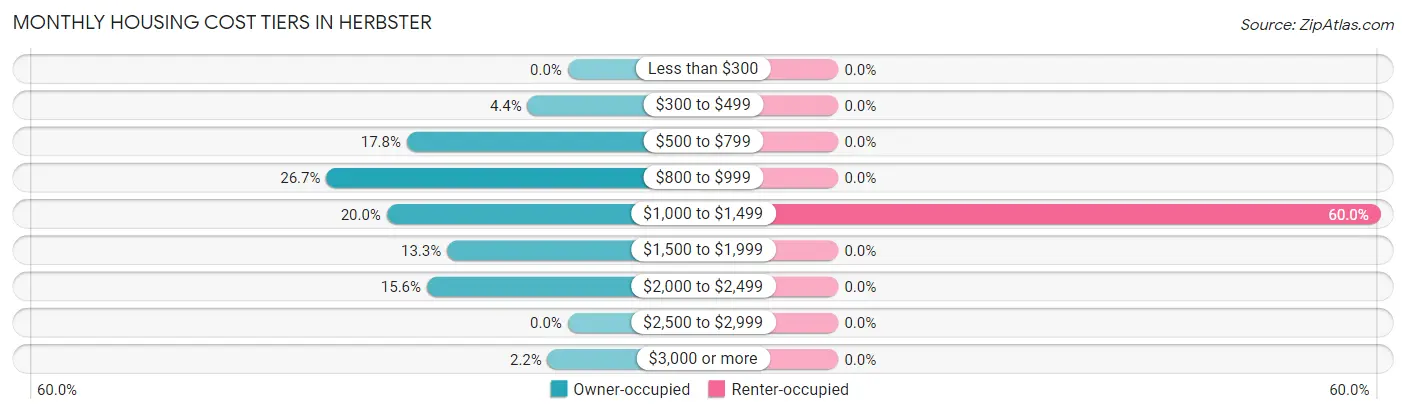
| Monthly Cost | Owner-occupied | Renter-occupied |
| Less than $300 | 0 (0.0%) | 0 (0.0%) |
| $300 to $499 | 2 (4.4%) | 0 (0.0%) |
| $500 to $799 | 8 (17.8%) | 0 (0.0%) |
| $800 to $999 | 12 (26.7%) | 0 (0.0%) |
| $1,000 to $1,499 | 9 (20.0%) | 6 (60.0%) |
| $1,500 to $1,999 | 6 (13.3%) | 0 (0.0%) |
| $2,000 to $2,499 | 7 (15.6%) | 0 (0.0%) |
| $2,500 to $2,999 | 0 (0.0%) | 0 (0.0%) |
| $3,000 or more | 1 (2.2%) | 0 (0.0%) |
| Total | 45 (100.0%) | 10 (100.0%) |
Physical Housing Characteristics in Herbster
Housing Structures in Herbster
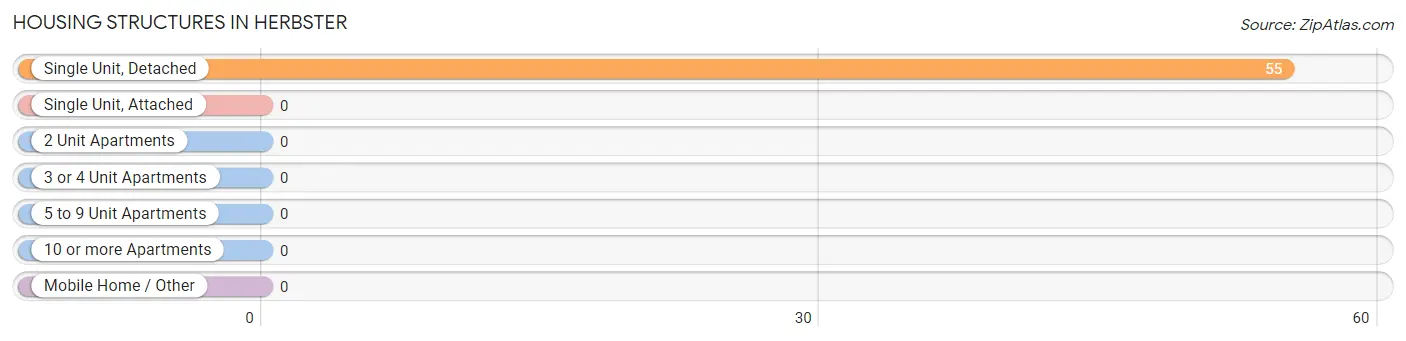
| Structure Type | # Housing Units | % Housing Units |
| Single Unit, Detached | 55 | 100.0% |
| Single Unit, Attached | 0 | 0.0% |
| 2 Unit Apartments | 0 | 0.0% |
| 3 or 4 Unit Apartments | 0 | 0.0% |
| 5 to 9 Unit Apartments | 0 | 0.0% |
| 10 or more Apartments | 0 | 0.0% |
| Mobile Home / Other | 0 | 0.0% |
| Total | 55 | 100.0% |
Housing Structures by Occupancy in Herbster
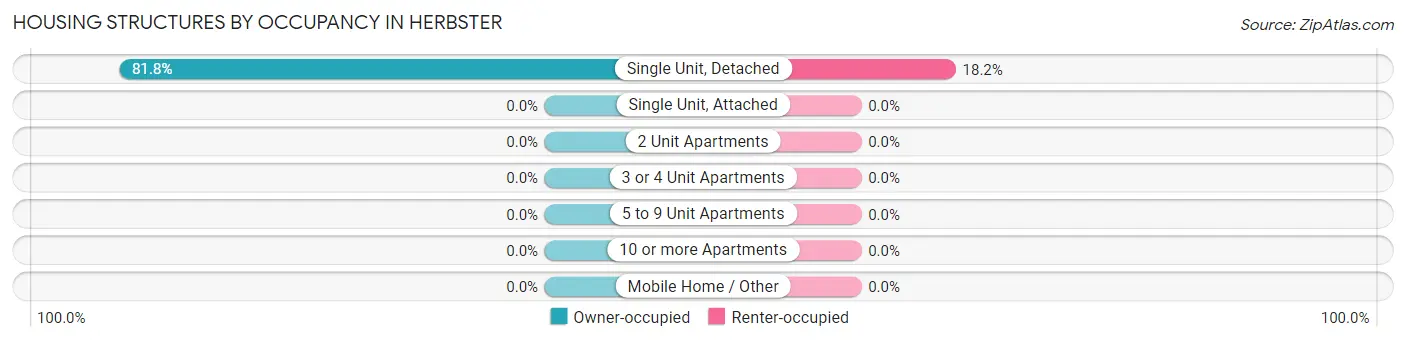
| Structure Type | Owner-occupied | Renter-occupied |
| Single Unit, Detached | 45 (81.8%) | 10 (18.2%) |
| Single Unit, Attached | 0 (0.0%) | 0 (0.0%) |
| 2 Unit Apartments | 0 (0.0%) | 0 (0.0%) |
| 3 or 4 Unit Apartments | 0 (0.0%) | 0 (0.0%) |
| 5 to 9 Unit Apartments | 0 (0.0%) | 0 (0.0%) |
| 10 or more Apartments | 0 (0.0%) | 0 (0.0%) |
| Mobile Home / Other | 0 (0.0%) | 0 (0.0%) |
| Total | 45 (81.8%) | 10 (18.2%) |
Housing Structures by Number of Rooms in Herbster
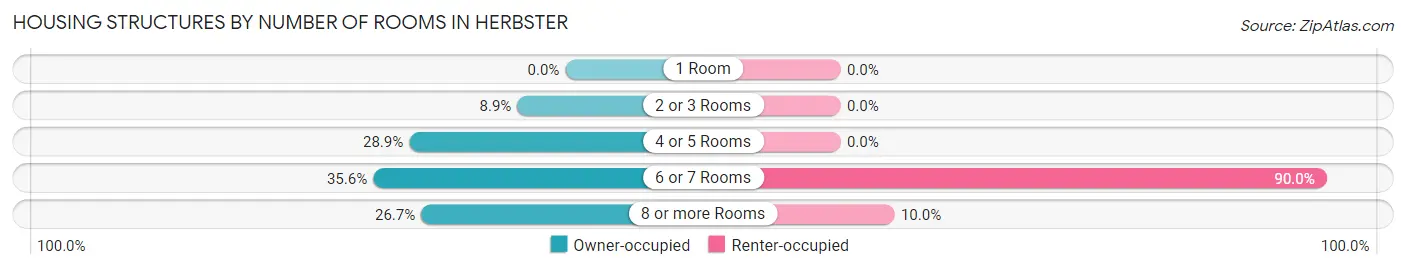
| Number of Rooms | Owner-occupied | Renter-occupied |
| 1 Room | 0 (0.0%) | 0 (0.0%) |
| 2 or 3 Rooms | 4 (8.9%) | 0 (0.0%) |
| 4 or 5 Rooms | 13 (28.9%) | 0 (0.0%) |
| 6 or 7 Rooms | 16 (35.6%) | 9 (90.0%) |
| 8 or more Rooms | 12 (26.7%) | 1 (10.0%) |
| Total | 45 (100.0%) | 10 (100.0%) |
Housing Structure by Heating Type in Herbster
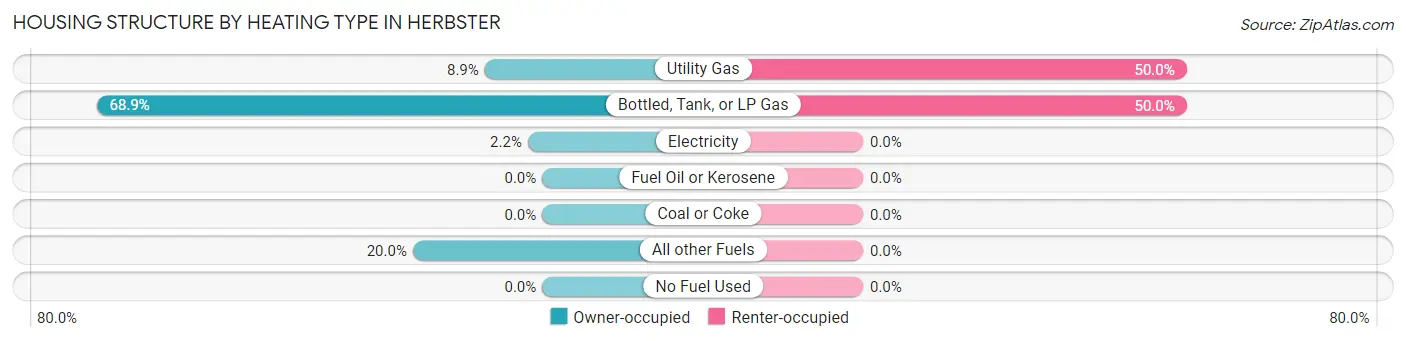
| Heating Type | Owner-occupied | Renter-occupied |
| Utility Gas | 4 (8.9%) | 5 (50.0%) |
| Bottled, Tank, or LP Gas | 31 (68.9%) | 5 (50.0%) |
| Electricity | 1 (2.2%) | 0 (0.0%) |
| Fuel Oil or Kerosene | 0 (0.0%) | 0 (0.0%) |
| Coal or Coke | 0 (0.0%) | 0 (0.0%) |
| All other Fuels | 9 (20.0%) | 0 (0.0%) |
| No Fuel Used | 0 (0.0%) | 0 (0.0%) |
| Total | 45 (100.0%) | 10 (100.0%) |
Household Vehicle Usage in Herbster
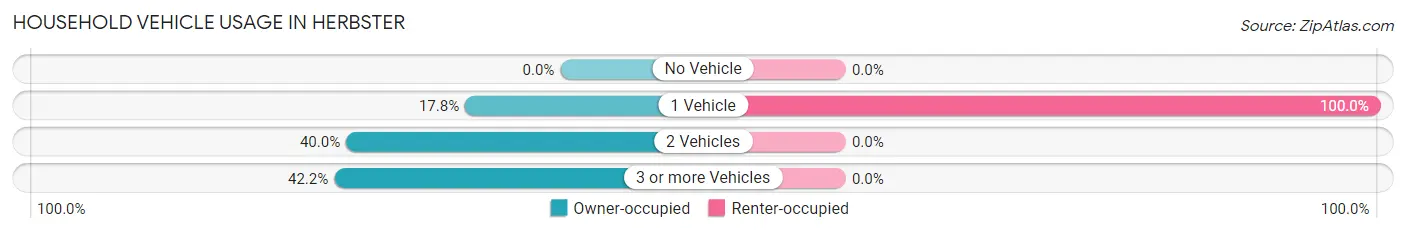
| Vehicles per Household | Owner-occupied | Renter-occupied |
| No Vehicle | 0 (0.0%) | 0 (0.0%) |
| 1 Vehicle | 8 (17.8%) | 10 (100.0%) |
| 2 Vehicles | 18 (40.0%) | 0 (0.0%) |
| 3 or more Vehicles | 19 (42.2%) | 0 (0.0%) |
| Total | 45 (100.0%) | 10 (100.0%) |
Real Estate & Mortgages in Herbster
Real Estate and Mortgage Overview in Herbster
| Characteristic | Without Mortgage | With Mortgage |
| Housing Units | 27 | 18 |
| Median Property Value | $368,200 | $164,300 |
| Median Household Income | - | - |
| Monthly Housing Costs | $892 | $1 |
| Real Estate Taxes | $4,917 | $0 |
Property Value by Mortgage Status in Herbster
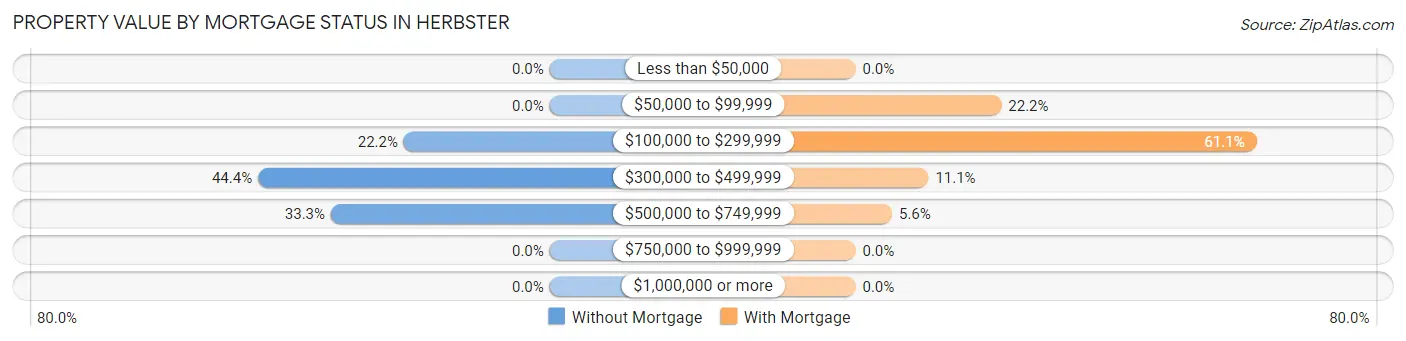
| Property Value | Without Mortgage | With Mortgage |
| Less than $50,000 | 0 (0.0%) | 0 (0.0%) |
| $50,000 to $99,999 | 0 (0.0%) | 4 (22.2%) |
| $100,000 to $299,999 | 6 (22.2%) | 11 (61.1%) |
| $300,000 to $499,999 | 12 (44.4%) | 2 (11.1%) |
| $500,000 to $749,999 | 9 (33.3%) | 1 (5.6%) |
| $750,000 to $999,999 | 0 (0.0%) | 0 (0.0%) |
| $1,000,000 or more | 0 (0.0%) | 0 (0.0%) |
| Total | 27 (100.0%) | 18 (100.0%) |
Household Income by Mortgage Status in Herbster
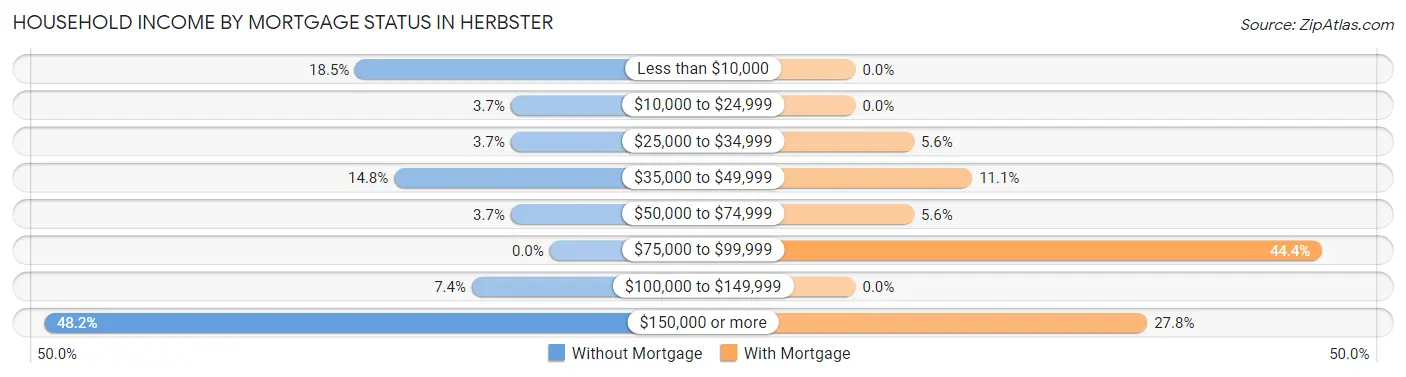
| Household Income | Without Mortgage | With Mortgage |
| Less than $10,000 | 5 (18.5%) | 0 (0.0%) |
| $10,000 to $24,999 | 1 (3.7%) | 0 (0.0%) |
| $25,000 to $34,999 | 1 (3.7%) | 1 (5.6%) |
| $35,000 to $49,999 | 4 (14.8%) | 2 (11.1%) |
| $50,000 to $74,999 | 1 (3.7%) | 1 (5.6%) |
| $75,000 to $99,999 | 0 (0.0%) | 8 (44.4%) |
| $100,000 to $149,999 | 2 (7.4%) | 0 (0.0%) |
| $150,000 or more | 13 (48.1%) | 5 (27.8%) |
| Total | 27 (100.0%) | 18 (100.0%) |
Property Value to Household Income Ratio in Herbster
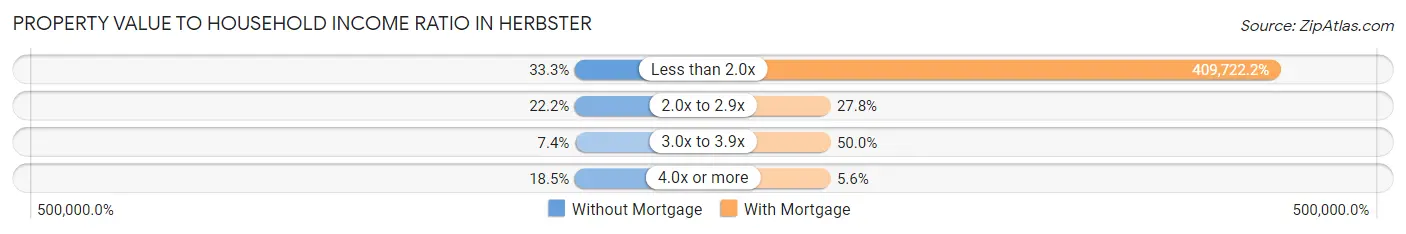
| Value-to-Income Ratio | Without Mortgage | With Mortgage |
| Less than 2.0x | 9 (33.3%) | 73,750 (409,722.2%) |
| 2.0x to 2.9x | 6 (22.2%) | 5 (27.8%) |
| 3.0x to 3.9x | 2 (7.4%) | 9 (50.0%) |
| 4.0x or more | 5 (18.5%) | 1 (5.6%) |
| Total | 27 (100.0%) | 18 (100.0%) |
Real Estate Taxes by Mortgage Status in Herbster
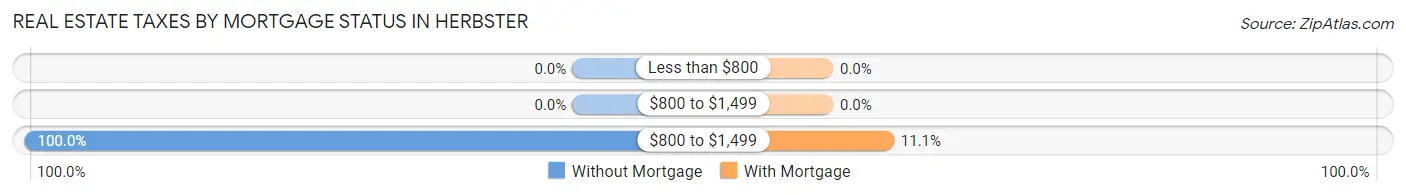
| Property Taxes | Without Mortgage | With Mortgage |
| Less than $800 | 0 (0.0%) | 0 (0.0%) |
| $800 to $1,499 | 0 (0.0%) | 0 (0.0%) |
| $800 to $1,499 | 27 (100.0%) | 2 (11.1%) |
| Total | 27 (100.0%) | 18 (100.0%) |
Health & Disability in Herbster
Health Insurance Coverage by Age in Herbster
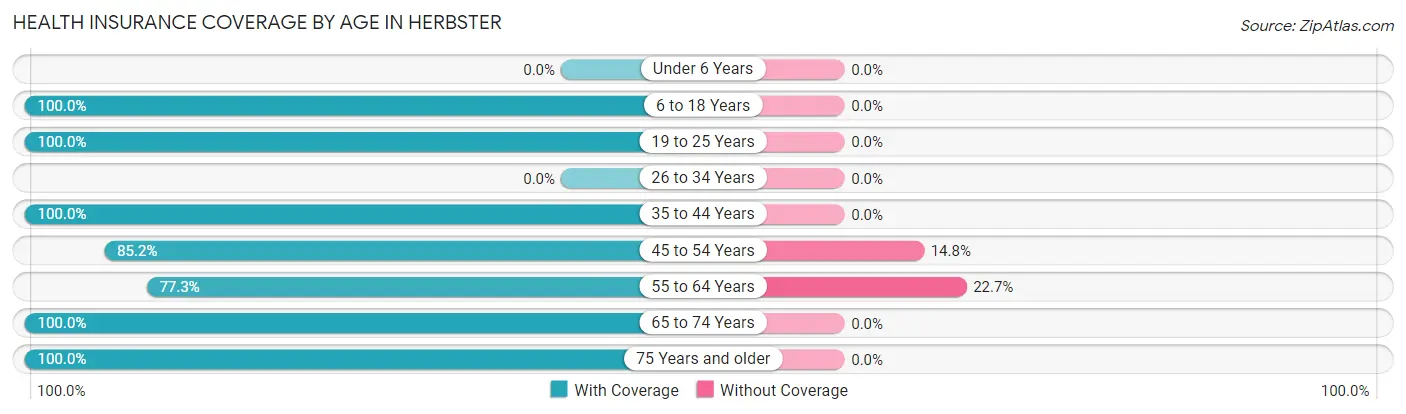
| Age Bracket | With Coverage | Without Coverage |
| Under 6 Years | 0 (0.0%) | 0 (0.0%) |
| 6 to 18 Years | 6 (100.0%) | 0 (0.0%) |
| 19 to 25 Years | 7 (100.0%) | 0 (0.0%) |
| 26 to 34 Years | 0 (0.0%) | 0 (0.0%) |
| 35 to 44 Years | 5 (100.0%) | 0 (0.0%) |
| 45 to 54 Years | 23 (85.2%) | 4 (14.8%) |
| 55 to 64 Years | 17 (77.3%) | 5 (22.7%) |
| 65 to 74 Years | 20 (100.0%) | 0 (0.0%) |
| 75 Years and older | 20 (100.0%) | 0 (0.0%) |
| Total | 98 (91.6%) | 9 (8.4%) |
Health Insurance Coverage by Citizenship Status in Herbster
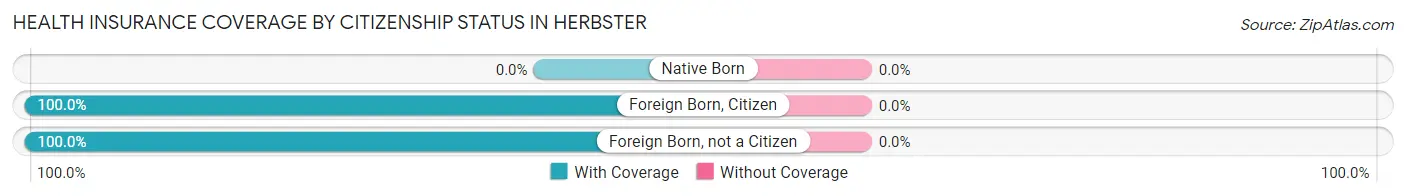
| Citizenship Status | With Coverage | Without Coverage |
| Native Born | 0 (0.0%) | 0 (0.0%) |
| Foreign Born, Citizen | 6 (100.0%) | 0 (0.0%) |
| Foreign Born, not a Citizen | 7 (100.0%) | 0 (0.0%) |
Health Insurance Coverage by Household Income in Herbster
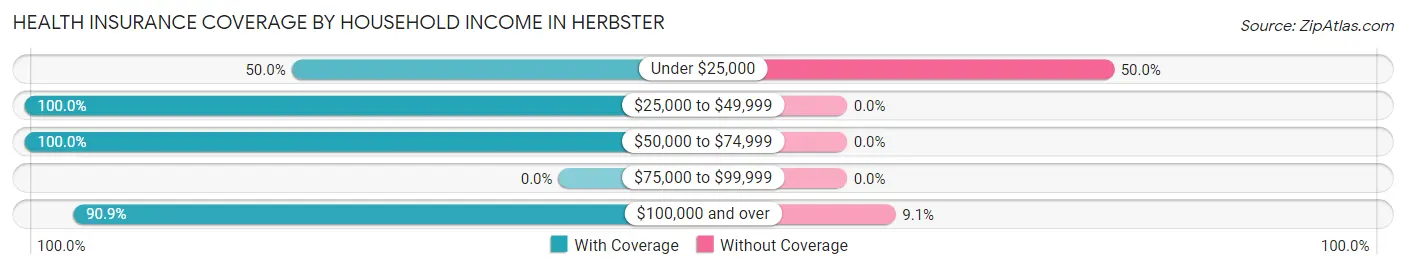
| Household Income | With Coverage | Without Coverage |
| Under $25,000 | 5 (50.0%) | 5 (50.0%) |
| $25,000 to $49,999 | 29 (100.0%) | 0 (0.0%) |
| $50,000 to $74,999 | 24 (100.0%) | 0 (0.0%) |
| $75,000 to $99,999 | 0 (0.0%) | 0 (0.0%) |
| $100,000 and over | 40 (90.9%) | 4 (9.1%) |
Public vs Private Health Insurance Coverage by Age in Herbster
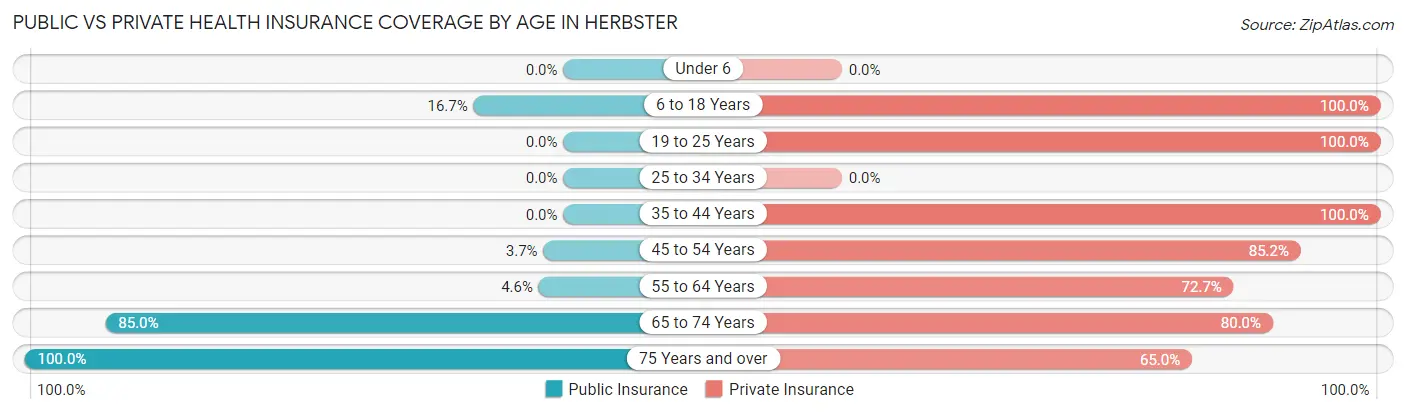
| Age Bracket | Public Insurance | Private Insurance |
| Under 6 | 0 (0.0%) | 0 (0.0%) |
| 6 to 18 Years | 1 (16.7%) | 6 (100.0%) |
| 19 to 25 Years | 0 (0.0%) | 7 (100.0%) |
| 25 to 34 Years | 0 (0.0%) | 0 (0.0%) |
| 35 to 44 Years | 0 (0.0%) | 5 (100.0%) |
| 45 to 54 Years | 1 (3.7%) | 23 (85.2%) |
| 55 to 64 Years | 1 (4.5%) | 16 (72.7%) |
| 65 to 74 Years | 17 (85.0%) | 16 (80.0%) |
| 75 Years and over | 20 (100.0%) | 13 (65.0%) |
| Total | 40 (37.4%) | 86 (80.4%) |
Disability Status by Sex by Age in Herbster
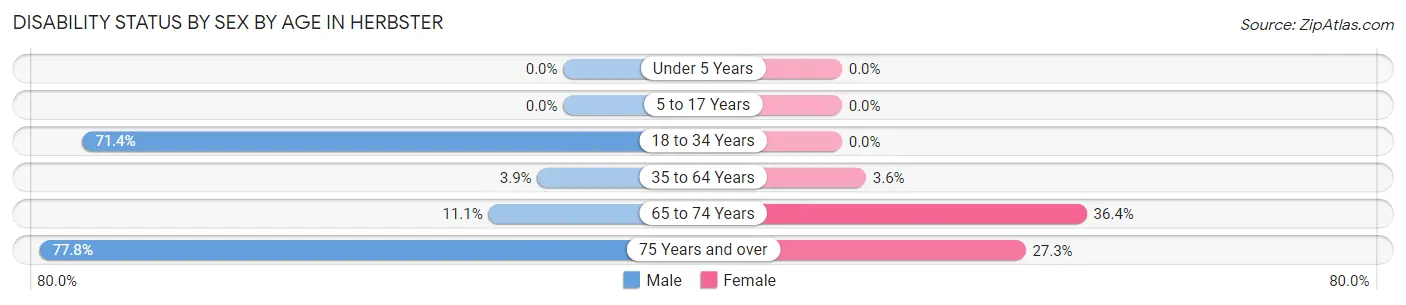
| Age Bracket | Male | Female |
| Under 5 Years | 0 (0.0%) | 0 (0.0%) |
| 5 to 17 Years | 0 (0.0%) | 0 (0.0%) |
| 18 to 34 Years | 5 (71.4%) | 0 (0.0%) |
| 35 to 64 Years | 1 (3.8%) | 1 (3.6%) |
| 65 to 74 Years | 1 (11.1%) | 4 (36.4%) |
| 75 Years and over | 7 (77.8%) | 3 (27.3%) |
Disability Class by Sex by Age in Herbster
Disability Class: Hearing Difficulty
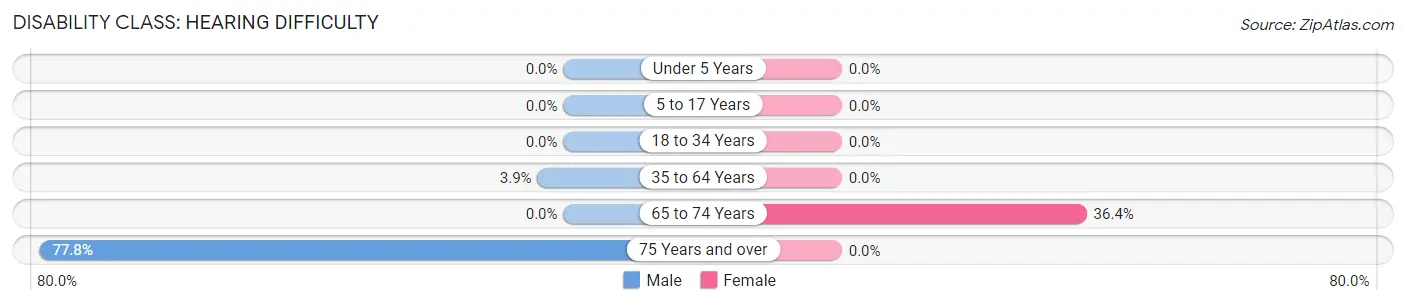
| Age Bracket | Male | Female |
| Under 5 Years | 0 (0.0%) | 0 (0.0%) |
| 5 to 17 Years | 0 (0.0%) | 0 (0.0%) |
| 18 to 34 Years | 0 (0.0%) | 0 (0.0%) |
| 35 to 64 Years | 1 (3.8%) | 0 (0.0%) |
| 65 to 74 Years | 0 (0.0%) | 4 (36.4%) |
| 75 Years and over | 7 (77.8%) | 0 (0.0%) |
Disability Class: Vision Difficulty
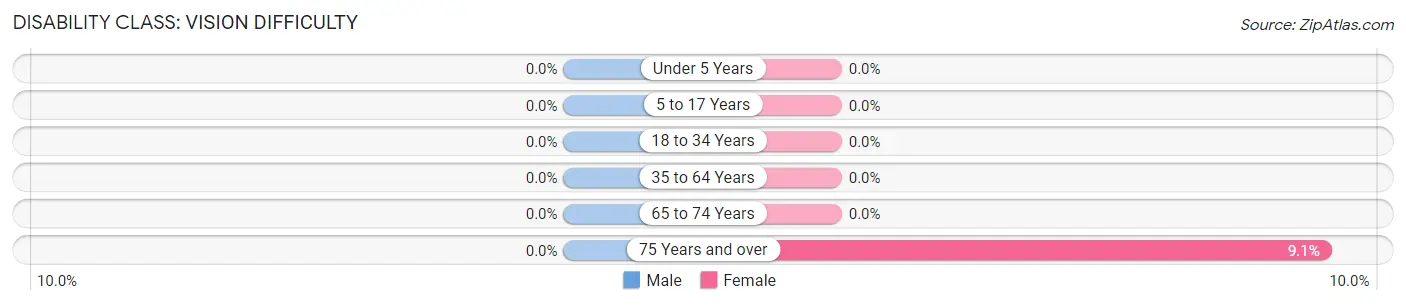
| Age Bracket | Male | Female |
| Under 5 Years | 0 (0.0%) | 0 (0.0%) |
| 5 to 17 Years | 0 (0.0%) | 0 (0.0%) |
| 18 to 34 Years | 0 (0.0%) | 0 (0.0%) |
| 35 to 64 Years | 0 (0.0%) | 0 (0.0%) |
| 65 to 74 Years | 0 (0.0%) | 0 (0.0%) |
| 75 Years and over | 0 (0.0%) | 1 (9.1%) |
Disability Class: Cognitive Difficulty
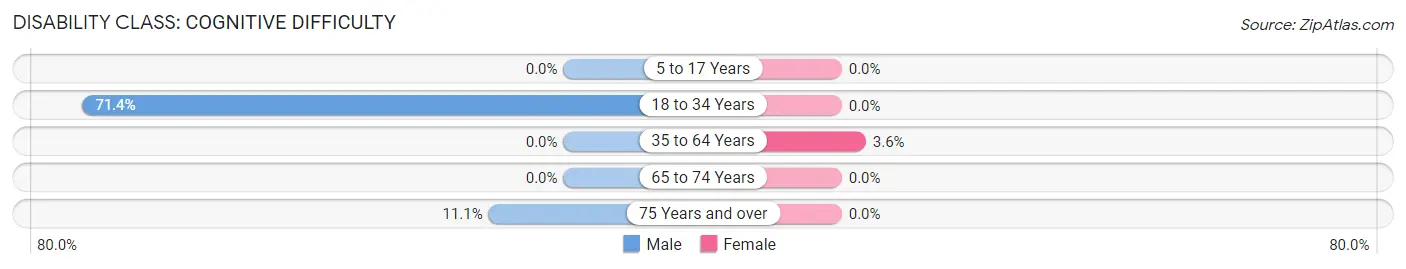
| Age Bracket | Male | Female |
| 5 to 17 Years | 0 (0.0%) | 0 (0.0%) |
| 18 to 34 Years | 5 (71.4%) | 0 (0.0%) |
| 35 to 64 Years | 0 (0.0%) | 1 (3.6%) |
| 65 to 74 Years | 0 (0.0%) | 0 (0.0%) |
| 75 Years and over | 1 (11.1%) | 0 (0.0%) |
Disability Class: Ambulatory Difficulty
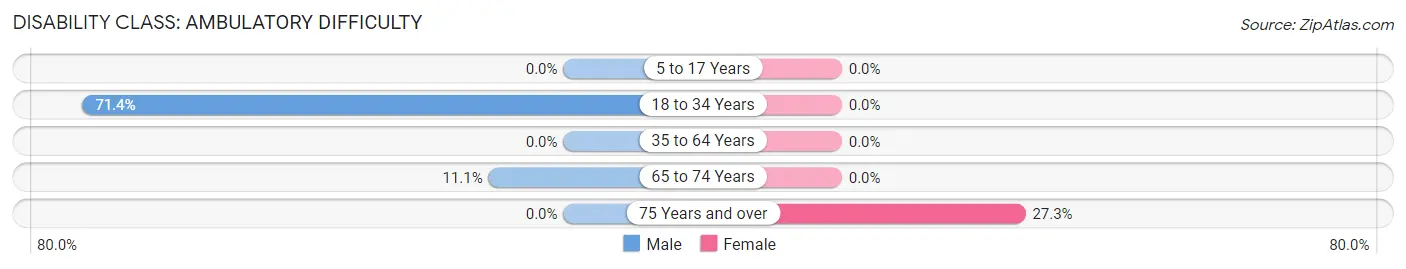
| Age Bracket | Male | Female |
| 5 to 17 Years | 0 (0.0%) | 0 (0.0%) |
| 18 to 34 Years | 5 (71.4%) | 0 (0.0%) |
| 35 to 64 Years | 0 (0.0%) | 0 (0.0%) |
| 65 to 74 Years | 1 (11.1%) | 0 (0.0%) |
| 75 Years and over | 0 (0.0%) | 3 (27.3%) |
Disability Class: Self-Care Difficulty
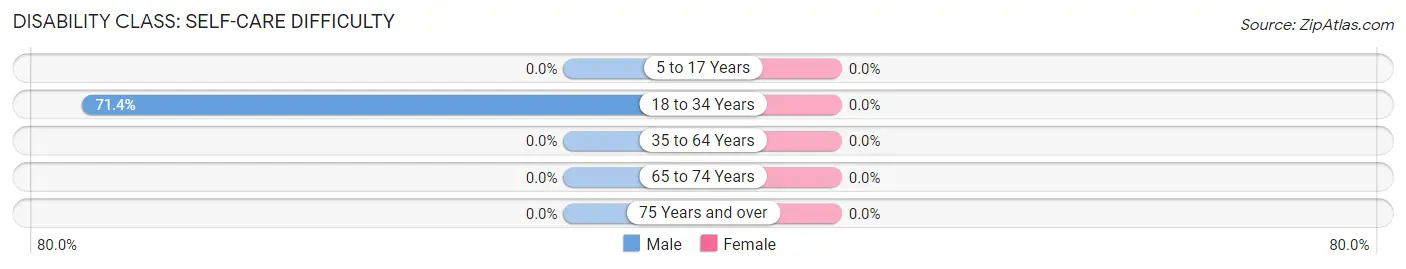
| Age Bracket | Male | Female |
| 5 to 17 Years | 0 (0.0%) | 0 (0.0%) |
| 18 to 34 Years | 5 (71.4%) | 0 (0.0%) |
| 35 to 64 Years | 0 (0.0%) | 0 (0.0%) |
| 65 to 74 Years | 0 (0.0%) | 0 (0.0%) |
| 75 Years and over | 0 (0.0%) | 0 (0.0%) |
Technology Access in Herbster
Computing Device Access in Herbster
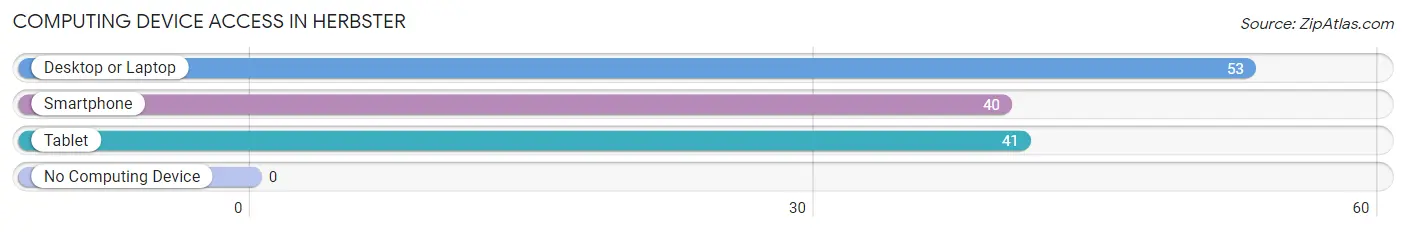
| Device Type | # Households | % Households |
| Desktop or Laptop | 53 | 96.4% |
| Smartphone | 40 | 72.7% |
| Tablet | 41 | 74.6% |
| No Computing Device | 0 | 0.0% |
| Total | 55 | 100.0% |
Internet Access in Herbster
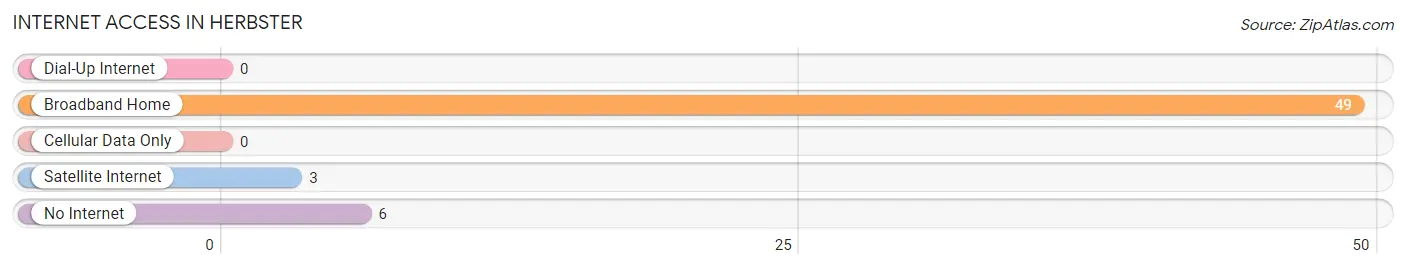
| Internet Type | # Households | % Households |
| Dial-Up Internet | 0 | 0.0% |
| Broadband Home | 49 | 89.1% |
| Cellular Data Only | 0 | 0.0% |
| Satellite Internet | 3 | 5.4% |
| No Internet | 6 | 10.9% |
| Total | 55 | 100.0% |
Herbster Summary
Herbster, Wisconsin is a small unincorporated community located in the northwest corner of Bayfield County, Wisconsin. It is situated on the shore of Lake Superior, just south of the Apostle Islands National Lakeshore. The community is home to a population of approximately 200 people, and is known for its picturesque views of the lake and its surrounding forests.
History
Herbster was first settled in the late 1800s by a group of Finnish immigrants. The community was named after the Herbster family, who were among the first settlers. The Herbsters were a prominent family in the area, and their descendants still live in the area today.
The community was originally a logging and fishing village, and the Herbster family was heavily involved in both industries. In the early 1900s, the Herbsters opened a sawmill and a fish processing plant, which provided employment for many of the local residents.
In the 1950s, the Herbster family sold their sawmill and fish processing plant, and the community began to transition to a more tourism-based economy. Today, Herbster is a popular destination for tourists, who come to enjoy the area’s natural beauty and recreational opportunities.
Geography
Herbster is located in the northwest corner of Bayfield County, Wisconsin. It is situated on the shore of Lake Superior, just south of the Apostle Islands National Lakeshore. The community is surrounded by forests and is home to a variety of wildlife, including deer, bear, and bald eagles.
The area is known for its rugged beauty, and is a popular destination for hikers, campers, and boaters. The community is also home to a number of small businesses, including a general store, a restaurant, and a marina.
Economy
Herbster’s economy is largely based on tourism. The community is a popular destination for visitors who come to enjoy the area’s natural beauty and recreational opportunities. The community is also home to a number of small businesses, including a general store, a restaurant, and a marina.
The community is also home to a number of small-scale logging and fishing operations. These operations provide employment for many of the local residents.
Demographics
As of the 2010 census, Herbster had a population of approximately 200 people. The population is predominantly white (97.5%), with a small percentage of Native American (1.5%) and African American (1%) residents. The median household income is $37,500, and the median age is 44.
Herbster is a close-knit community, and the residents take pride in their small-town way of life. The community is known for its friendly atmosphere and its commitment to preserving the area’s natural beauty.
Common Questions
What is Per Capita Income in Herbster?
Per Capita income in Herbster is $50,472.
What is the Median Family Income in Herbster?
Median Family Income in Herbster is $73,333.
What is the Median Household income in Herbster?
Median Household Income in Herbster is $61,250.
What is Inequality or Gini Index in Herbster?
Inequality or Gini Index in Herbster is 0.48.
What is the Total Population of Herbster?
Total Population of Herbster is 107.
What is the Total Male Population of Herbster?
Total Male Population of Herbster is 57.
What is the Total Female Population of Herbster?
Total Female Population of Herbster is 50.
What is the Ratio of Males per 100 Females in Herbster?
There are 114.00 Males per 100 Females in Herbster.
What is the Ratio of Females per 100 Males in Herbster?
There are 87.72 Females per 100 Males in Herbster.
What is the Median Population Age in Herbster?
Median Population Age in Herbster is 61.1 Years.
What is the Average Family Size in Herbster
Average Family Size in Herbster is 2.1 People.
What is the Average Household Size in Herbster
Average Household Size in Herbster is 1.9 People.
How Large is the Labor Force in Herbster?
There are 61 People in the Labor Forcein in Herbster.
What is the Percentage of People in the Labor Force in Herbster?
57.0% of People are in the Labor Force in Herbster.