Lublin, WI Map & Demographics
Lublin Map
Lublin Overview
$38,410
PER CAPITA INCOME
$75,833
AVG FAMILY INCOME
$40,000
AVG HOUSEHOLD INCOME
53.0%
WAGE / INCOME GAP [ % ]
47.0¢/ $1
WAGE / INCOME GAP [ $ ]
0.52
INEQUALITY / GINI INDEX
105
TOTAL POPULATION
53
MALE POPULATION
52
FEMALE POPULATION
101.92
MALES / 100 FEMALES
98.11
FEMALES / 100 MALES
56.5
MEDIAN AGE
2.7
AVG FAMILY SIZE
1.7
AVG HOUSEHOLD SIZE
57
LABOR FORCE [ PEOPLE ]
58.8%
PERCENT IN LABOR FORCE
Lublin Zip Codes
Lublin Area Codes
Income in Lublin
Income Overview in Lublin
Per Capita Income in Lublin is $38,410, while median incomes of families and households are $75,833 and $40,000 respectively.
| Characteristic | Number | Measure |
| Per Capita Income | 105 | $38,410 |
| Median Family Income | 24 | $75,833 |
| Mean Family Income | 24 | $74,667 |
| Median Household Income | 62 | $40,000 |
| Mean Household Income | 62 | $60,679 |
| Income Deficit | 24 | $0 |
| Wage / Income Gap (%) | 105 | 53.03% |
| Wage / Income Gap ($) | 105 | 46.97¢ per $1 |
| Gini / Inequality Index | 105 | 0.52 |
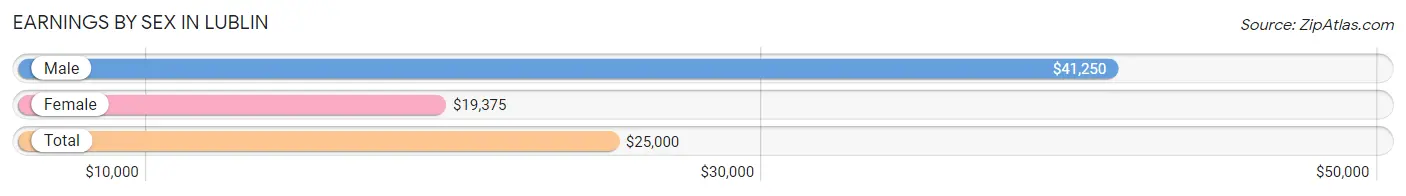
Earnings by Sex in Lublin
Average Earnings in Lublin are $25,000, $41,250 for men and $19,375 for women, a difference of 53.0%.
| Sex | Number | Average Earnings |
| Male | 28 (45.2%) | $41,250 |
| Female | 34 (54.8%) | $19,375 |
| Total | 62 (100.0%) | $25,000 |
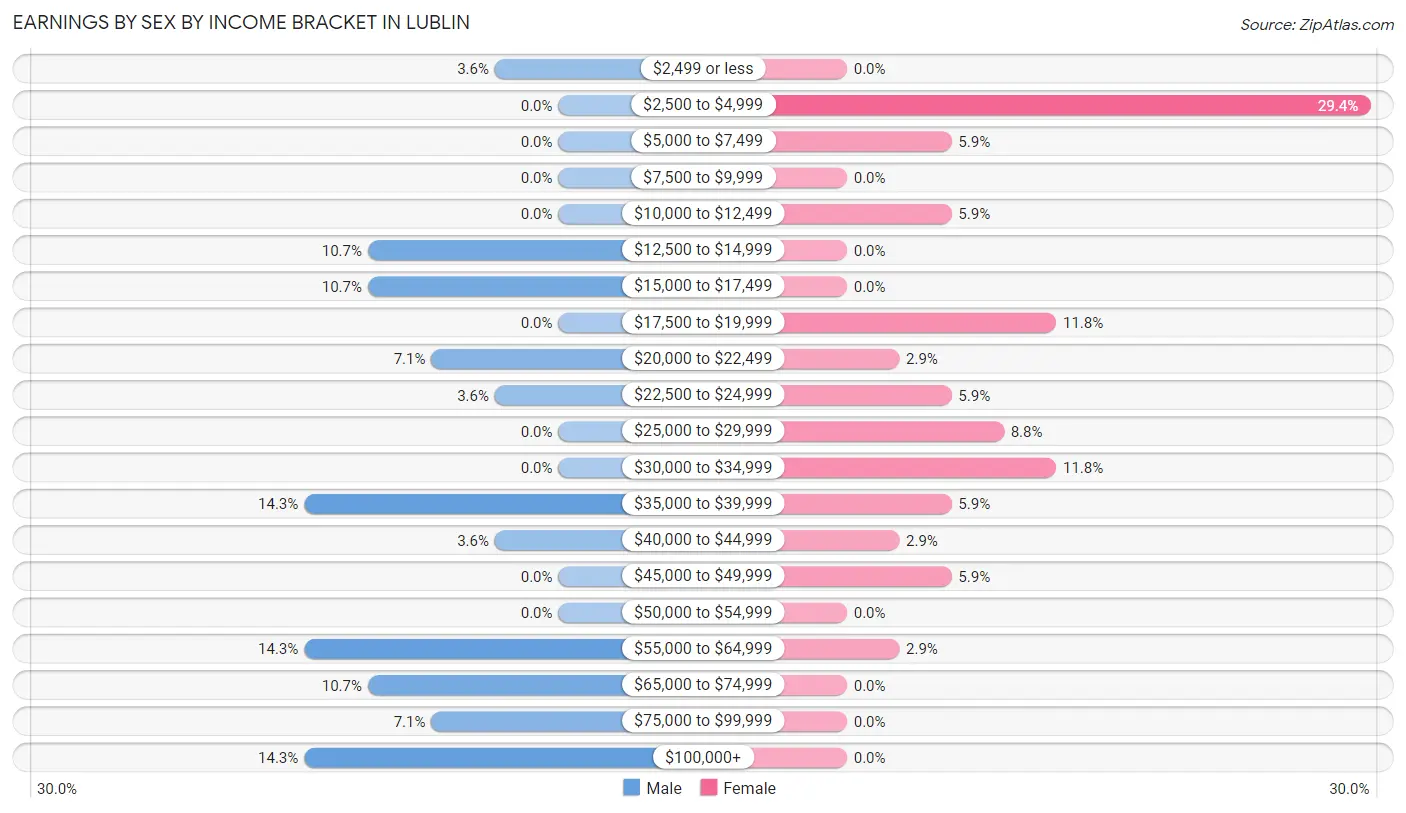
Earnings by Sex by Income Bracket in Lublin
The most common earnings brackets in Lublin are $35,000 to $39,999 for men (4 | 14.3%) and $2,500 to $4,999 for women (10 | 29.4%).
| Income | Male | Female |
| $2,499 or less | 1 (3.6%) | 0 (0.0%) |
| $2,500 to $4,999 | 0 (0.0%) | 10 (29.4%) |
| $5,000 to $7,499 | 0 (0.0%) | 2 (5.9%) |
| $7,500 to $9,999 | 0 (0.0%) | 0 (0.0%) |
| $10,000 to $12,499 | 0 (0.0%) | 2 (5.9%) |
| $12,500 to $14,999 | 3 (10.7%) | 0 (0.0%) |
| $15,000 to $17,499 | 3 (10.7%) | 0 (0.0%) |
| $17,500 to $19,999 | 0 (0.0%) | 4 (11.8%) |
| $20,000 to $22,499 | 2 (7.1%) | 1 (2.9%) |
| $22,500 to $24,999 | 1 (3.6%) | 2 (5.9%) |
| $25,000 to $29,999 | 0 (0.0%) | 3 (8.8%) |
| $30,000 to $34,999 | 0 (0.0%) | 4 (11.8%) |
| $35,000 to $39,999 | 4 (14.3%) | 2 (5.9%) |
| $40,000 to $44,999 | 1 (3.6%) | 1 (2.9%) |
| $45,000 to $49,999 | 0 (0.0%) | 2 (5.9%) |
| $50,000 to $54,999 | 0 (0.0%) | 0 (0.0%) |
| $55,000 to $64,999 | 4 (14.3%) | 1 (2.9%) |
| $65,000 to $74,999 | 3 (10.7%) | 0 (0.0%) |
| $75,000 to $99,999 | 2 (7.1%) | 0 (0.0%) |
| $100,000+ | 4 (14.3%) | 0 (0.0%) |
| Total | 28 (100.0%) | 34 (100.0%) |
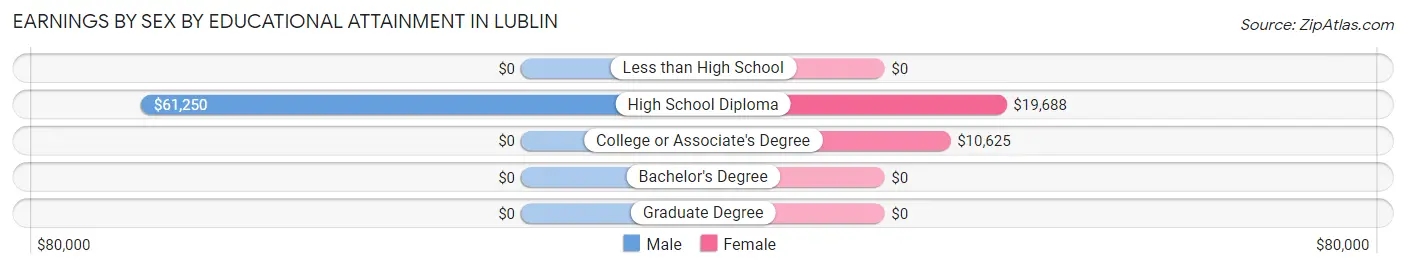
Earnings by Sex by Educational Attainment in Lublin
Average earnings in Lublin are $52,500 for men and $18,438 for women, a difference of 64.9%. Men with an educational attainment of high school diploma enjoy the highest average annual earnings of $61,250, while those with high school diploma education earn the least with $61,250. Women with an educational attainment of high school diploma earn the most with the average annual earnings of $19,688, while those with college or associate's degree education have the smallest earnings of $10,625.
| Educational Attainment | Male Income | Female Income |
| Less than High School | - | - |
| High School Diploma | $61,250 | $19,688 |
| College or Associate's Degree | - | - |
| Bachelor's Degree | - | - |
| Graduate Degree | - | - |
| Total | $52,500 | $18,438 |
Family Income in Lublin
Family Income Brackets in Lublin
According to the Lublin family income data, there are 8 families falling into the $100,000 to $149,999 income range, which is the most common income bracket and makes up 33.3% of all families.
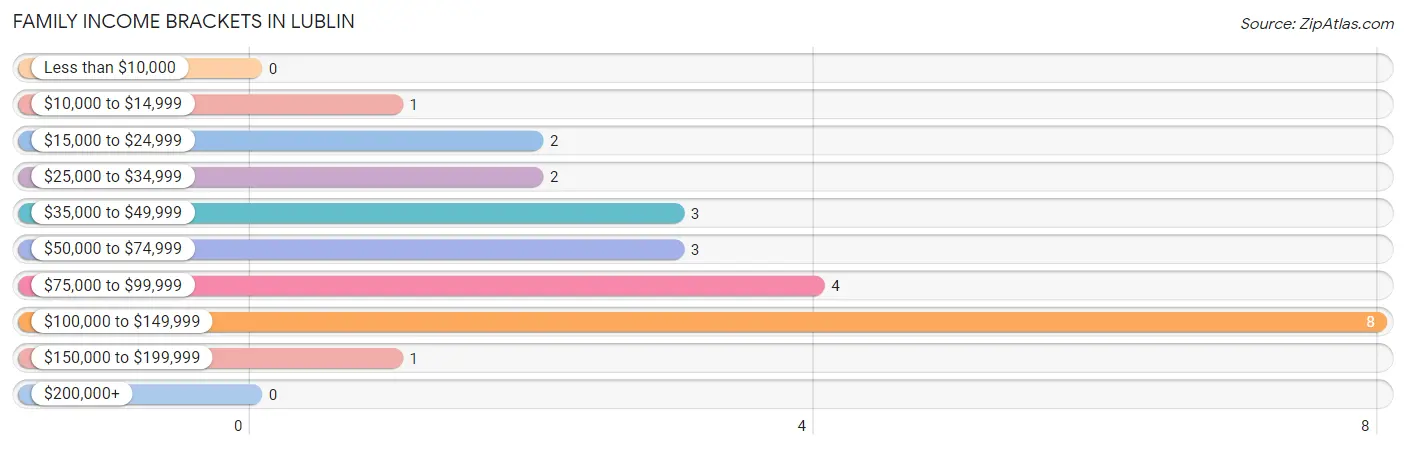
| Income Bracket | # Families | % Families |
| Less than $10,000 | 0 | 0.0% |
| $10,000 to $14,999 | 1 | 4.2% |
| $15,000 to $24,999 | 2 | 8.3% |
| $25,000 to $34,999 | 2 | 8.3% |
| $35,000 to $49,999 | 3 | 12.5% |
| $50,000 to $74,999 | 3 | 12.5% |
| $75,000 to $99,999 | 4 | 16.7% |
| $100,000 to $149,999 | 8 | 33.3% |
| $150,000 to $199,999 | 1 | 4.2% |
| $200,000+ | 0 | 0.0% |
Family Income by Famaliy Size in Lublin
2-person families (20 | 83.3%) account for the highest median family income in Lublin with $59,167 per family, while 2-person families (20 | 83.3%) have the highest median income of $29,584 per family member.
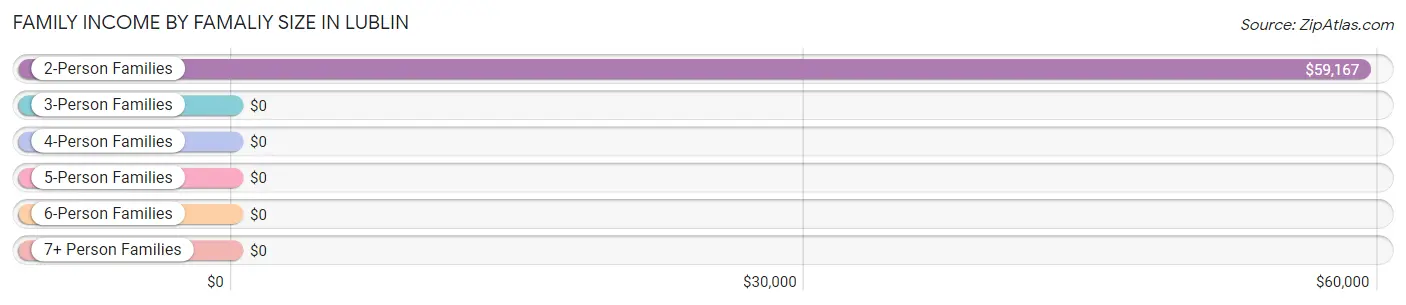
| Income Bracket | # Families | Median Income |
| 2-Person Families | 20 (83.3%) | $59,167 |
| 3-Person Families | 1 (4.2%) | $0 |
| 4-Person Families | 1 (4.2%) | $0 |
| 5-Person Families | 0 (0.0%) | $0 |
| 6-Person Families | 2 (8.3%) | $0 |
| 7+ Person Families | 0 (0.0%) | $0 |
| Total | 24 (100.0%) | $75,833 |
Family Income by Number of Earners in Lublin
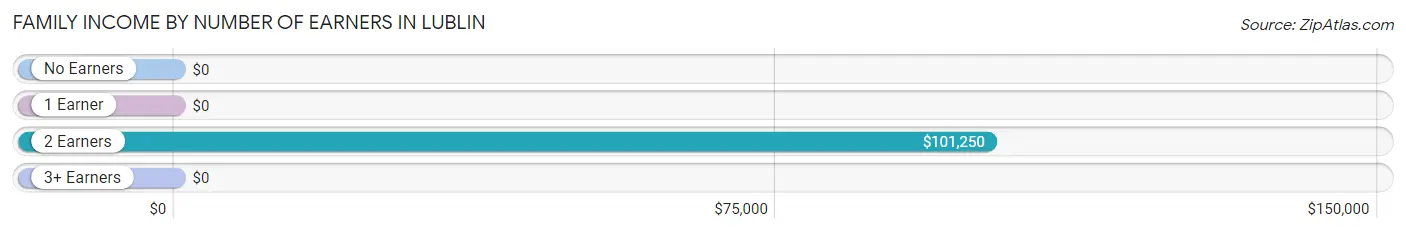
| Number of Earners | # Families | Median Income |
| No Earners | 4 (16.7%) | $0 |
| 1 Earner | 9 (37.5%) | $0 |
| 2 Earners | 10 (41.7%) | $101,250 |
| 3+ Earners | 1 (4.2%) | $0 |
| Total | 24 (100.0%) | $75,833 |
Household Income in Lublin
Household Income Brackets in Lublin
With 10 households falling in the category, the $35,000 to $49,999 income range is the most frequent in Lublin, accounting for 16.1% of all households. In contrast, only 1 households (1.6%) fall into the $150,000 to $199,999 income bracket, making it the least populous group.
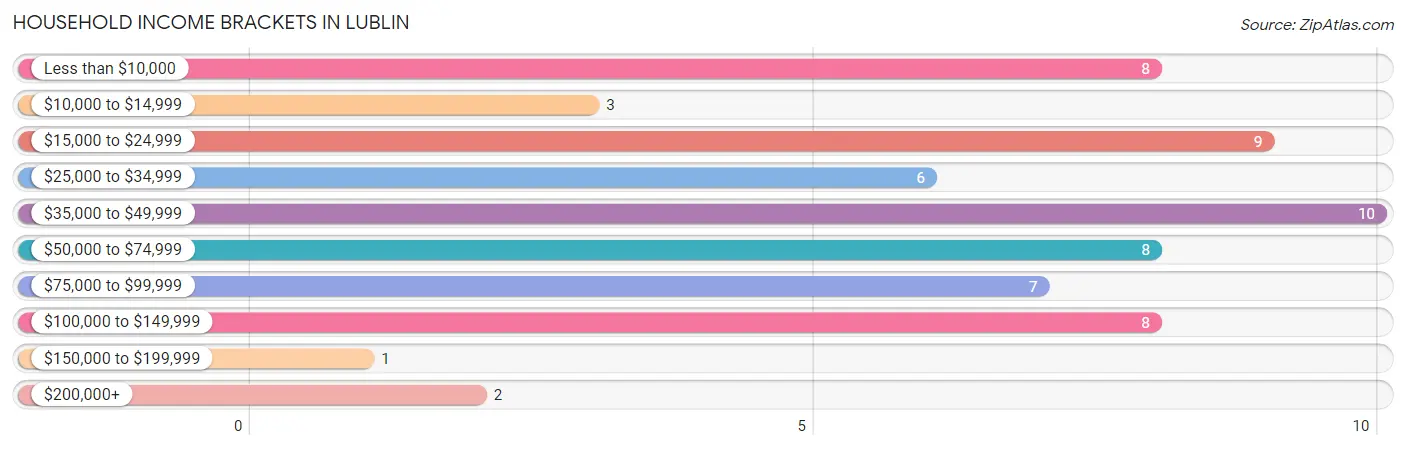
| Income Bracket | # Households | % Households |
| Less than $10,000 | 8 | 12.9% |
| $10,000 to $14,999 | 3 | 4.8% |
| $15,000 to $24,999 | 9 | 14.5% |
| $25,000 to $34,999 | 6 | 9.7% |
| $35,000 to $49,999 | 10 | 16.1% |
| $50,000 to $74,999 | 8 | 12.9% |
| $75,000 to $99,999 | 7 | 11.3% |
| $100,000 to $149,999 | 8 | 12.9% |
| $150,000 to $199,999 | 1 | 1.6% |
| $200,000+ | 2 | 3.2% |
Household Income by Householder Age in Lublin
The median household income in Lublin is $40,000, with the highest median household income of $61,250 found in the 25 to 44 years age bracket for the primary householder. A total of 14 households (22.6%) fall into this category. Meanwhile, the 15 to 24 years age bracket for the primary householder has the lowest median household income of $0, with 1 households (1.6%) in this group.
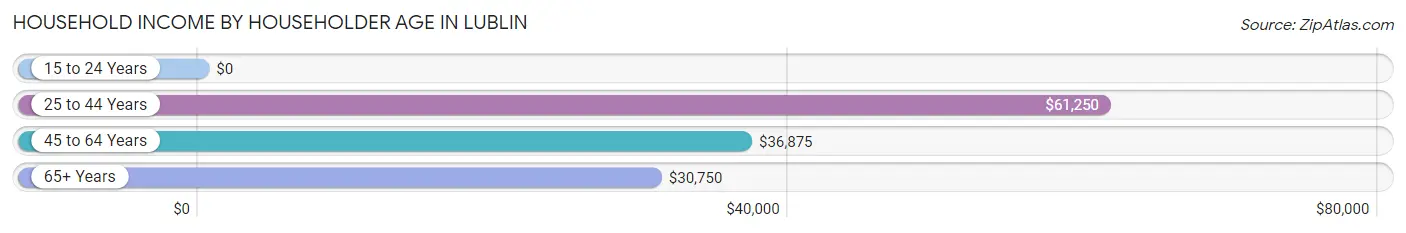
| Income Bracket | # Households | Median Income |
| 15 to 24 Years | 1 (1.6%) | $0 |
| 25 to 44 Years | 14 (22.6%) | $61,250 |
| 45 to 64 Years | 24 (38.7%) | $36,875 |
| 65+ Years | 23 (37.1%) | $30,750 |
| Total | 62 (100.0%) | $40,000 |
Poverty in Lublin
Income Below Poverty by Sex and Age in Lublin
With 18.9% poverty level for males and 11.5% for females among the residents of Lublin, 12 to 14 year old males and 45 to 54 year old females are the most vulnerable to poverty, with 2 males (100.0%) and 4 females (80.0%) in their respective age groups living below the poverty level.
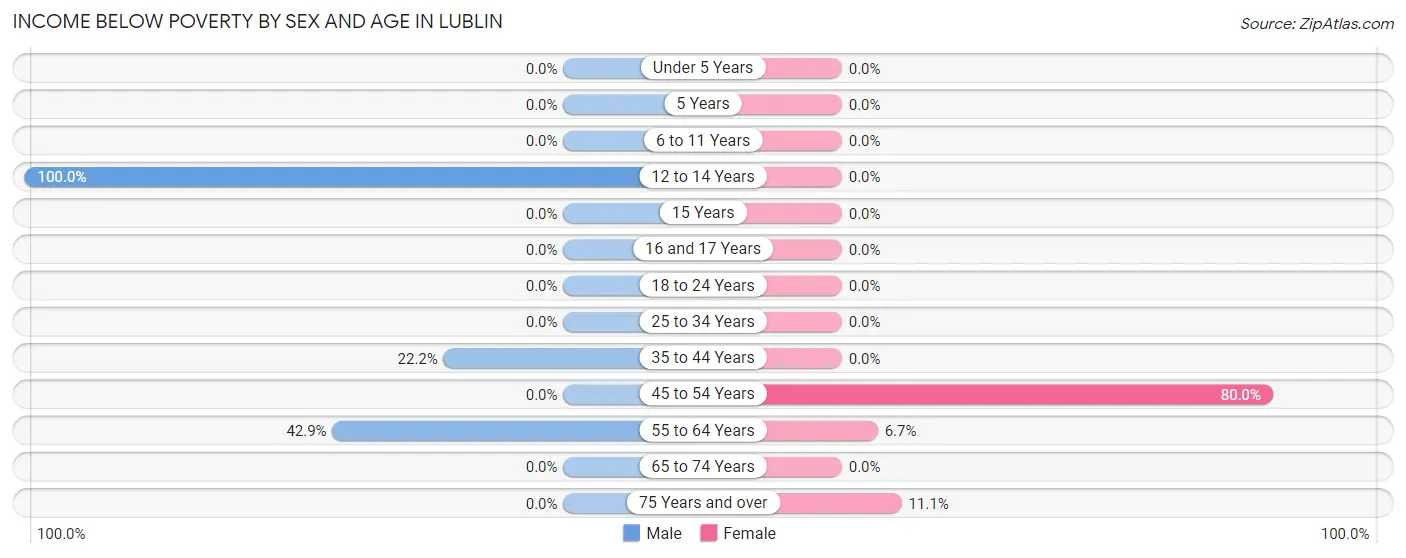
| Age Bracket | Male | Female |
| Under 5 Years | 0 (0.0%) | 0 (0.0%) |
| 5 Years | 0 (0.0%) | 0 (0.0%) |
| 6 to 11 Years | 0 (0.0%) | 0 (0.0%) |
| 12 to 14 Years | 2 (100.0%) | 0 (0.0%) |
| 15 Years | 0 (0.0%) | 0 (0.0%) |
| 16 and 17 Years | 0 (0.0%) | 0 (0.0%) |
| 18 to 24 Years | 0 (0.0%) | 0 (0.0%) |
| 25 to 34 Years | 0 (0.0%) | 0 (0.0%) |
| 35 to 44 Years | 2 (22.2%) | 0 (0.0%) |
| 45 to 54 Years | 0 (0.0%) | 4 (80.0%) |
| 55 to 64 Years | 6 (42.9%) | 1 (6.7%) |
| 65 to 74 Years | 0 (0.0%) | 0 (0.0%) |
| 75 Years and over | 0 (0.0%) | 1 (11.1%) |
| Total | 10 (18.9%) | 6 (11.5%) |
Income Above Poverty by Sex and Age in Lublin
According to the poverty statistics in Lublin, males aged under 5 years and females aged under 5 years are the age groups that are most secure financially, with 100.0% of males and 100.0% of females in these age groups living above the poverty line.
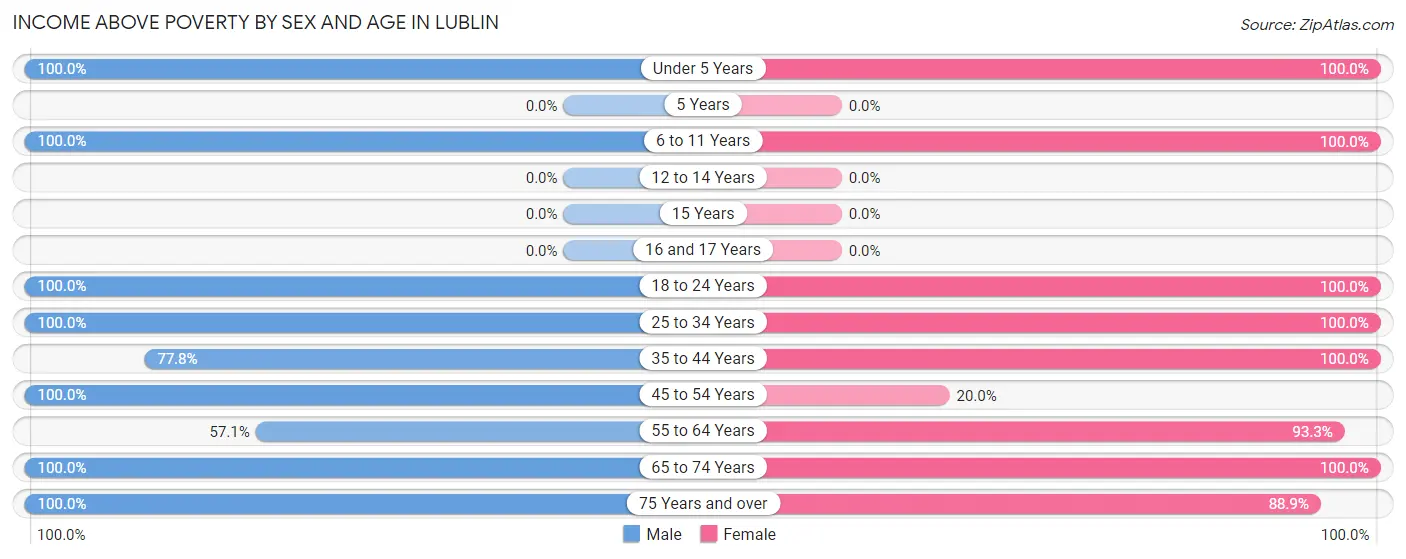
| Age Bracket | Male | Female |
| Under 5 Years | 1 (100.0%) | 1 (100.0%) |
| 5 Years | 0 (0.0%) | 0 (0.0%) |
| 6 to 11 Years | 3 (100.0%) | 1 (100.0%) |
| 12 to 14 Years | 0 (0.0%) | 0 (0.0%) |
| 15 Years | 0 (0.0%) | 0 (0.0%) |
| 16 and 17 Years | 0 (0.0%) | 0 (0.0%) |
| 18 to 24 Years | 4 (100.0%) | 3 (100.0%) |
| 25 to 34 Years | 3 (100.0%) | 4 (100.0%) |
| 35 to 44 Years | 7 (77.8%) | 4 (100.0%) |
| 45 to 54 Years | 4 (100.0%) | 1 (20.0%) |
| 55 to 64 Years | 8 (57.1%) | 14 (93.3%) |
| 65 to 74 Years | 8 (100.0%) | 10 (100.0%) |
| 75 Years and over | 5 (100.0%) | 8 (88.9%) |
| Total | 43 (81.1%) | 46 (88.5%) |
Income Below Poverty Among Married-Couple Families in Lublin
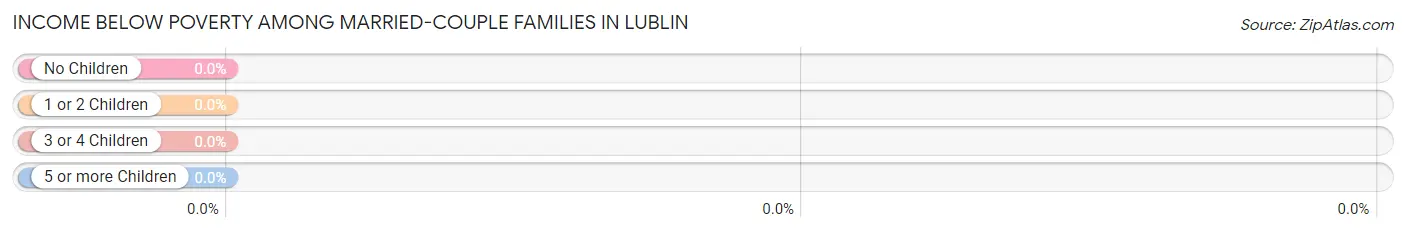
| Children | Above Poverty | Below Poverty |
| No Children | 18 (100.0%) | 0 (0.0%) |
| 1 or 2 Children | 1 (100.0%) | 0 (0.0%) |
| 3 or 4 Children | 2 (100.0%) | 0 (0.0%) |
| 5 or more Children | 0 (0.0%) | 0 (0.0%) |
| Total | 21 (100.0%) | 0 (0.0%) |
Income Below Poverty Among Single-Parent Households in Lublin
According to the poverty data in Lublin, 100.0% or 2 single-father households and 100.0% or 1 single-mother households are living below the poverty line. Among single-father households, those with 1 or 2 children have the highest poverty rate, with 2 households (100.0%) experiencing poverty. Likewise, among single-mother households, those with no children have the highest poverty rate, with 1 households (100.0%) falling below the poverty line.
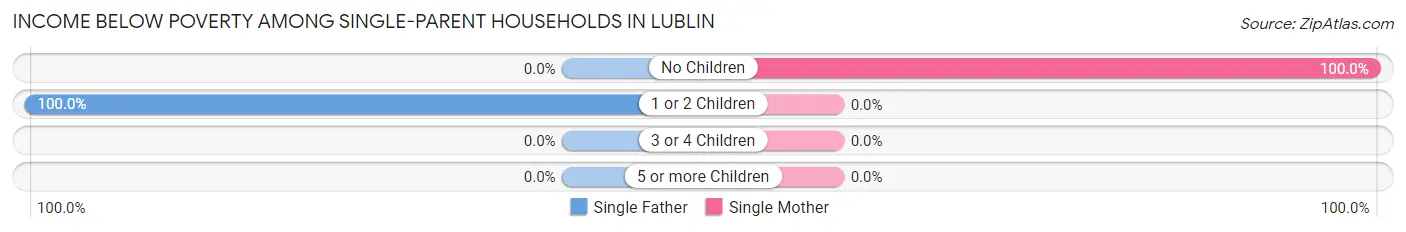
| Children | Single Father | Single Mother |
| No Children | 0 (0.0%) | 1 (100.0%) |
| 1 or 2 Children | 2 (100.0%) | 0 (0.0%) |
| 3 or 4 Children | 0 (0.0%) | 0 (0.0%) |
| 5 or more Children | 0 (0.0%) | 0 (0.0%) |
| Total | 2 (100.0%) | 1 (100.0%) |
Income Below Poverty Among Married-Couple vs Single-Parent Households in Lublin
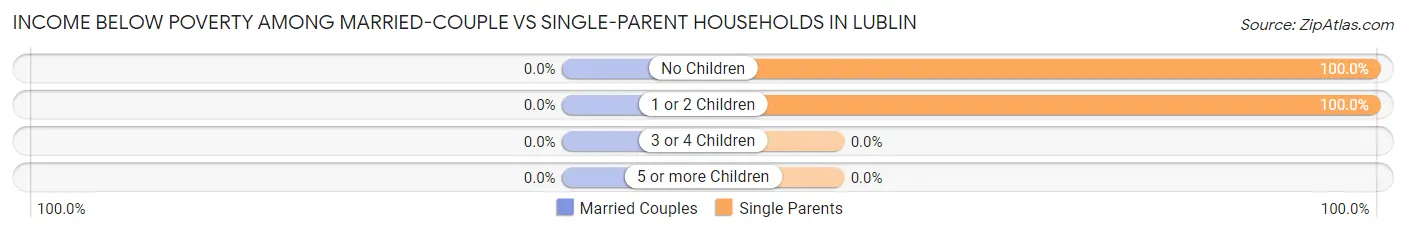
| Children | Married-Couple Families | Single-Parent Households |
| No Children | 0 (0.0%) | 1 (100.0%) |
| 1 or 2 Children | 0 (0.0%) | 2 (100.0%) |
| 3 or 4 Children | 0 (0.0%) | 0 (0.0%) |
| 5 or more Children | 0 (0.0%) | 0 (0.0%) |
| Total | 0 (0.0%) | 3 (100.0%) |
Race in Lublin
The most populous races in Lublin are White / Caucasian (102 | 97.1%), and Black / African American (3 | 2.9%).
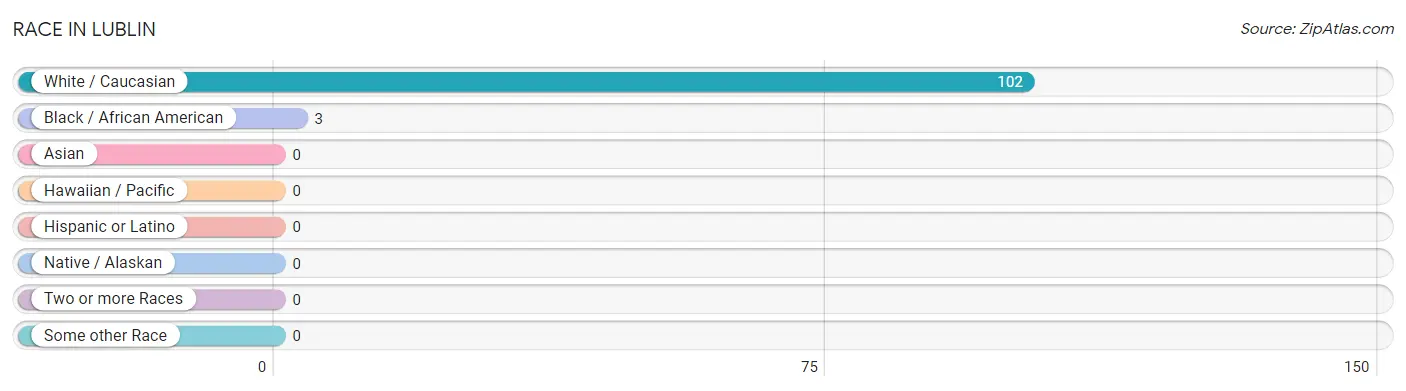
| Race | # Population | % Population |
| Asian | 0 | 0.0% |
| Black / African American | 3 | 2.9% |
| Hawaiian / Pacific | 0 | 0.0% |
| Hispanic or Latino | 0 | 0.0% |
| Native / Alaskan | 0 | 0.0% |
| White / Caucasian | 102 | 97.1% |
| Two or more Races | 0 | 0.0% |
| Some other Race | 0 | 0.0% |
| Total | 105 | 100.0% |
Ancestry in Lublin
The most populous ancestries reported in Lublin are German (35 | 33.3%), Polish (26 | 24.8%), Irish (15 | 14.3%), English (8 | 7.6%), and Ukrainian (6 | 5.7%), together accounting for 85.7% of all Lublin residents.
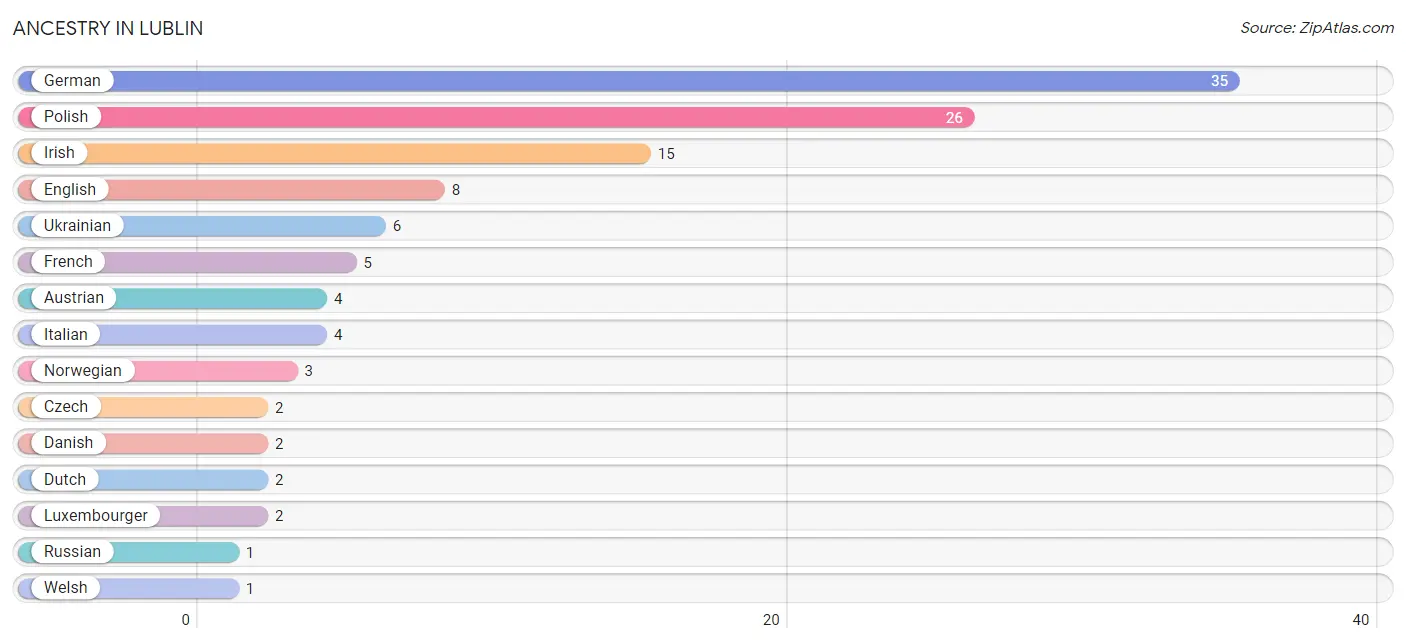
| Ancestry | # Population | % Population |
| Austrian | 4 | 3.8% |
| Czech | 2 | 1.9% |
| Danish | 2 | 1.9% |
| Dutch | 2 | 1.9% |
| English | 8 | 7.6% |
| French | 5 | 4.8% |
| German | 35 | 33.3% |
| Irish | 15 | 14.3% |
| Italian | 4 | 3.8% |
| Luxembourger | 2 | 1.9% |
| Norwegian | 3 | 2.9% |
| Polish | 26 | 24.8% |
| Russian | 1 | 0.9% |
| Ukrainian | 6 | 5.7% |
| Welsh | 1 | 0.9% | View All 15 Rows |
Immigrants in Lublin
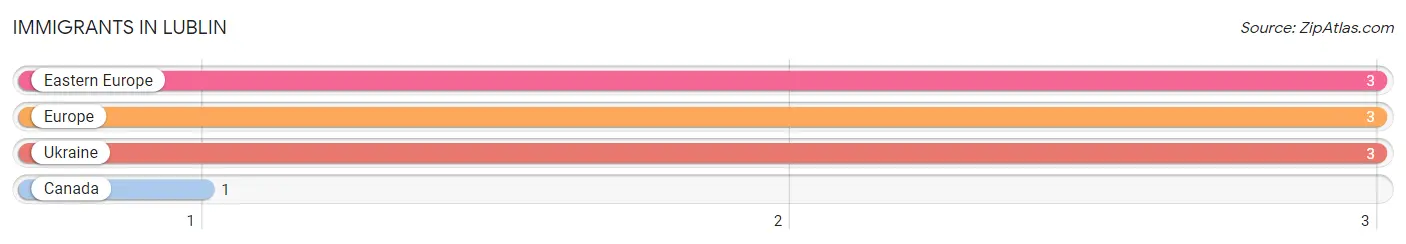
The most numerous immigrant groups reported in Lublin came from Eastern Europe (3 | 2.9%), Europe (3 | 2.9%), Ukraine (3 | 2.9%), and Canada (1 | 0.9%), together accounting for 9.5% of all Lublin residents.
| Immigration Origin | # Population | % Population |
| Canada | 1 | 0.9% |
| Eastern Europe | 3 | 2.9% |
| Europe | 3 | 2.9% |
| Ukraine | 3 | 2.9% | View All 4 Rows |
Sex and Age in Lublin
Sex and Age in Lublin
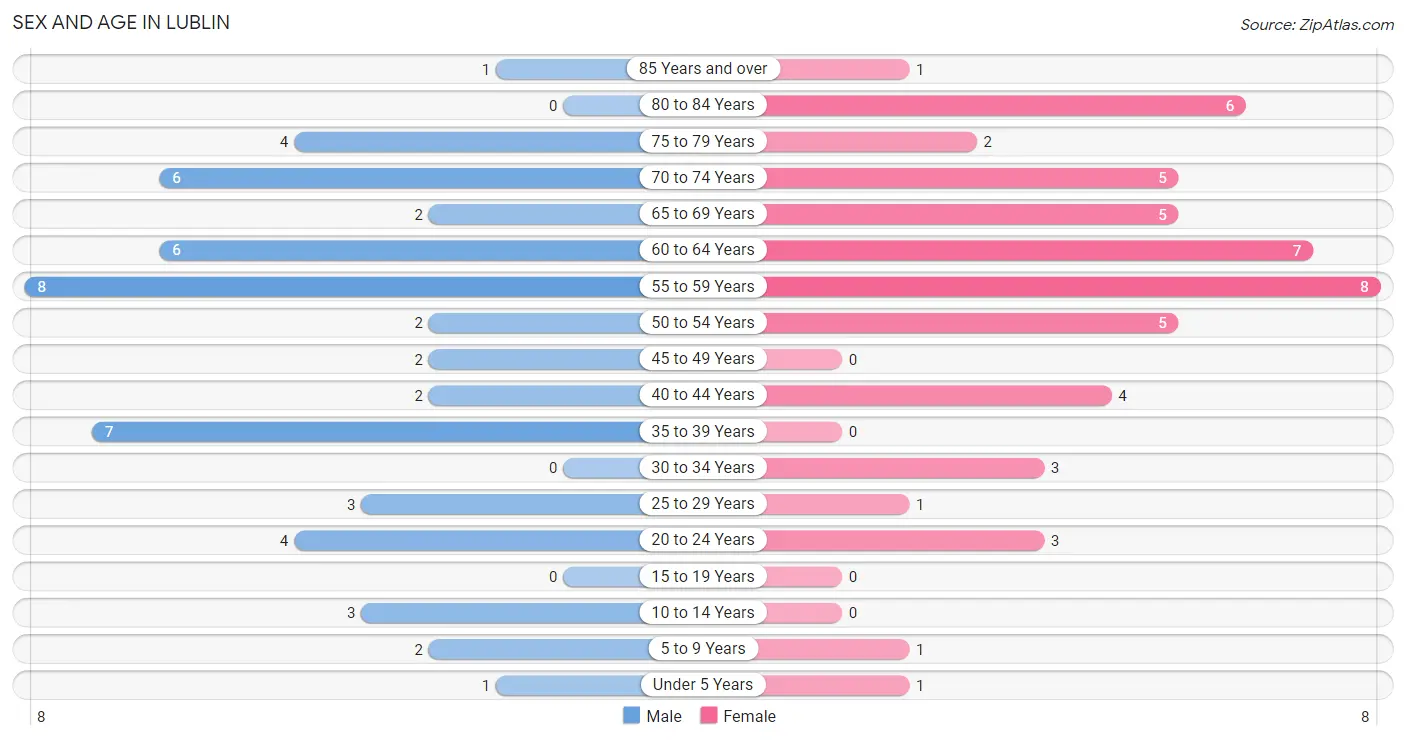
The most populous age groups in Lublin are 55 to 59 Years (8 | 15.1%) for men and 55 to 59 Years (8 | 15.4%) for women.
| Age Bracket | Male | Female |
| Under 5 Years | 1 (1.9%) | 1 (1.9%) |
| 5 to 9 Years | 2 (3.8%) | 1 (1.9%) |
| 10 to 14 Years | 3 (5.7%) | 0 (0.0%) |
| 15 to 19 Years | 0 (0.0%) | 0 (0.0%) |
| 20 to 24 Years | 4 (7.5%) | 3 (5.8%) |
| 25 to 29 Years | 3 (5.7%) | 1 (1.9%) |
| 30 to 34 Years | 0 (0.0%) | 3 (5.8%) |
| 35 to 39 Years | 7 (13.2%) | 0 (0.0%) |
| 40 to 44 Years | 2 (3.8%) | 4 (7.7%) |
| 45 to 49 Years | 2 (3.8%) | 0 (0.0%) |
| 50 to 54 Years | 2 (3.8%) | 5 (9.6%) |
| 55 to 59 Years | 8 (15.1%) | 8 (15.4%) |
| 60 to 64 Years | 6 (11.3%) | 7 (13.5%) |
| 65 to 69 Years | 2 (3.8%) | 5 (9.6%) |
| 70 to 74 Years | 6 (11.3%) | 5 (9.6%) |
| 75 to 79 Years | 4 (7.5%) | 2 (3.8%) |
| 80 to 84 Years | 0 (0.0%) | 6 (11.5%) |
| 85 Years and over | 1 (1.9%) | 1 (1.9%) |
| Total | 53 (100.0%) | 52 (100.0%) |
Families and Households in Lublin
Median Family Size in Lublin
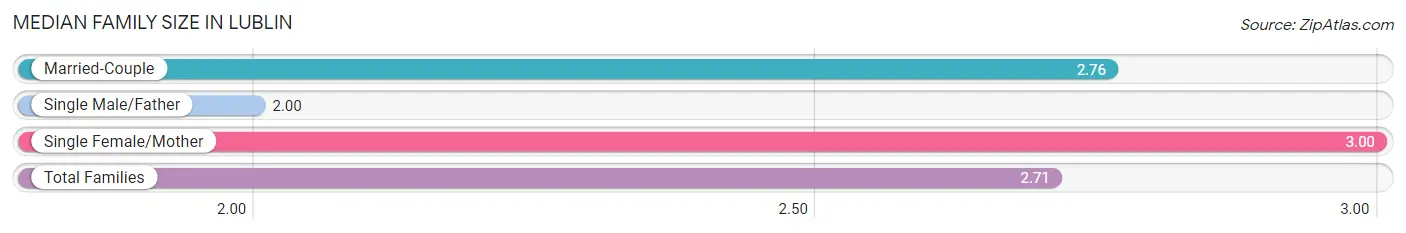
The median family size in Lublin is 2.71 persons per family, with single female/mother families (1 | 4.2%) accounting for the largest median family size of 3 persons per family. On the other hand, single male/father families (2 | 8.3%) represent the smallest median family size with 2.00 persons per family.
| Family Type | # Families | Family Size |
| Married-Couple | 21 (87.5%) | 2.76 |
| Single Male/Father | 2 (8.3%) | 2.00 |
| Single Female/Mother | 1 (4.2%) | 3.00 |
| Total Families | 24 (100.0%) | 2.71 |
Median Household Size in Lublin
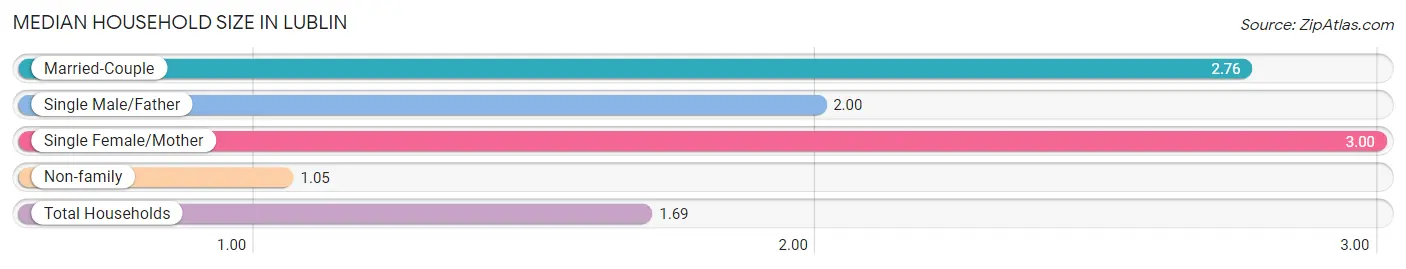
The median household size in Lublin is 1.69 persons per household, with single female/mother households (1 | 1.6%) accounting for the largest median household size of 3 persons per household. non-family households (38 | 61.3%) represent the smallest median household size with 1.05 persons per household.
| Household Type | # Households | Household Size |
| Married-Couple | 21 (33.9%) | 2.76 |
| Single Male/Father | 2 (3.2%) | 2.00 |
| Single Female/Mother | 1 (1.6%) | 3.00 |
| Non-family | 38 (61.3%) | 1.05 |
| Total Households | 62 (100.0%) | 1.69 |
Household Size by Marriage Status in Lublin
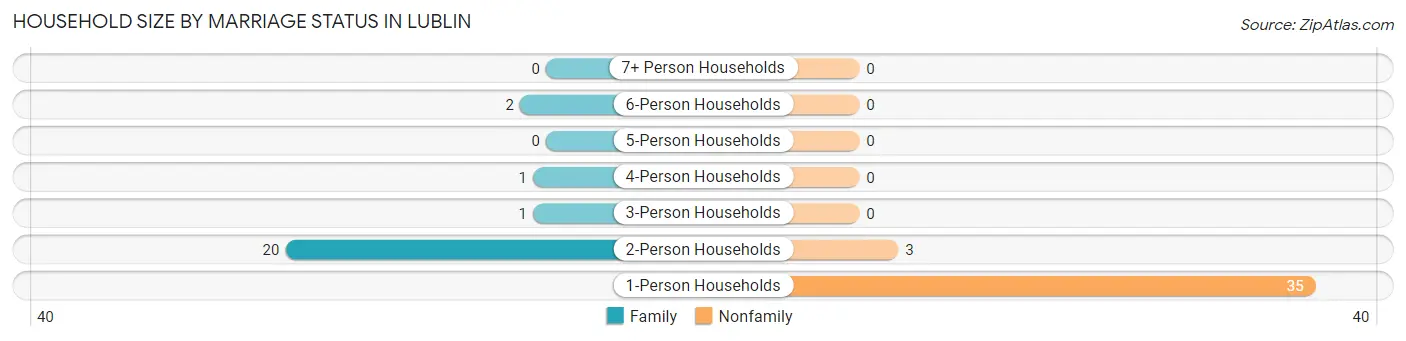
Out of a total of 62 households in Lublin, 24 (38.7%) are family households, while 38 (61.3%) are nonfamily households. The most numerous type of family households are 2-person households, comprising 20, and the most common type of nonfamily households are 1-person households, comprising 35.
| Household Size | Family Households | Nonfamily Households |
| 1-Person Households | - | 35 (56.5%) |
| 2-Person Households | 20 (32.3%) | 3 (4.8%) |
| 3-Person Households | 1 (1.6%) | 0 (0.0%) |
| 4-Person Households | 1 (1.6%) | 0 (0.0%) |
| 5-Person Households | 0 (0.0%) | 0 (0.0%) |
| 6-Person Households | 2 (3.2%) | 0 (0.0%) |
| 7+ Person Households | 0 (0.0%) | 0 (0.0%) |
| Total | 24 (38.7%) | 38 (61.3%) |
Female Fertility in Lublin
Fertility by Age in Lublin
| Age Bracket | Women with Births | Births / 1,000 Women |
| 15 to 19 years | 0 (0.0%) | 0.0 |
| 20 to 34 years | 0 (0.0%) | 0.0 |
| 35 to 50 years | 0 (0.0%) | 0.0 |
| Total | 0 (0.0%) | 0.0 |
Fertility by Age by Marriage Status in Lublin
| Age Bracket | Married | Unmarried |
| 15 to 19 years | 0 (0.0%) | 0 (0.0%) |
| 20 to 34 years | 0 (0.0%) | 0 (0.0%) |
| 35 to 50 years | 0 (0.0%) | 0 (0.0%) |
| Total | 0 (0.0%) | 0 (0.0%) |
Fertility by Education in Lublin
| Educational Attainment | Women with Births | Births / 1,000 Women |
| Less than High School | 0 (0.0%) | 0.0 |
| High School Diploma | 0 (0.0%) | 0.0 |
| College or Associate's Degree | 0 (0.0%) | 0.0 |
| Bachelor's Degree | 0 (0.0%) | 0.0 |
| Graduate Degree | 0 (0.0%) | 0.0 |
| Total | 0 (0.0%) | 0.0 |
Fertility by Education by Marriage Status in Lublin
| Educational Attainment | Married | Unmarried |
| Less than High School | 0 (0.0%) | 0 (0.0%) |
| High School Diploma | 0 (0.0%) | 0 (0.0%) |
| College or Associate's Degree | 0 (0.0%) | 0 (0.0%) |
| Bachelor's Degree | 0 (0.0%) | 0 (0.0%) |
| Graduate Degree | 0 (0.0%) | 0 (0.0%) |
| Total | 0 (0.0%) | 0 (0.0%) |
Employment Characteristics in Lublin
Employment by Class of Employer in Lublin
Among the 55 employed individuals in Lublin, private company employees (29 | 52.7%), local government employees (14 | 25.5%), and not-for-profit organizations (5 | 9.1%) make up the most common classes of employment.
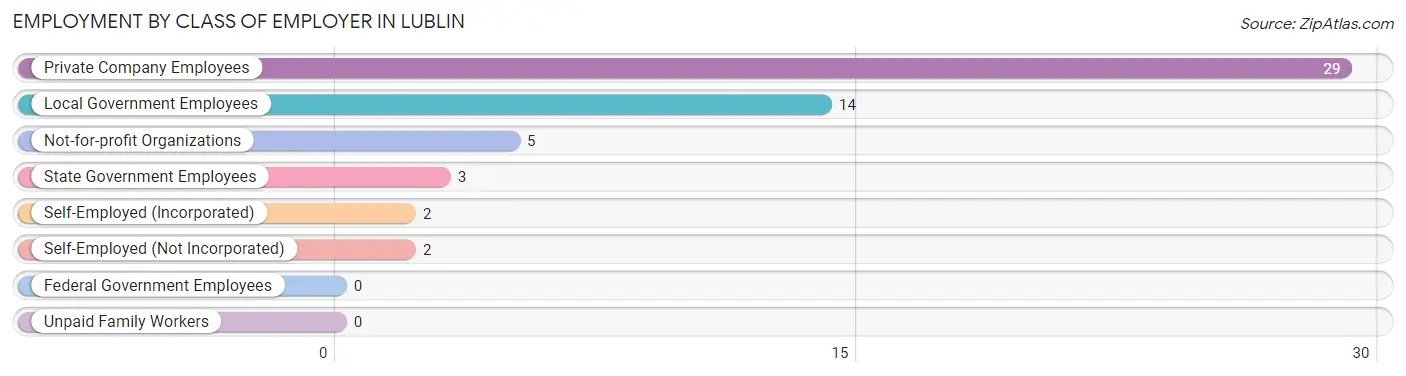
| Employer Class | # Employees | % Employees |
| Private Company Employees | 29 | 52.7% |
| Self-Employed (Incorporated) | 2 | 3.6% |
| Self-Employed (Not Incorporated) | 2 | 3.6% |
| Not-for-profit Organizations | 5 | 9.1% |
| Local Government Employees | 14 | 25.5% |
| State Government Employees | 3 | 5.4% |
| Federal Government Employees | 0 | 0.0% |
| Unpaid Family Workers | 0 | 0.0% |
| Total | 55 | 100.0% |
Employment Status by Age in Lublin
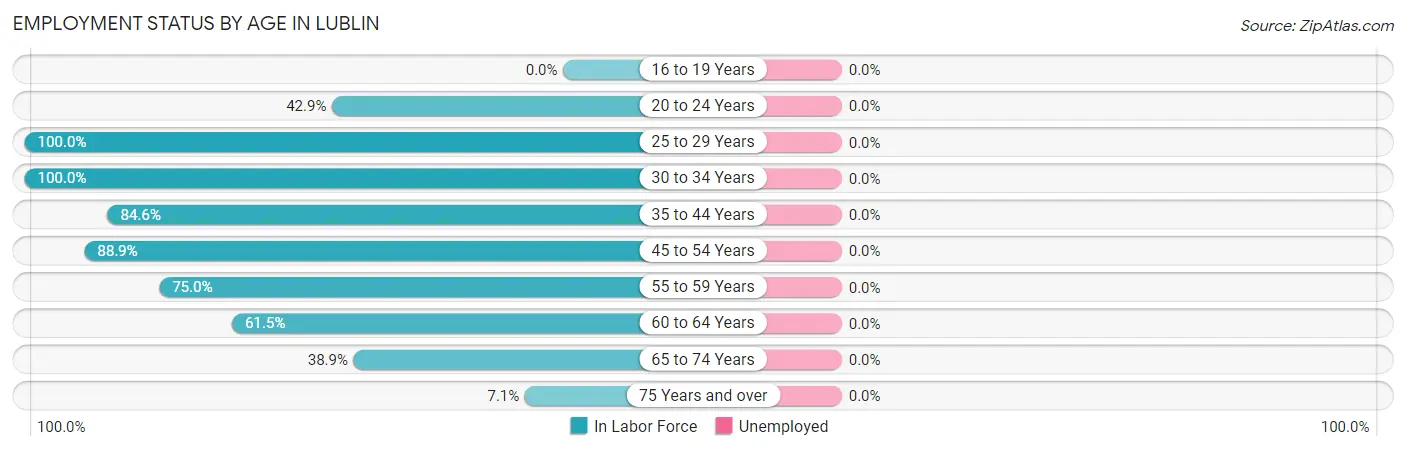
| Age Bracket | In Labor Force | Unemployed |
| 16 to 19 Years | 0 (0.0%) | 0 (0.0%) |
| 20 to 24 Years | 3 (42.9%) | 0 (0.0%) |
| 25 to 29 Years | 4 (100.0%) | 0 (0.0%) |
| 30 to 34 Years | 3 (100.0%) | 0 (0.0%) |
| 35 to 44 Years | 11 (84.6%) | 0 (0.0%) |
| 45 to 54 Years | 8 (88.9%) | 0 (0.0%) |
| 55 to 59 Years | 12 (75.0%) | 0 (0.0%) |
| 60 to 64 Years | 8 (61.5%) | 0 (0.0%) |
| 65 to 74 Years | 7 (38.9%) | 0 (0.0%) |
| 75 Years and over | 1 (7.1%) | 0 (0.0%) |
| Total | 57 (58.8%) | 0 (0.0%) |
Employment Status by Educational Attainment in Lublin
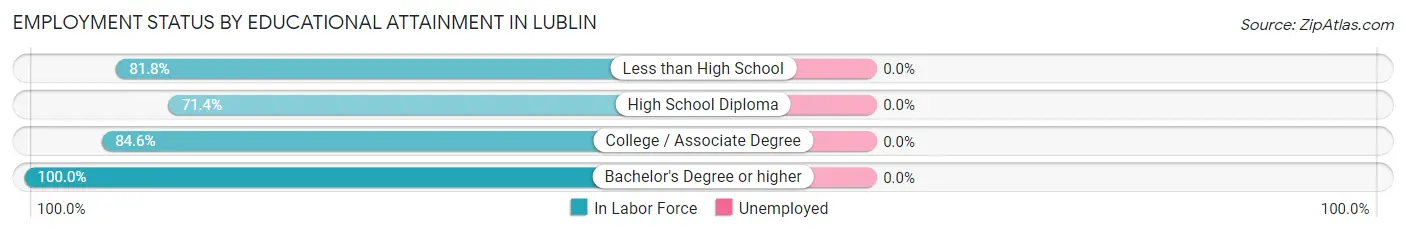
| Educational Attainment | In Labor Force | Unemployed |
| Less than High School | 9 (81.8%) | 0 (0.0%) |
| High School Diploma | 20 (71.4%) | 0 (0.0%) |
| College / Associate Degree | 11 (84.6%) | 0 (0.0%) |
| Bachelor's Degree or higher | 6 (100.0%) | 0 (0.0%) |
| Total | 46 (79.3%) | 0 (0.0%) |
Employment Occupations by Sex in Lublin
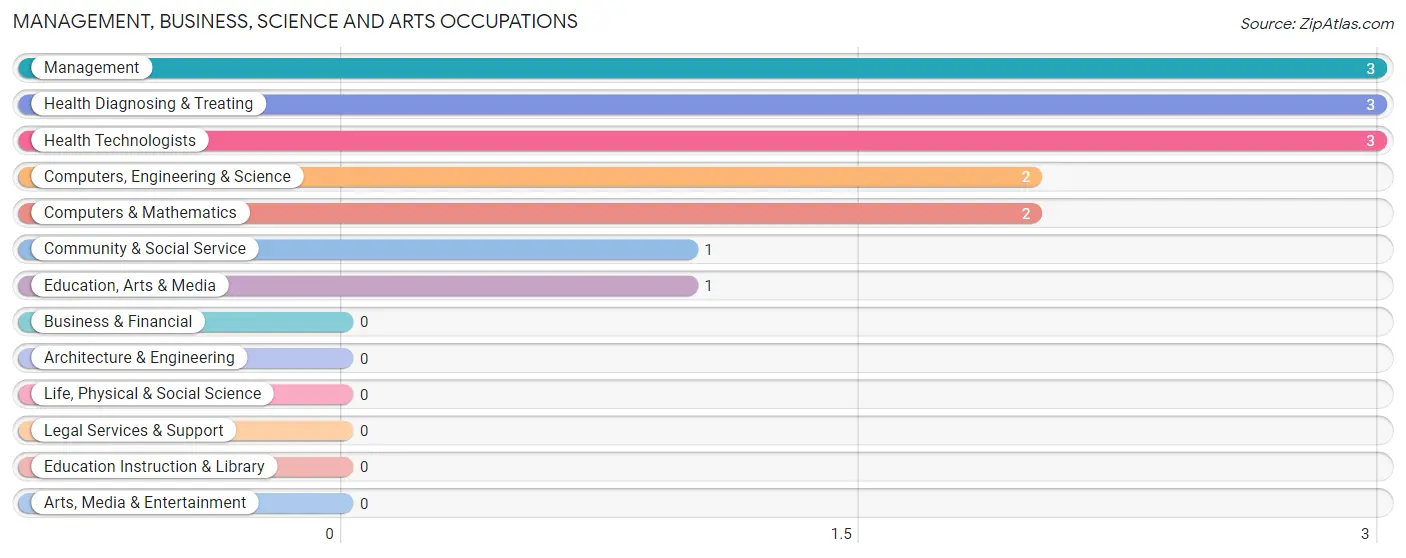
Management, Business, Science and Arts Occupations
The most common Management, Business, Science and Arts occupations in Lublin are Management (3 | 5.3%), Health Diagnosing & Treating (3 | 5.3%), Health Technologists (3 | 5.3%), Computers, Engineering & Science (2 | 3.5%), and Computers & Mathematics (2 | 3.5%).
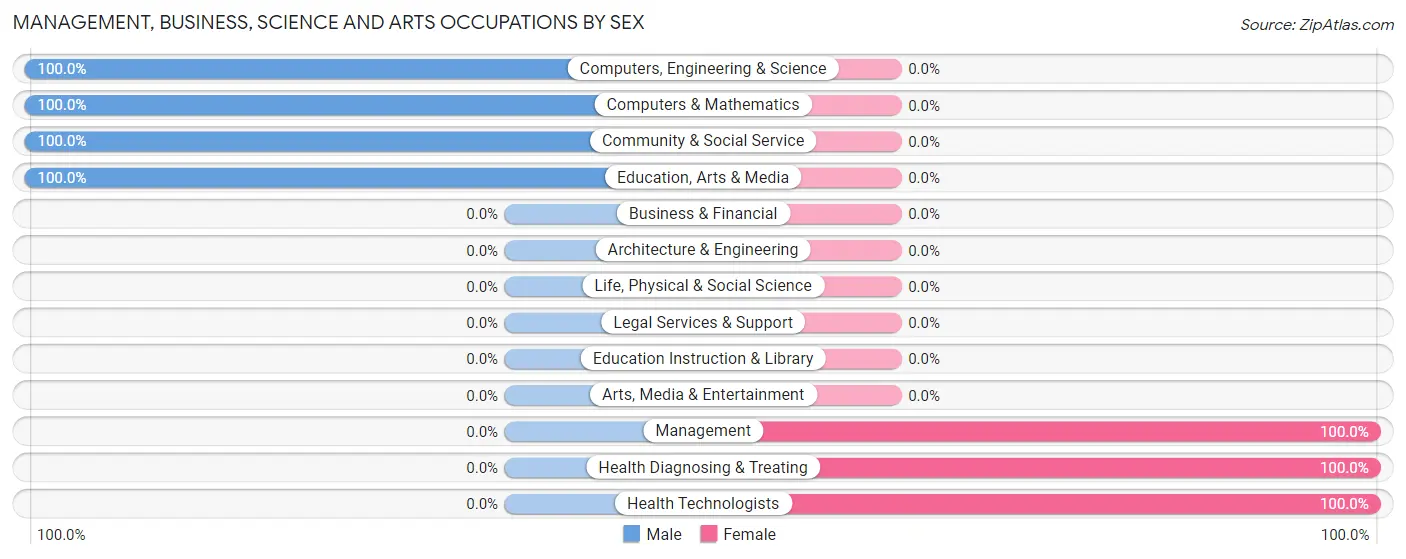
Management, Business, Science and Arts Occupations by Sex
Within the Management, Business, Science and Arts occupations in Lublin, the most male-oriented occupations are Computers, Engineering & Science (100.0%), Computers & Mathematics (100.0%), and Community & Social Service (100.0%), while the most female-oriented occupations are Management (100.0%), Health Diagnosing & Treating (100.0%), and Health Technologists (100.0%).
| Occupation | Male | Female |
| Management | 0 (0.0%) | 3 (100.0%) |
| Business & Financial | 0 (0.0%) | 0 (0.0%) |
| Computers, Engineering & Science | 2 (100.0%) | 0 (0.0%) |
| Computers & Mathematics | 2 (100.0%) | 0 (0.0%) |
| Architecture & Engineering | 0 (0.0%) | 0 (0.0%) |
| Life, Physical & Social Science | 0 (0.0%) | 0 (0.0%) |
| Community & Social Service | 1 (100.0%) | 0 (0.0%) |
| Education, Arts & Media | 1 (100.0%) | 0 (0.0%) |
| Legal Services & Support | 0 (0.0%) | 0 (0.0%) |
| Education Instruction & Library | 0 (0.0%) | 0 (0.0%) |
| Arts, Media & Entertainment | 0 (0.0%) | 0 (0.0%) |
| Health Diagnosing & Treating | 0 (0.0%) | 3 (100.0%) |
| Health Technologists | 0 (0.0%) | 3 (100.0%) |
| Total (Category) | 3 (33.3%) | 6 (66.7%) |
| Total (Overall) | 26 (45.6%) | 31 (54.4%) |
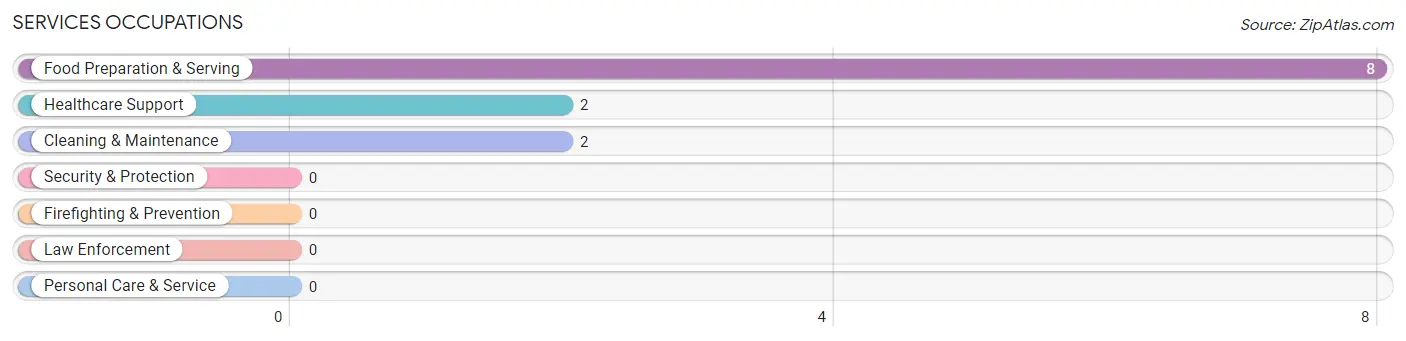
Services Occupations
The most common Services occupations in Lublin are Food Preparation & Serving (8 | 14.0%), Healthcare Support (2 | 3.5%), and Cleaning & Maintenance (2 | 3.5%).
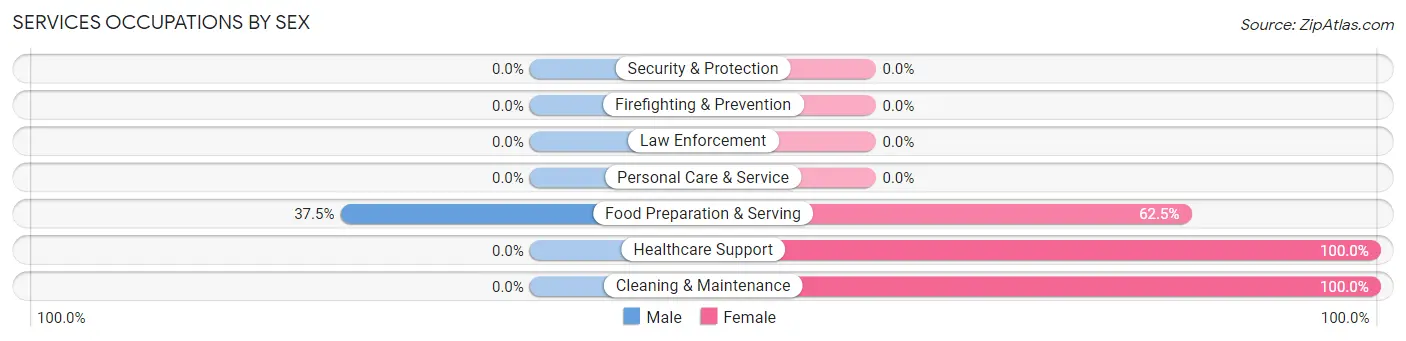
Services Occupations by Sex
| Occupation | Male | Female |
| Healthcare Support | 0 (0.0%) | 2 (100.0%) |
| Security & Protection | 0 (0.0%) | 0 (0.0%) |
| Firefighting & Prevention | 0 (0.0%) | 0 (0.0%) |
| Law Enforcement | 0 (0.0%) | 0 (0.0%) |
| Food Preparation & Serving | 3 (37.5%) | 5 (62.5%) |
| Cleaning & Maintenance | 0 (0.0%) | 2 (100.0%) |
| Personal Care & Service | 0 (0.0%) | 0 (0.0%) |
| Total (Category) | 3 (25.0%) | 9 (75.0%) |
| Total (Overall) | 26 (45.6%) | 31 (54.4%) |
Sales and Office Occupations
The most common Sales and Office occupations in Lublin are Office & Administration (14 | 24.6%), and Sales & Related (2 | 3.5%).
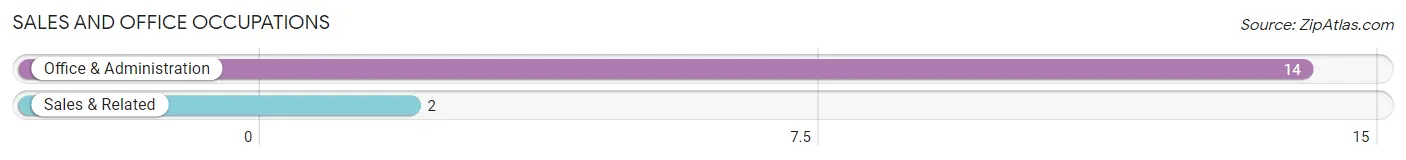
Sales and Office Occupations by Sex
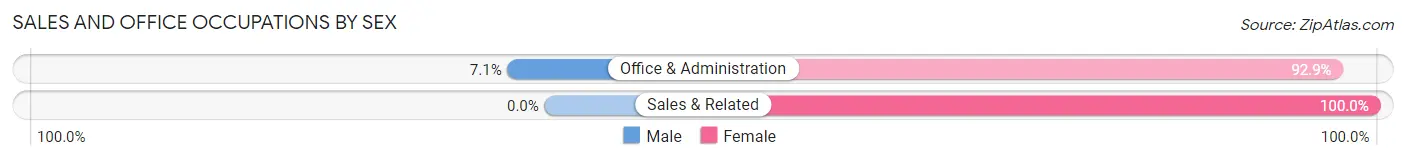
| Occupation | Male | Female |
| Sales & Related | 0 (0.0%) | 2 (100.0%) |
| Office & Administration | 1 (7.1%) | 13 (92.9%) |
| Total (Category) | 1 (6.2%) | 15 (93.8%) |
| Total (Overall) | 26 (45.6%) | 31 (54.4%) |
Natural Resources, Construction and Maintenance Occupations
The most common Natural Resources, Construction and Maintenance occupations in Lublin are , and Construction & Extraction (4 | 7.0%).
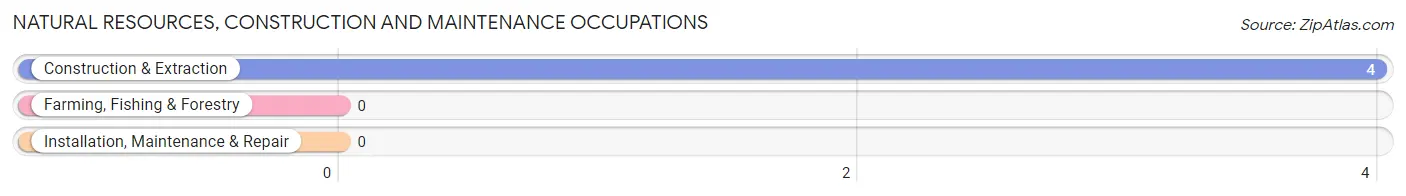
Natural Resources, Construction and Maintenance Occupations by Sex
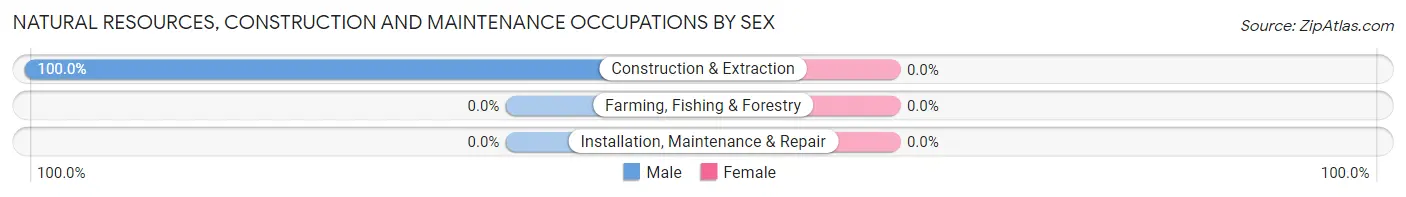
| Occupation | Male | Female |
| Farming, Fishing & Forestry | 0 (0.0%) | 0 (0.0%) |
| Construction & Extraction | 4 (100.0%) | 0 (0.0%) |
| Installation, Maintenance & Repair | 0 (0.0%) | 0 (0.0%) |
| Total (Category) | 4 (100.0%) | 0 (0.0%) |
| Total (Overall) | 26 (45.6%) | 31 (54.4%) |
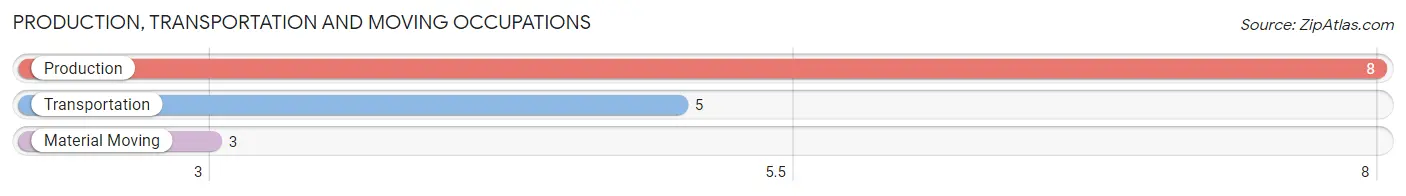
Production, Transportation and Moving Occupations
The most common Production, Transportation and Moving occupations in Lublin are Production (8 | 14.0%), Transportation (5 | 8.8%), and Material Moving (3 | 5.3%).
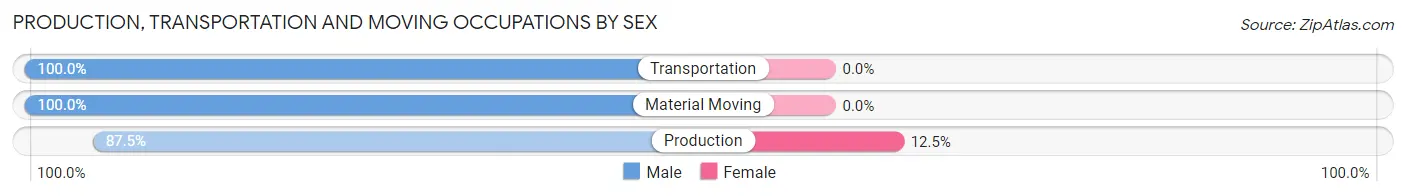
Production, Transportation and Moving Occupations by Sex
| Occupation | Male | Female |
| Production | 7 (87.5%) | 1 (12.5%) |
| Transportation | 5 (100.0%) | 0 (0.0%) |
| Material Moving | 3 (100.0%) | 0 (0.0%) |
| Total (Category) | 15 (93.8%) | 1 (6.2%) |
| Total (Overall) | 26 (45.6%) | 31 (54.4%) |
Employment Industries by Sex in Lublin
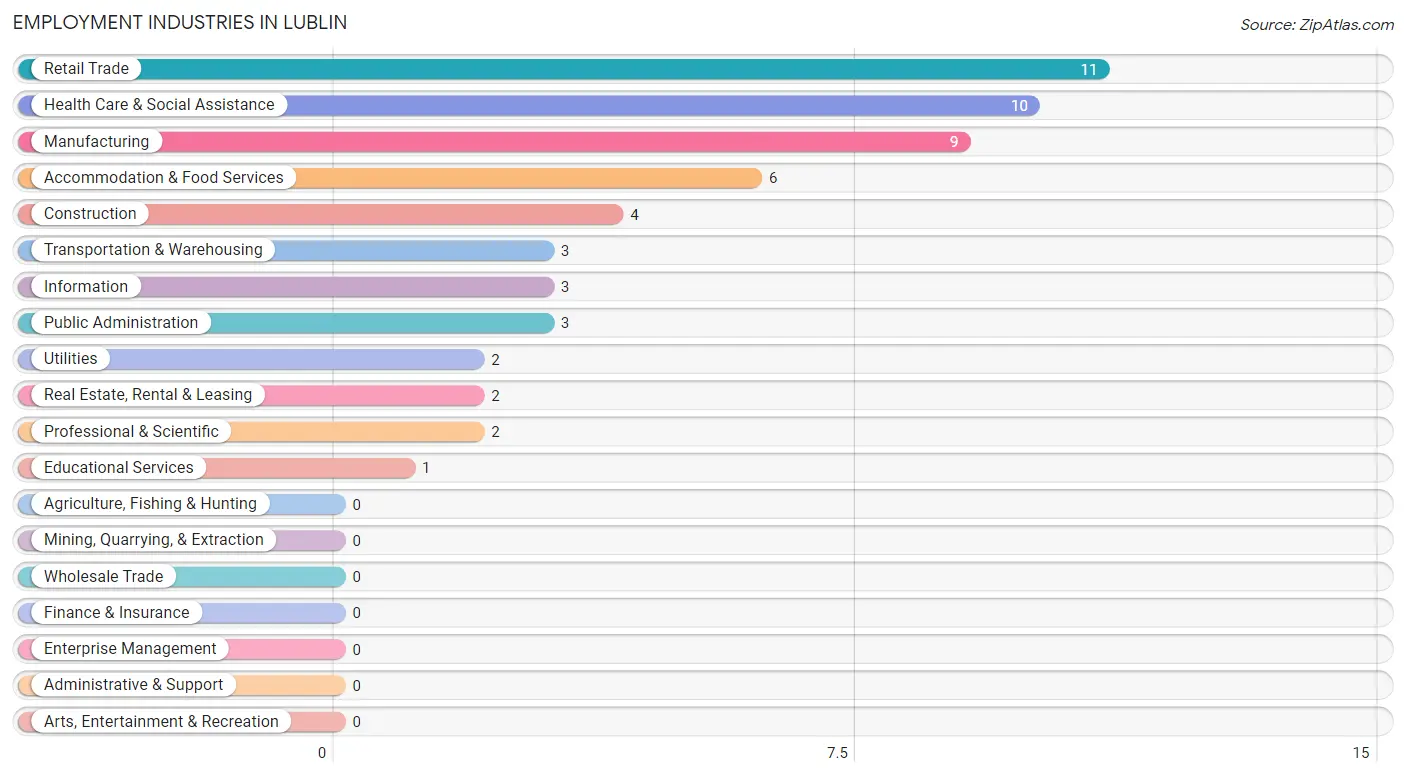
Employment Industries in Lublin
The major employment industries in Lublin include Retail Trade (11 | 19.3%), Health Care & Social Assistance (10 | 17.5%), Manufacturing (9 | 15.8%), Accommodation & Food Services (6 | 10.5%), and Construction (4 | 7.0%).
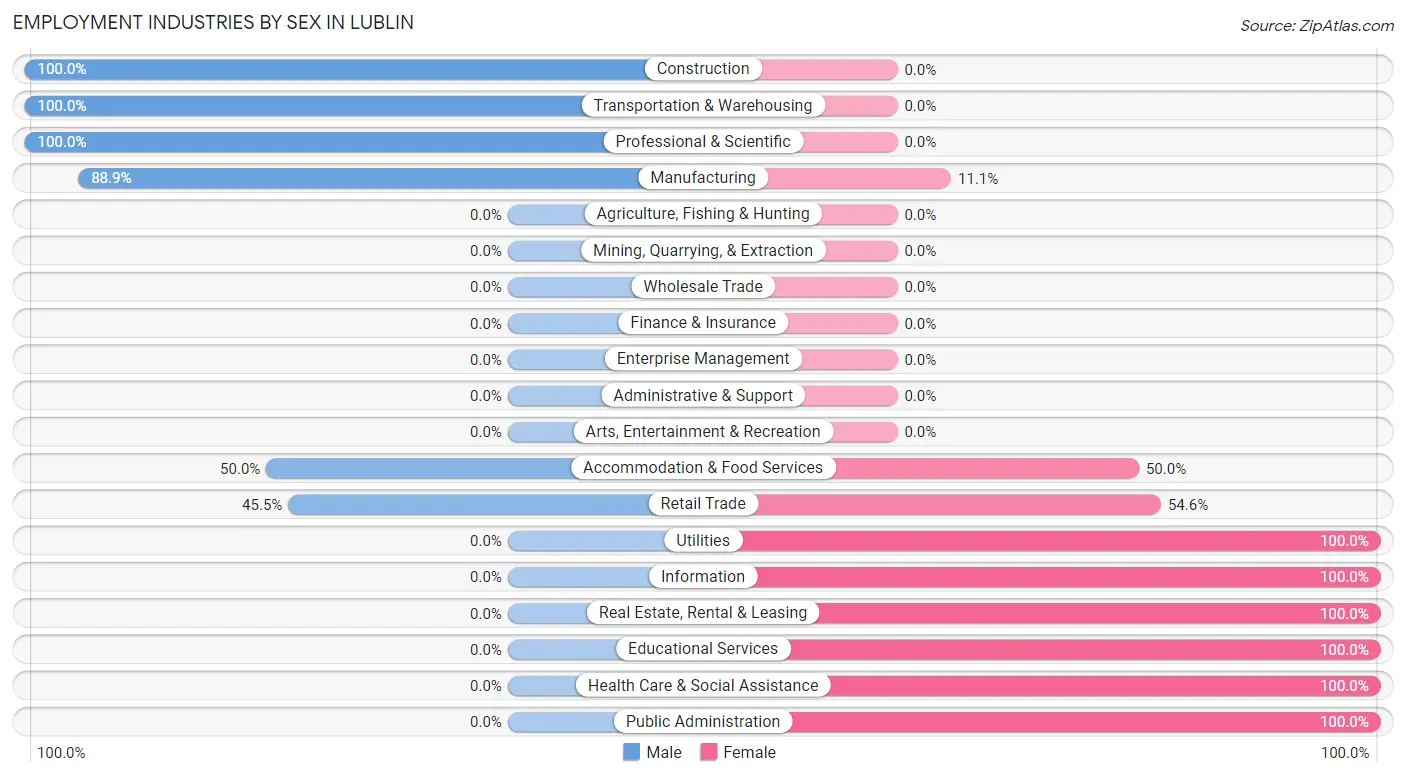
Employment Industries by Sex in Lublin
The Lublin industries that see more men than women are Construction (100.0%), Transportation & Warehousing (100.0%), and Professional & Scientific (100.0%), whereas the industries that tend to have a higher number of women are Utilities (100.0%), Information (100.0%), and Real Estate, Rental & Leasing (100.0%).
| Industry | Male | Female |
| Agriculture, Fishing & Hunting | 0 (0.0%) | 0 (0.0%) |
| Mining, Quarrying, & Extraction | 0 (0.0%) | 0 (0.0%) |
| Construction | 4 (100.0%) | 0 (0.0%) |
| Manufacturing | 8 (88.9%) | 1 (11.1%) |
| Wholesale Trade | 0 (0.0%) | 0 (0.0%) |
| Retail Trade | 5 (45.5%) | 6 (54.5%) |
| Transportation & Warehousing | 3 (100.0%) | 0 (0.0%) |
| Utilities | 0 (0.0%) | 2 (100.0%) |
| Information | 0 (0.0%) | 3 (100.0%) |
| Finance & Insurance | 0 (0.0%) | 0 (0.0%) |
| Real Estate, Rental & Leasing | 0 (0.0%) | 2 (100.0%) |
| Professional & Scientific | 2 (100.0%) | 0 (0.0%) |
| Enterprise Management | 0 (0.0%) | 0 (0.0%) |
| Administrative & Support | 0 (0.0%) | 0 (0.0%) |
| Educational Services | 0 (0.0%) | 1 (100.0%) |
| Health Care & Social Assistance | 0 (0.0%) | 10 (100.0%) |
| Arts, Entertainment & Recreation | 0 (0.0%) | 0 (0.0%) |
| Accommodation & Food Services | 3 (50.0%) | 3 (50.0%) |
| Public Administration | 0 (0.0%) | 3 (100.0%) |
| Total | 26 (45.6%) | 31 (54.4%) |
Education in Lublin
School Enrollment in Lublin
The most common levels of schooling among the 10 students in Lublin are college / undergraduate (4 | 40.0%), elementary school (3 | 30.0%), and middle school (3 | 30.0%).
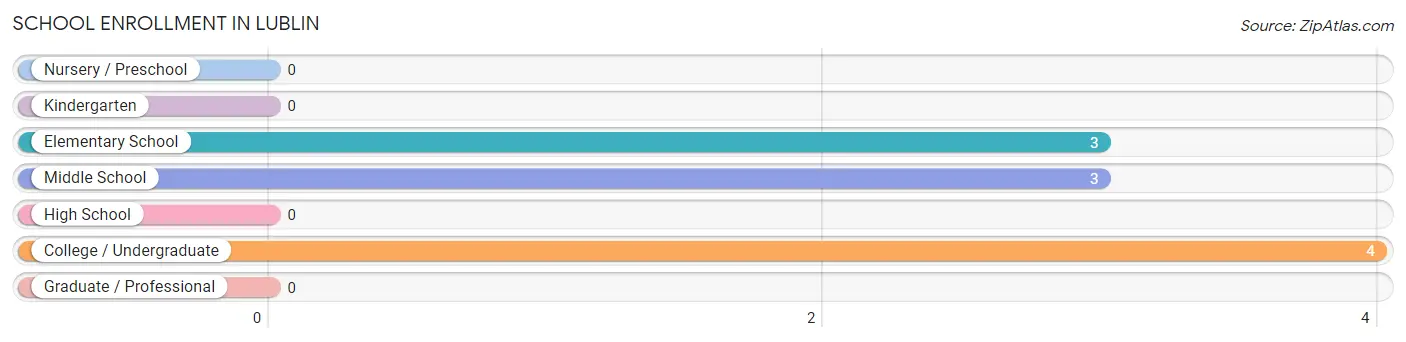
| School Level | # Students | % Students |
| Nursery / Preschool | 0 | 0.0% |
| Kindergarten | 0 | 0.0% |
| Elementary School | 3 | 30.0% |
| Middle School | 3 | 30.0% |
| High School | 0 | 0.0% |
| College / Undergraduate | 4 | 40.0% |
| Graduate / Professional | 0 | 0.0% |
| Total | 10 | 100.0% |
School Enrollment by Age by Funding Source in Lublin
Out of a total of 10 students who are enrolled in schools in Lublin, 4 (40.0%) attend a private institution, while the remaining 6 (60.0%) are enrolled in public schools. The age group of 5 to 9 year old has the highest likelihood of being enrolled in private schools, with 3 (100.0% in the age bracket) enrolled. Conversely, the age group of 10 to 14 year olds has the lowest likelihood of being enrolled in a private school, with 3 (100.0% in the age bracket) attending a public institution.
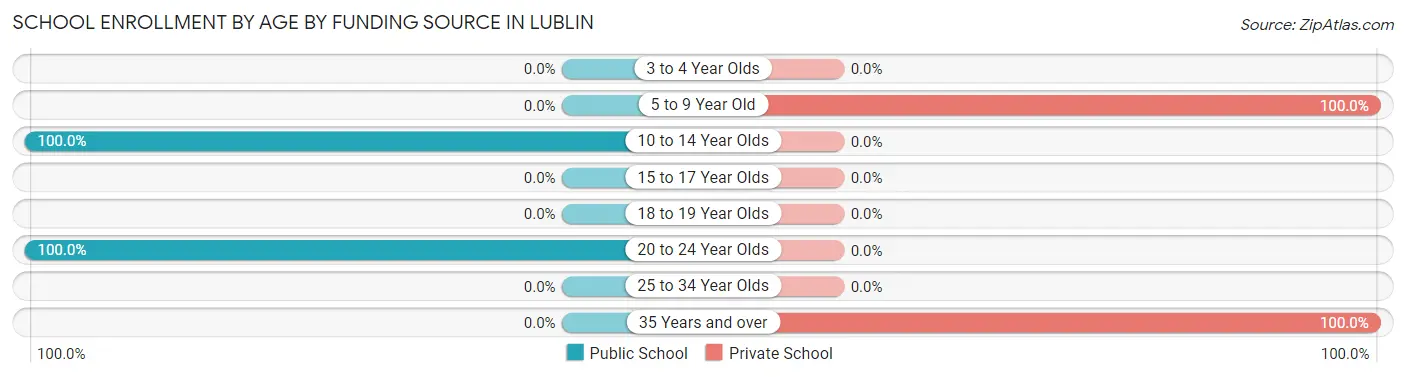
| Age Bracket | Public School | Private School |
| 3 to 4 Year Olds | 0 (0.0%) | 0 (0.0%) |
| 5 to 9 Year Old | 0 (0.0%) | 3 (100.0%) |
| 10 to 14 Year Olds | 3 (100.0%) | 0 (0.0%) |
| 15 to 17 Year Olds | 0 (0.0%) | 0 (0.0%) |
| 18 to 19 Year Olds | 0 (0.0%) | 0 (0.0%) |
| 20 to 24 Year Olds | 3 (100.0%) | 0 (0.0%) |
| 25 to 34 Year Olds | 0 (0.0%) | 0 (0.0%) |
| 35 Years and over | 0 (0.0%) | 1 (100.0%) |
| Total | 6 (60.0%) | 4 (40.0%) |
Educational Attainment by Field of Study in Lublin
Science & technology (4 | 40.0%), computers & mathematics (2 | 20.0%), physical & health sciences (1 | 10.0%), social sciences (1 | 10.0%), and multidisciplinary studies (1 | 10.0%) are the most common fields of study among 10 individuals in Lublin who have obtained a bachelor's degree or higher.
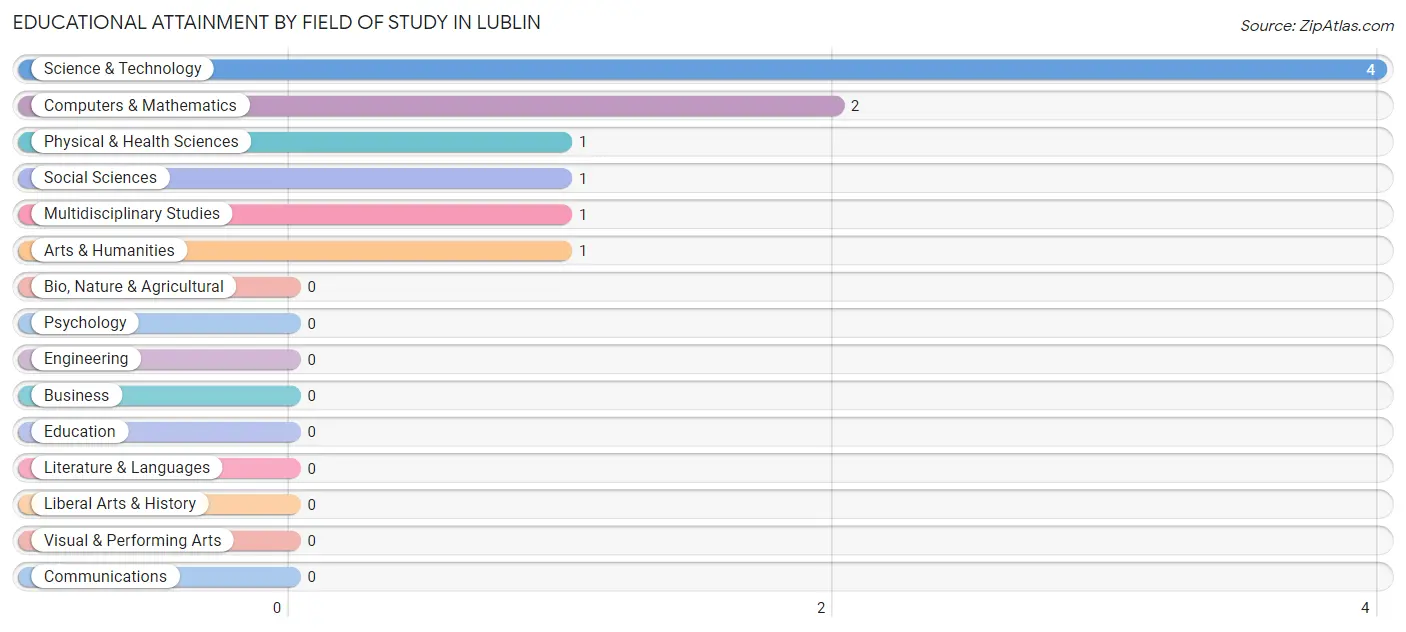
| Field of Study | # Graduates | % Graduates |
| Computers & Mathematics | 2 | 20.0% |
| Bio, Nature & Agricultural | 0 | 0.0% |
| Physical & Health Sciences | 1 | 10.0% |
| Psychology | 0 | 0.0% |
| Social Sciences | 1 | 10.0% |
| Engineering | 0 | 0.0% |
| Multidisciplinary Studies | 1 | 10.0% |
| Science & Technology | 4 | 40.0% |
| Business | 0 | 0.0% |
| Education | 0 | 0.0% |
| Literature & Languages | 0 | 0.0% |
| Liberal Arts & History | 0 | 0.0% |
| Visual & Performing Arts | 0 | 0.0% |
| Communications | 0 | 0.0% |
| Arts & Humanities | 1 | 10.0% |
| Total | 10 | 100.0% |
Transportation & Commute in Lublin
Vehicle Availability by Sex in Lublin
The most prevalent vehicle ownership categories in Lublin are males with 2 vehicles (12, accounting for 50.0%) and females with 2 vehicles (15, making up 38.7%).

| Vehicles Available | Male | Female |
| No Vehicle | 0 (0.0%) | 4 (12.9%) |
| 1 Vehicle | 0 (0.0%) | 5 (16.1%) |
| 2 Vehicles | 12 (50.0%) | 15 (48.4%) |
| 3 Vehicles | 10 (41.7%) | 7 (22.6%) |
| 4 Vehicles | 0 (0.0%) | 0 (0.0%) |
| 5 or more Vehicles | 2 (8.3%) | 0 (0.0%) |
| Total | 24 (100.0%) | 31 (100.0%) |
Commute Time in Lublin
The most frequently occuring commute durations in Lublin are 15 to 19 minutes (15 commuters, 30.0%), 20 to 24 minutes (11 commuters, 22.0%), and 25 to 29 minutes (9 commuters, 18.0%).
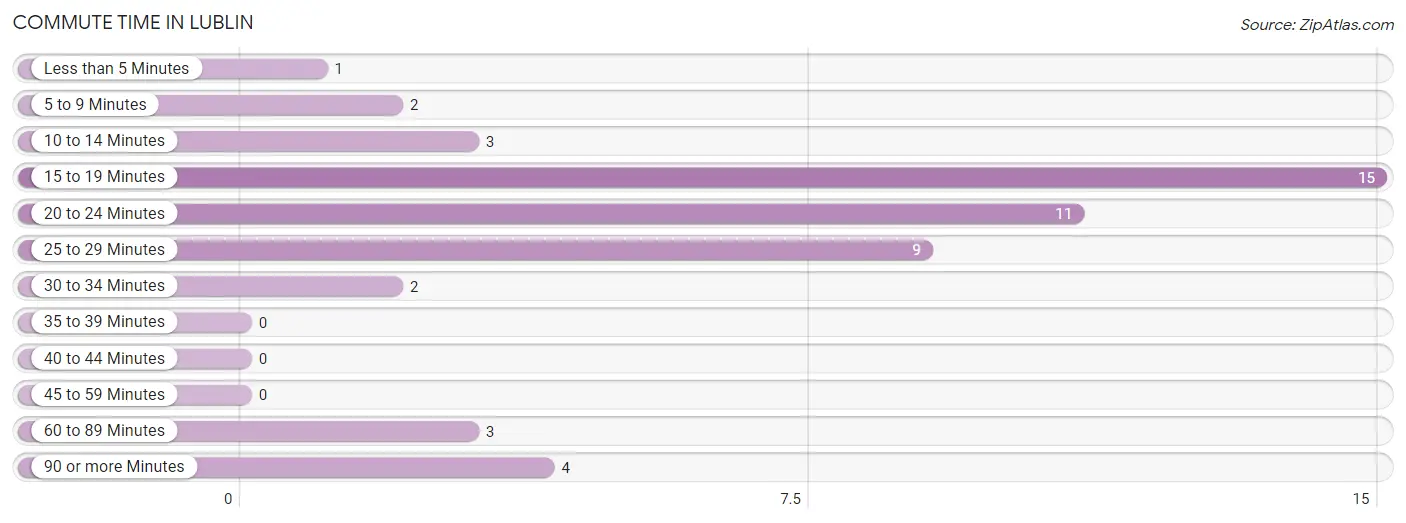
| Commute Time | # Commuters | % Commuters |
| Less than 5 Minutes | 1 | 2.0% |
| 5 to 9 Minutes | 2 | 4.0% |
| 10 to 14 Minutes | 3 | 6.0% |
| 15 to 19 Minutes | 15 | 30.0% |
| 20 to 24 Minutes | 11 | 22.0% |
| 25 to 29 Minutes | 9 | 18.0% |
| 30 to 34 Minutes | 2 | 4.0% |
| 35 to 39 Minutes | 0 | 0.0% |
| 40 to 44 Minutes | 0 | 0.0% |
| 45 to 59 Minutes | 0 | 0.0% |
| 60 to 89 Minutes | 3 | 6.0% |
| 90 or more Minutes | 4 | 8.0% |
Commute Time by Sex in Lublin
The most common commute times in Lublin are 15 to 19 minutes (7 commuters, 31.8%) for males and 20 to 24 minutes (11 commuters, 39.3%) for females.
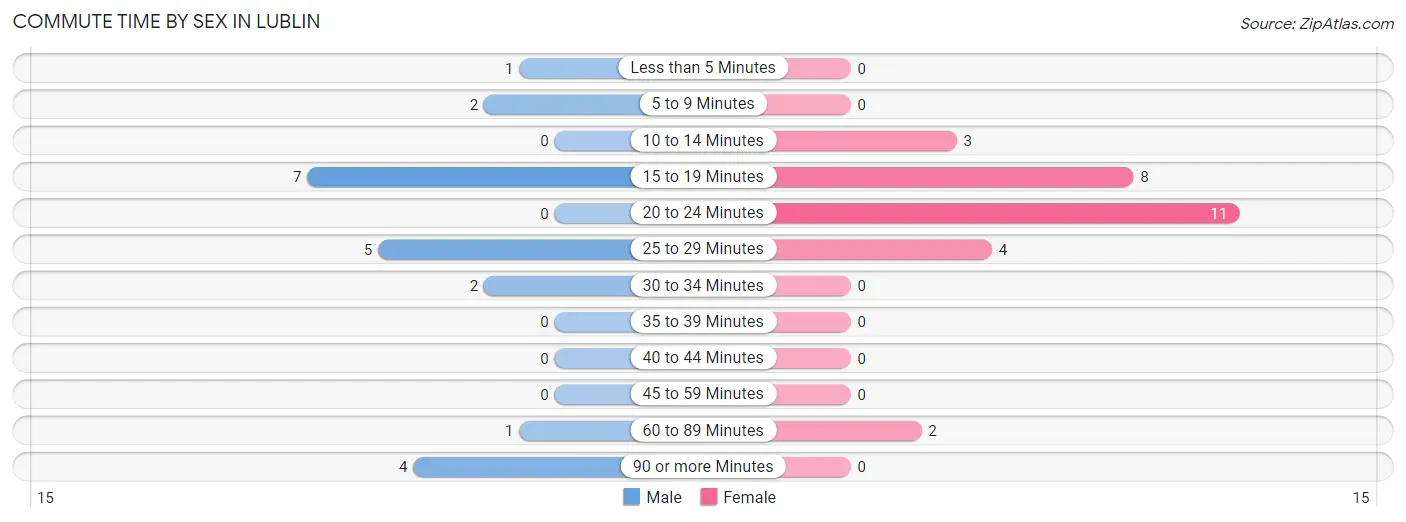
| Commute Time | Male | Female |
| Less than 5 Minutes | 1 (4.5%) | 0 (0.0%) |
| 5 to 9 Minutes | 2 (9.1%) | 0 (0.0%) |
| 10 to 14 Minutes | 0 (0.0%) | 3 (10.7%) |
| 15 to 19 Minutes | 7 (31.8%) | 8 (28.6%) |
| 20 to 24 Minutes | 0 (0.0%) | 11 (39.3%) |
| 25 to 29 Minutes | 5 (22.7%) | 4 (14.3%) |
| 30 to 34 Minutes | 2 (9.1%) | 0 (0.0%) |
| 35 to 39 Minutes | 0 (0.0%) | 0 (0.0%) |
| 40 to 44 Minutes | 0 (0.0%) | 0 (0.0%) |
| 45 to 59 Minutes | 0 (0.0%) | 0 (0.0%) |
| 60 to 89 Minutes | 1 (4.5%) | 2 (7.1%) |
| 90 or more Minutes | 4 (18.2%) | 0 (0.0%) |
Time of Departure to Work by Sex in Lublin
The most frequent times of departure to work in Lublin are 5:00 AM to 5:29 AM (10, 45.5%) for males and 12:00 PM to 3:59 PM (9, 32.1%) for females.
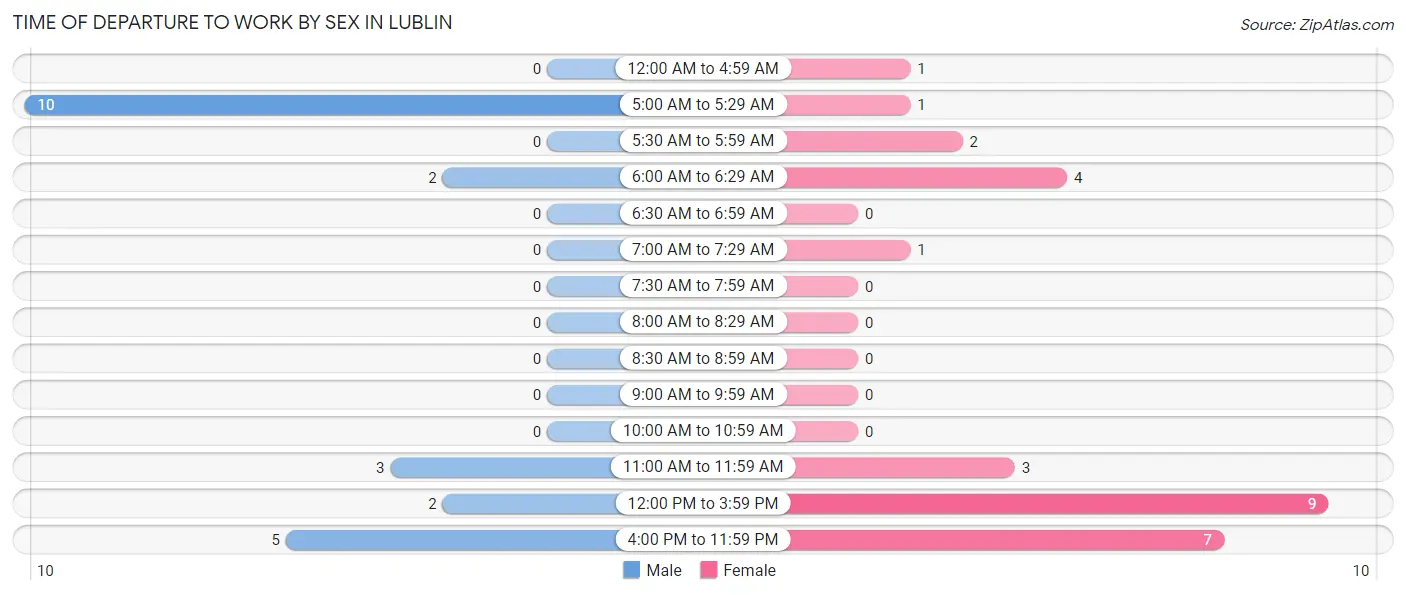
| Time of Departure | Male | Female |
| 12:00 AM to 4:59 AM | 0 (0.0%) | 1 (3.6%) |
| 5:00 AM to 5:29 AM | 10 (45.5%) | 1 (3.6%) |
| 5:30 AM to 5:59 AM | 0 (0.0%) | 2 (7.1%) |
| 6:00 AM to 6:29 AM | 2 (9.1%) | 4 (14.3%) |
| 6:30 AM to 6:59 AM | 0 (0.0%) | 0 (0.0%) |
| 7:00 AM to 7:29 AM | 0 (0.0%) | 1 (3.6%) |
| 7:30 AM to 7:59 AM | 0 (0.0%) | 0 (0.0%) |
| 8:00 AM to 8:29 AM | 0 (0.0%) | 0 (0.0%) |
| 8:30 AM to 8:59 AM | 0 (0.0%) | 0 (0.0%) |
| 9:00 AM to 9:59 AM | 0 (0.0%) | 0 (0.0%) |
| 10:00 AM to 10:59 AM | 0 (0.0%) | 0 (0.0%) |
| 11:00 AM to 11:59 AM | 3 (13.6%) | 3 (10.7%) |
| 12:00 PM to 3:59 PM | 2 (9.1%) | 9 (32.1%) |
| 4:00 PM to 11:59 PM | 5 (22.7%) | 7 (25.0%) |
| Total | 22 (100.0%) | 28 (100.0%) |
Housing Occupancy in Lublin
Occupancy by Ownership in Lublin
Of the total 62 dwellings in Lublin, owner-occupied units account for 45 (72.6%), while renter-occupied units make up 17 (27.4%).
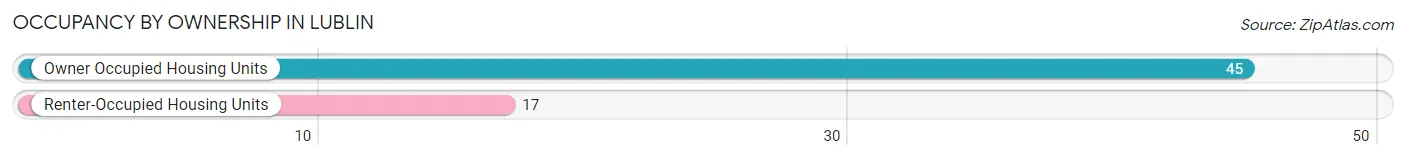
| Occupancy | # Housing Units | % Housing Units |
| Owner Occupied Housing Units | 45 | 72.6% |
| Renter-Occupied Housing Units | 17 | 27.4% |
| Total Occupied Housing Units | 62 | 100.0% |
Occupancy by Household Size in Lublin
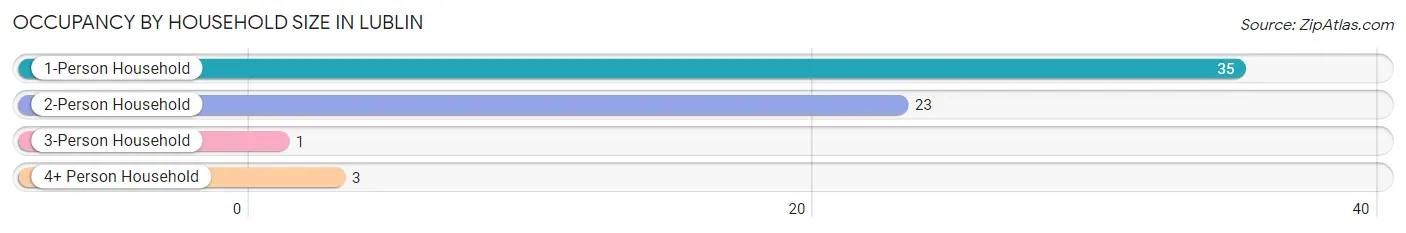
| Household Size | # Housing Units | % Housing Units |
| 1-Person Household | 35 | 56.5% |
| 2-Person Household | 23 | 37.1% |
| 3-Person Household | 1 | 1.6% |
| 4+ Person Household | 3 | 4.8% |
| Total Housing Units | 62 | 100.0% |
Occupancy by Ownership by Household Size in Lublin
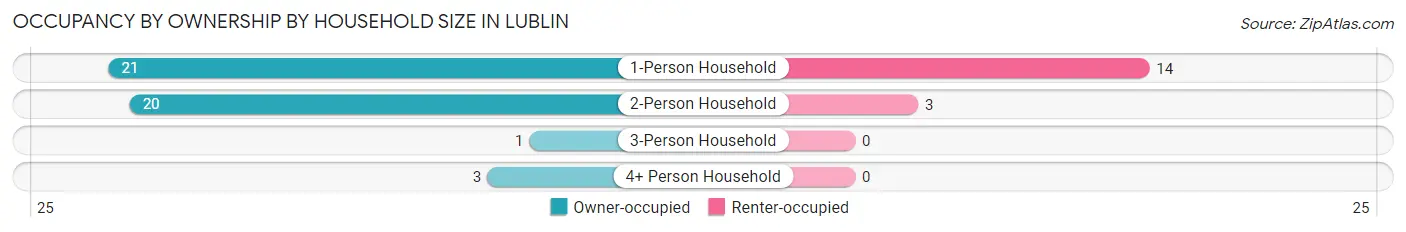
| Household Size | Owner-occupied | Renter-occupied |
| 1-Person Household | 21 (60.0%) | 14 (40.0%) |
| 2-Person Household | 20 (87.0%) | 3 (13.0%) |
| 3-Person Household | 1 (100.0%) | 0 (0.0%) |
| 4+ Person Household | 3 (100.0%) | 0 (0.0%) |
| Total Housing Units | 45 (72.6%) | 17 (27.4%) |
Occupancy by Educational Attainment in Lublin
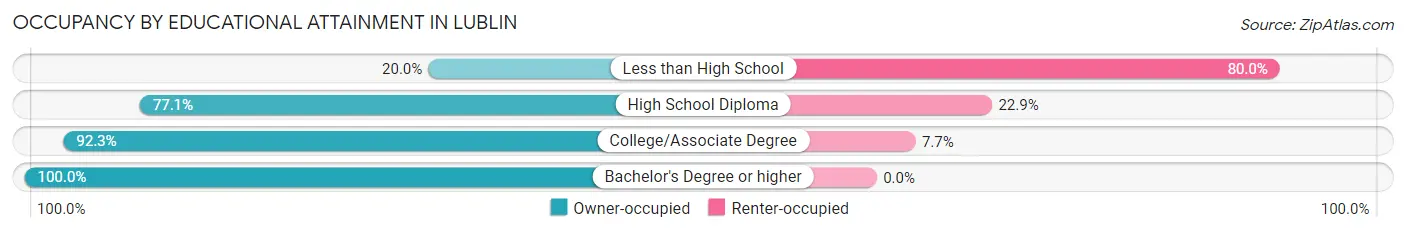
| Household Size | Owner-occupied | Renter-occupied |
| Less than High School | 2 (20.0%) | 8 (80.0%) |
| High School Diploma | 27 (77.1%) | 8 (22.9%) |
| College/Associate Degree | 12 (92.3%) | 1 (7.7%) |
| Bachelor's Degree or higher | 4 (100.0%) | 0 (0.0%) |
Occupancy by Age of Householder in Lublin
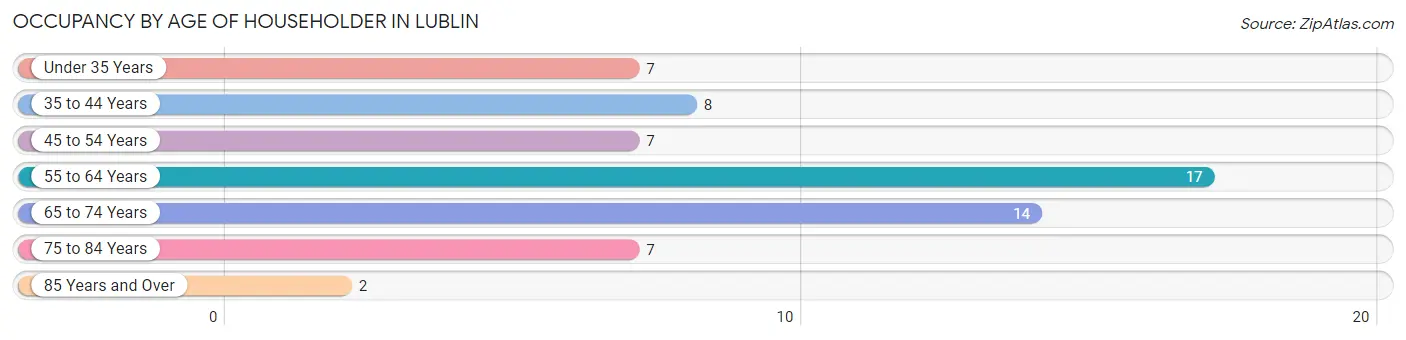
| Age Bracket | # Households | % Households |
| Under 35 Years | 7 | 11.3% |
| 35 to 44 Years | 8 | 12.9% |
| 45 to 54 Years | 7 | 11.3% |
| 55 to 64 Years | 17 | 27.4% |
| 65 to 74 Years | 14 | 22.6% |
| 75 to 84 Years | 7 | 11.3% |
| 85 Years and Over | 2 | 3.2% |
| Total | 62 | 100.0% |
Housing Finances in Lublin
Median Income by Occupancy in Lublin
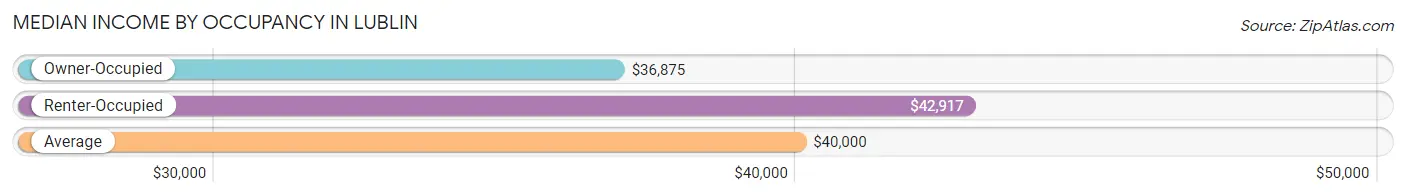
| Occupancy Type | # Households | Median Income |
| Owner-Occupied | 45 (72.6%) | $36,875 |
| Renter-Occupied | 17 (27.4%) | $42,917 |
| Average | 62 (100.0%) | $40,000 |
Occupancy by Householder Income Bracket in Lublin
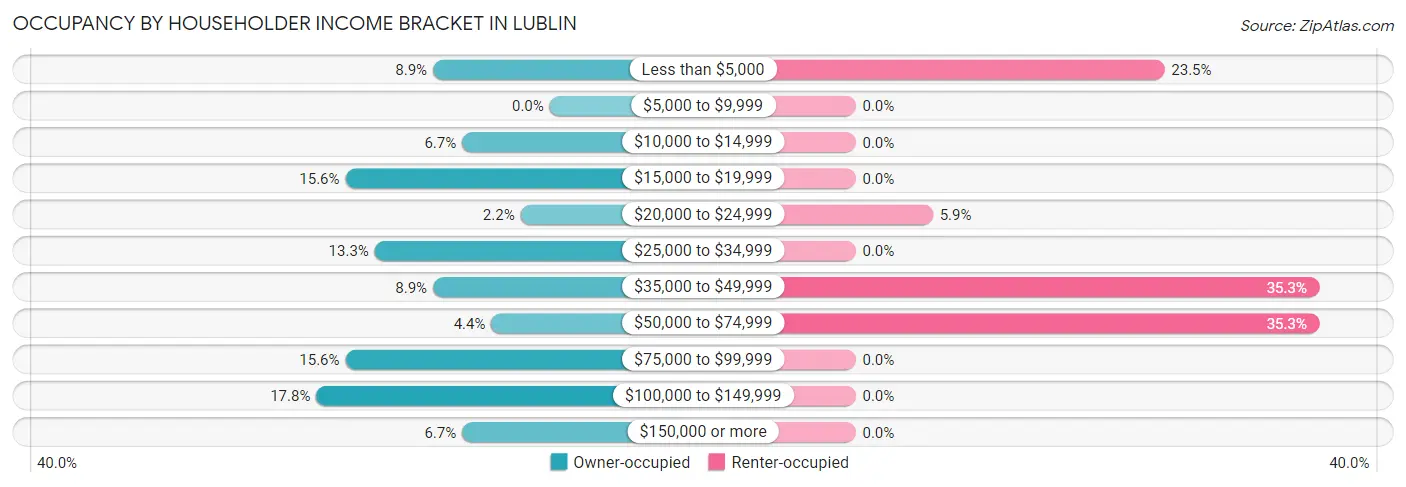
| Income Bracket | Owner-occupied | Renter-occupied |
| Less than $5,000 | 4 (8.9%) | 4 (23.5%) |
| $5,000 to $9,999 | 0 (0.0%) | 0 (0.0%) |
| $10,000 to $14,999 | 3 (6.7%) | 0 (0.0%) |
| $15,000 to $19,999 | 7 (15.6%) | 0 (0.0%) |
| $20,000 to $24,999 | 1 (2.2%) | 1 (5.9%) |
| $25,000 to $34,999 | 6 (13.3%) | 0 (0.0%) |
| $35,000 to $49,999 | 4 (8.9%) | 6 (35.3%) |
| $50,000 to $74,999 | 2 (4.4%) | 6 (35.3%) |
| $75,000 to $99,999 | 7 (15.6%) | 0 (0.0%) |
| $100,000 to $149,999 | 8 (17.8%) | 0 (0.0%) |
| $150,000 or more | 3 (6.7%) | 0 (0.0%) |
| Total | 45 (100.0%) | 17 (100.0%) |
Monthly Housing Cost Tiers in Lublin
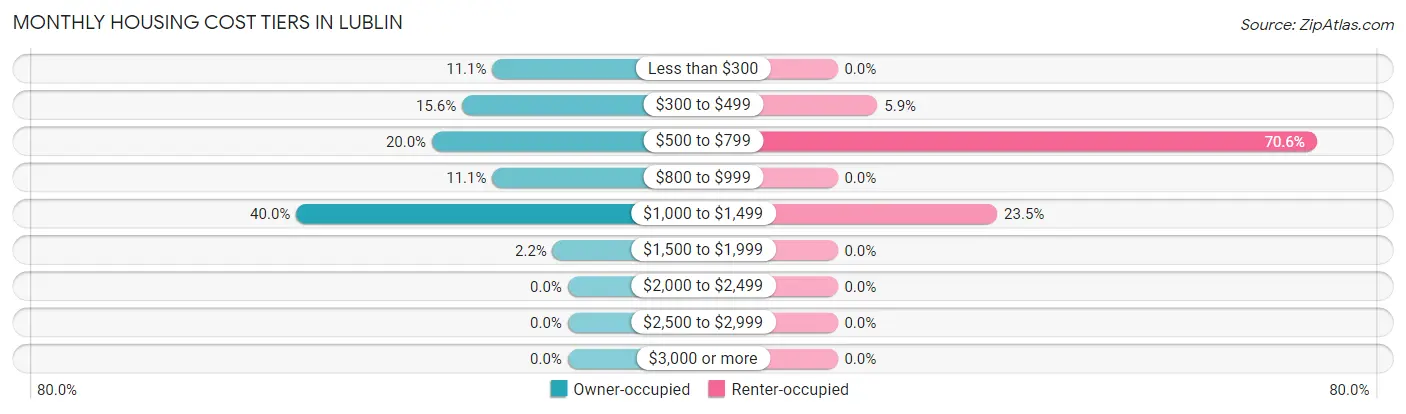
| Monthly Cost | Owner-occupied | Renter-occupied |
| Less than $300 | 5 (11.1%) | 0 (0.0%) |
| $300 to $499 | 7 (15.6%) | 1 (5.9%) |
| $500 to $799 | 9 (20.0%) | 12 (70.6%) |
| $800 to $999 | 5 (11.1%) | 0 (0.0%) |
| $1,000 to $1,499 | 18 (40.0%) | 4 (23.5%) |
| $1,500 to $1,999 | 1 (2.2%) | 0 (0.0%) |
| $2,000 to $2,499 | 0 (0.0%) | 0 (0.0%) |
| $2,500 to $2,999 | 0 (0.0%) | 0 (0.0%) |
| $3,000 or more | 0 (0.0%) | 0 (0.0%) |
| Total | 45 (100.0%) | 17 (100.0%) |
Physical Housing Characteristics in Lublin
Housing Structures in Lublin
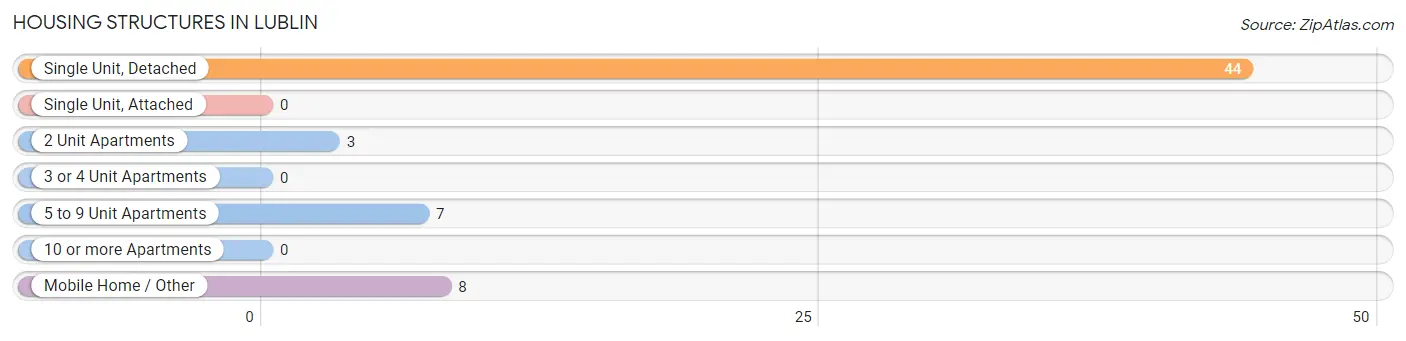
| Structure Type | # Housing Units | % Housing Units |
| Single Unit, Detached | 44 | 71.0% |
| Single Unit, Attached | 0 | 0.0% |
| 2 Unit Apartments | 3 | 4.8% |
| 3 or 4 Unit Apartments | 0 | 0.0% |
| 5 to 9 Unit Apartments | 7 | 11.3% |
| 10 or more Apartments | 0 | 0.0% |
| Mobile Home / Other | 8 | 12.9% |
| Total | 62 | 100.0% |
Housing Structures by Occupancy in Lublin
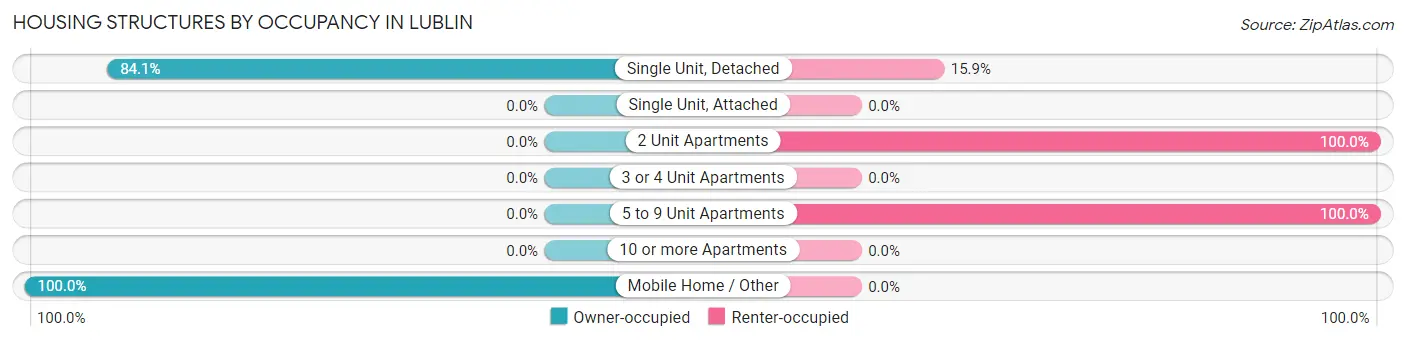
| Structure Type | Owner-occupied | Renter-occupied |
| Single Unit, Detached | 37 (84.1%) | 7 (15.9%) |
| Single Unit, Attached | 0 (0.0%) | 0 (0.0%) |
| 2 Unit Apartments | 0 (0.0%) | 3 (100.0%) |
| 3 or 4 Unit Apartments | 0 (0.0%) | 0 (0.0%) |
| 5 to 9 Unit Apartments | 0 (0.0%) | 7 (100.0%) |
| 10 or more Apartments | 0 (0.0%) | 0 (0.0%) |
| Mobile Home / Other | 8 (100.0%) | 0 (0.0%) |
| Total | 45 (72.6%) | 17 (27.4%) |
Housing Structures by Number of Rooms in Lublin
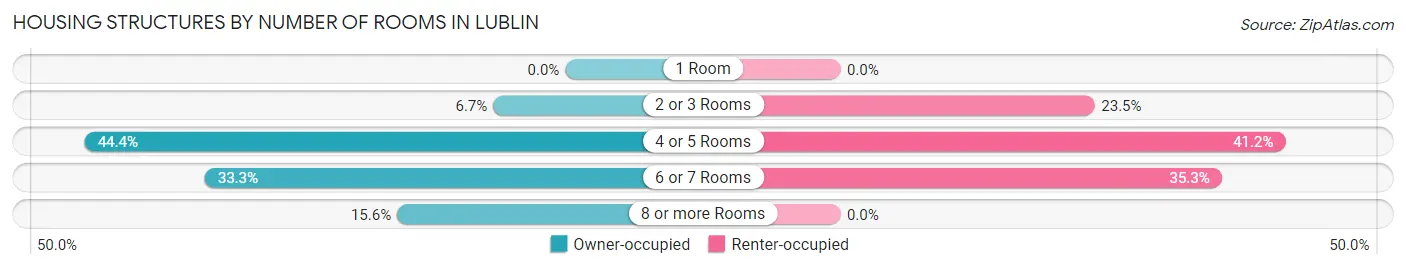
| Number of Rooms | Owner-occupied | Renter-occupied |
| 1 Room | 0 (0.0%) | 0 (0.0%) |
| 2 or 3 Rooms | 3 (6.7%) | 4 (23.5%) |
| 4 or 5 Rooms | 20 (44.4%) | 7 (41.2%) |
| 6 or 7 Rooms | 15 (33.3%) | 6 (35.3%) |
| 8 or more Rooms | 7 (15.6%) | 0 (0.0%) |
| Total | 45 (100.0%) | 17 (100.0%) |
Housing Structure by Heating Type in Lublin
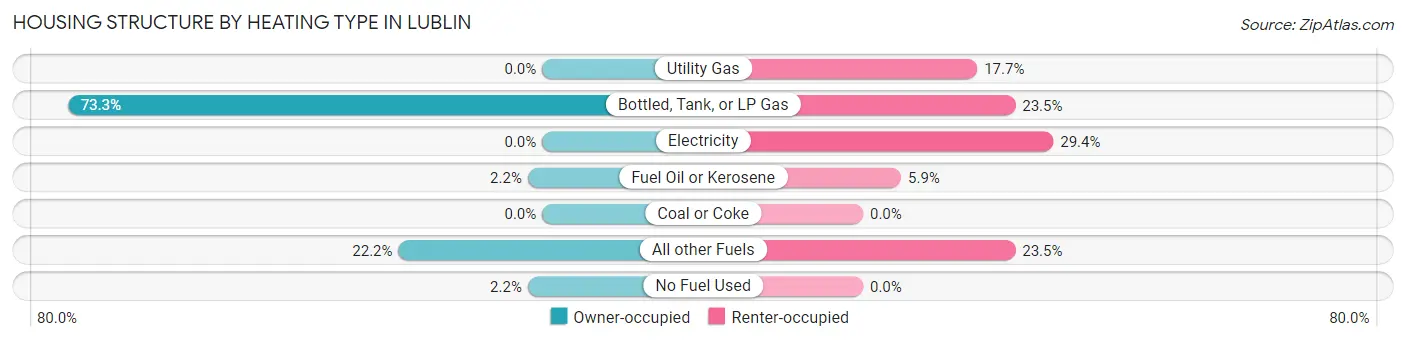
| Heating Type | Owner-occupied | Renter-occupied |
| Utility Gas | 0 (0.0%) | 3 (17.6%) |
| Bottled, Tank, or LP Gas | 33 (73.3%) | 4 (23.5%) |
| Electricity | 0 (0.0%) | 5 (29.4%) |
| Fuel Oil or Kerosene | 1 (2.2%) | 1 (5.9%) |
| Coal or Coke | 0 (0.0%) | 0 (0.0%) |
| All other Fuels | 10 (22.2%) | 4 (23.5%) |
| No Fuel Used | 1 (2.2%) | 0 (0.0%) |
| Total | 45 (100.0%) | 17 (100.0%) |
Household Vehicle Usage in Lublin
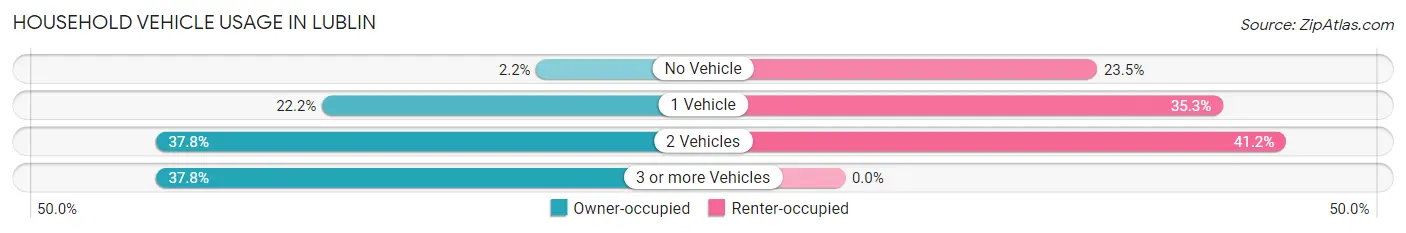
| Vehicles per Household | Owner-occupied | Renter-occupied |
| No Vehicle | 1 (2.2%) | 4 (23.5%) |
| 1 Vehicle | 10 (22.2%) | 6 (35.3%) |
| 2 Vehicles | 17 (37.8%) | 7 (41.2%) |
| 3 or more Vehicles | 17 (37.8%) | 0 (0.0%) |
| Total | 45 (100.0%) | 17 (100.0%) |
Real Estate & Mortgages in Lublin
Real Estate and Mortgage Overview in Lublin
| Characteristic | Without Mortgage | With Mortgage |
| Housing Units | 14 | 31 |
| Median Property Value | $90,000 | $118,800 |
| Median Household Income | $18,750 | $2 |
| Monthly Housing Costs | $420 | $0 |
| Real Estate Taxes | $1,667 | $0 |
Property Value by Mortgage Status in Lublin
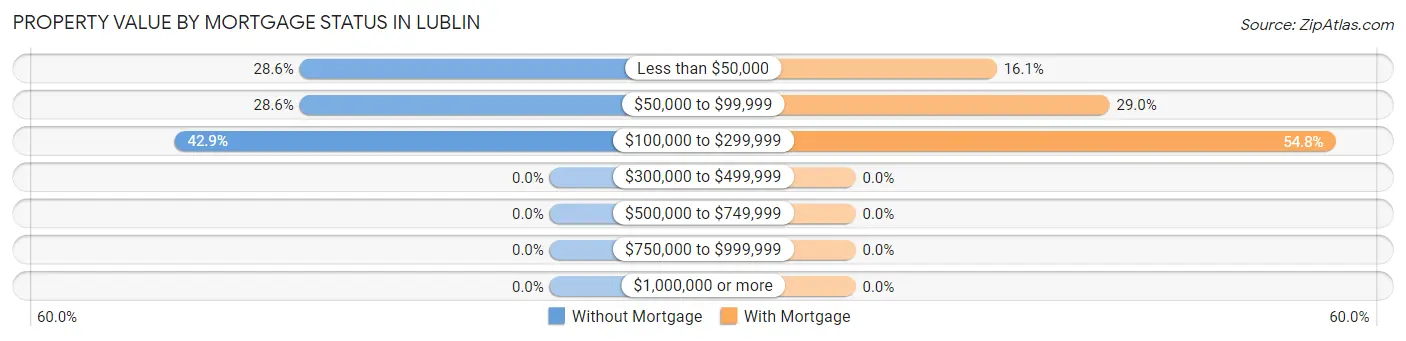
| Property Value | Without Mortgage | With Mortgage |
| Less than $50,000 | 4 (28.6%) | 5 (16.1%) |
| $50,000 to $99,999 | 4 (28.6%) | 9 (29.0%) |
| $100,000 to $299,999 | 6 (42.9%) | 17 (54.8%) |
| $300,000 to $499,999 | 0 (0.0%) | 0 (0.0%) |
| $500,000 to $749,999 | 0 (0.0%) | 0 (0.0%) |
| $750,000 to $999,999 | 0 (0.0%) | 0 (0.0%) |
| $1,000,000 or more | 0 (0.0%) | 0 (0.0%) |
| Total | 14 (100.0%) | 31 (100.0%) |
Household Income by Mortgage Status in Lublin
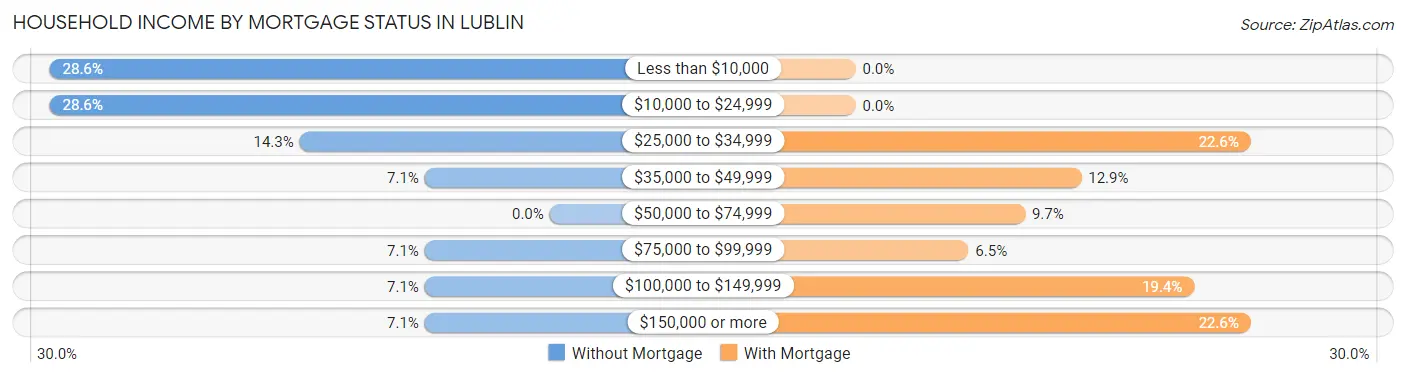
| Household Income | Without Mortgage | With Mortgage |
| Less than $10,000 | 4 (28.6%) | 0 (0.0%) |
| $10,000 to $24,999 | 4 (28.6%) | 0 (0.0%) |
| $25,000 to $34,999 | 2 (14.3%) | 7 (22.6%) |
| $35,000 to $49,999 | 1 (7.1%) | 4 (12.9%) |
| $50,000 to $74,999 | 0 (0.0%) | 3 (9.7%) |
| $75,000 to $99,999 | 1 (7.1%) | 2 (6.5%) |
| $100,000 to $149,999 | 1 (7.1%) | 6 (19.4%) |
| $150,000 or more | 1 (7.1%) | 7 (22.6%) |
| Total | 14 (100.0%) | 31 (100.0%) |
Property Value to Household Income Ratio in Lublin
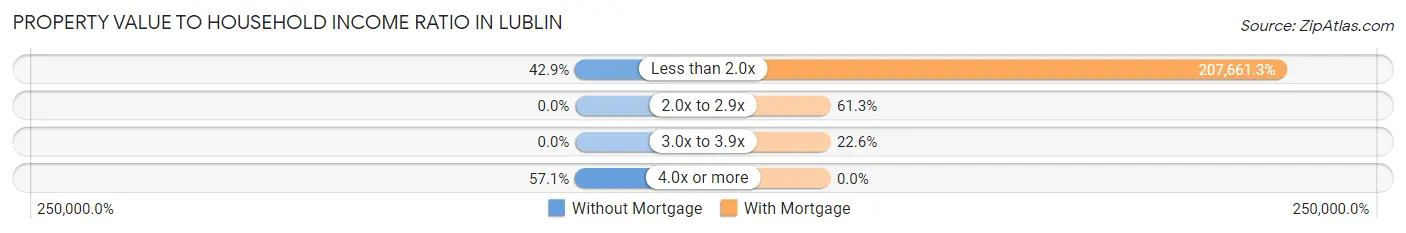
| Value-to-Income Ratio | Without Mortgage | With Mortgage |
| Less than 2.0x | 6 (42.9%) | 64,375 (207,661.3%) |
| 2.0x to 2.9x | 0 (0.0%) | 19 (61.3%) |
| 3.0x to 3.9x | 0 (0.0%) | 7 (22.6%) |
| 4.0x or more | 8 (57.1%) | 0 (0.0%) |
| Total | 14 (100.0%) | 31 (100.0%) |
Real Estate Taxes by Mortgage Status in Lublin
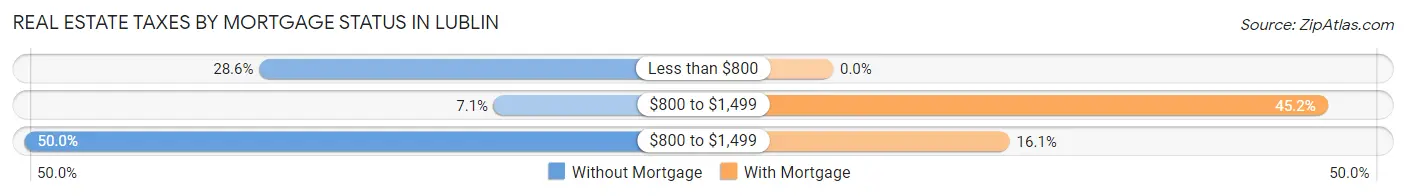
| Property Taxes | Without Mortgage | With Mortgage |
| Less than $800 | 4 (28.6%) | 0 (0.0%) |
| $800 to $1,499 | 1 (7.1%) | 14 (45.2%) |
| $800 to $1,499 | 7 (50.0%) | 5 (16.1%) |
| Total | 14 (100.0%) | 31 (100.0%) |
Health & Disability in Lublin
Health Insurance Coverage by Age in Lublin
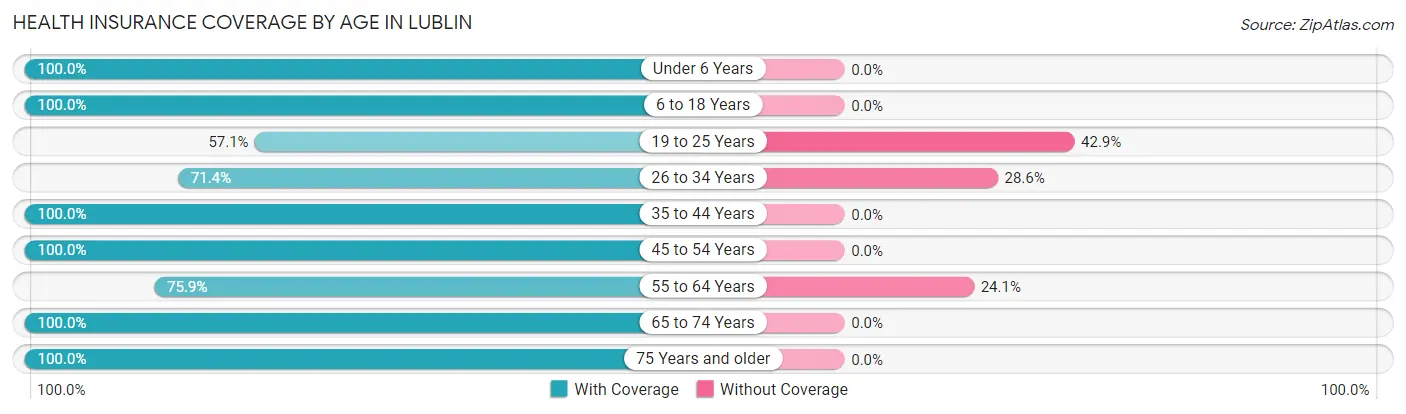
| Age Bracket | With Coverage | Without Coverage |
| Under 6 Years | 2 (100.0%) | 0 (0.0%) |
| 6 to 18 Years | 6 (100.0%) | 0 (0.0%) |
| 19 to 25 Years | 4 (57.1%) | 3 (42.9%) |
| 26 to 34 Years | 5 (71.4%) | 2 (28.6%) |
| 35 to 44 Years | 13 (100.0%) | 0 (0.0%) |
| 45 to 54 Years | 9 (100.0%) | 0 (0.0%) |
| 55 to 64 Years | 22 (75.9%) | 7 (24.1%) |
| 65 to 74 Years | 18 (100.0%) | 0 (0.0%) |
| 75 Years and older | 14 (100.0%) | 0 (0.0%) |
| Total | 93 (88.6%) | 12 (11.4%) |
Health Insurance Coverage by Citizenship Status in Lublin
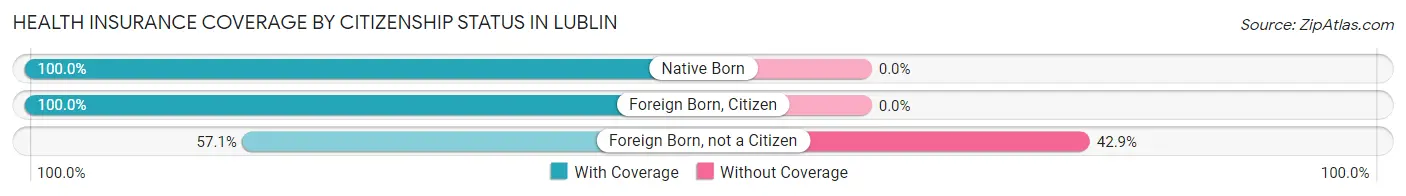
| Citizenship Status | With Coverage | Without Coverage |
| Native Born | 2 (100.0%) | 0 (0.0%) |
| Foreign Born, Citizen | 6 (100.0%) | 0 (0.0%) |
| Foreign Born, not a Citizen | 4 (57.1%) | 3 (42.9%) |
Health Insurance Coverage by Household Income in Lublin
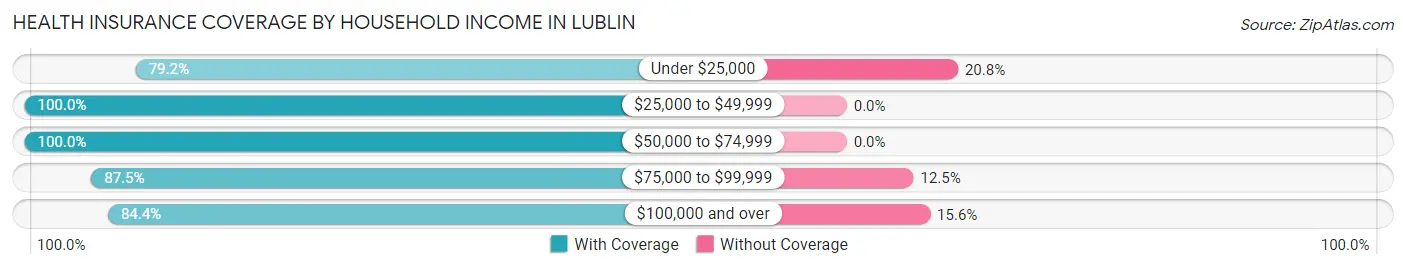
| Household Income | With Coverage | Without Coverage |
| Under $25,000 | 19 (79.2%) | 5 (20.8%) |
| $25,000 to $49,999 | 21 (100.0%) | 0 (0.0%) |
| $50,000 to $74,999 | 12 (100.0%) | 0 (0.0%) |
| $75,000 to $99,999 | 14 (87.5%) | 2 (12.5%) |
| $100,000 and over | 27 (84.4%) | 5 (15.6%) |
Public vs Private Health Insurance Coverage by Age in Lublin
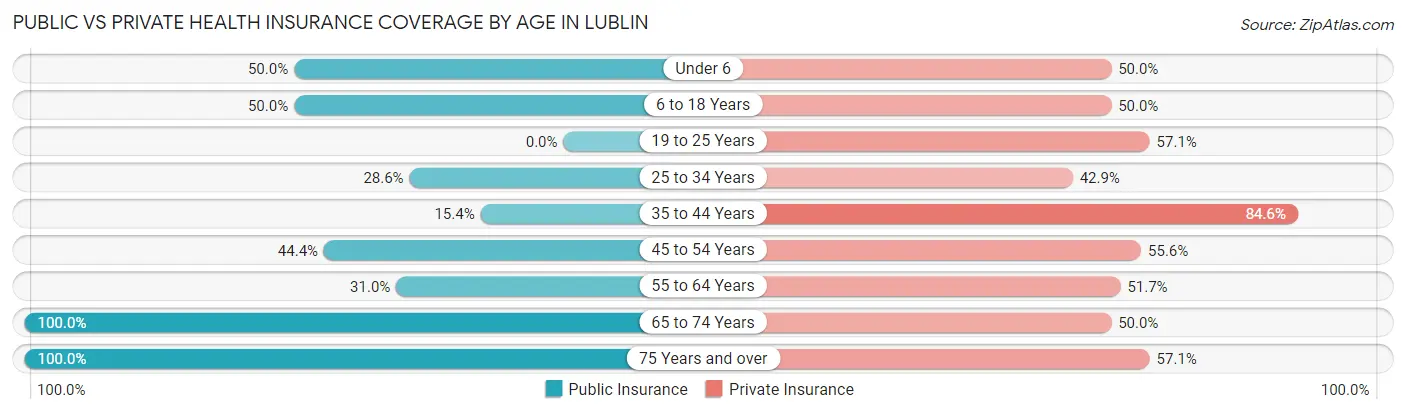
| Age Bracket | Public Insurance | Private Insurance |
| Under 6 | 1 (50.0%) | 1 (50.0%) |
| 6 to 18 Years | 3 (50.0%) | 3 (50.0%) |
| 19 to 25 Years | 0 (0.0%) | 4 (57.1%) |
| 25 to 34 Years | 2 (28.6%) | 3 (42.9%) |
| 35 to 44 Years | 2 (15.4%) | 11 (84.6%) |
| 45 to 54 Years | 4 (44.4%) | 5 (55.6%) |
| 55 to 64 Years | 9 (31.0%) | 15 (51.7%) |
| 65 to 74 Years | 18 (100.0%) | 9 (50.0%) |
| 75 Years and over | 14 (100.0%) | 8 (57.1%) |
| Total | 53 (50.5%) | 59 (56.2%) |
Disability Status by Sex by Age in Lublin
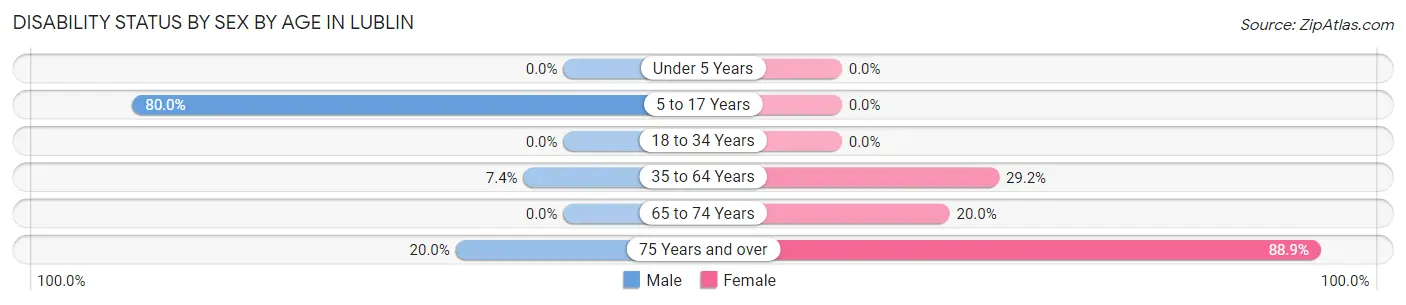
| Age Bracket | Male | Female |
| Under 5 Years | 0 (0.0%) | 0 (0.0%) |
| 5 to 17 Years | 4 (80.0%) | 0 (0.0%) |
| 18 to 34 Years | 0 (0.0%) | 0 (0.0%) |
| 35 to 64 Years | 2 (7.4%) | 7 (29.2%) |
| 65 to 74 Years | 0 (0.0%) | 2 (20.0%) |
| 75 Years and over | 1 (20.0%) | 8 (88.9%) |
Disability Class by Sex by Age in Lublin
Disability Class: Hearing Difficulty
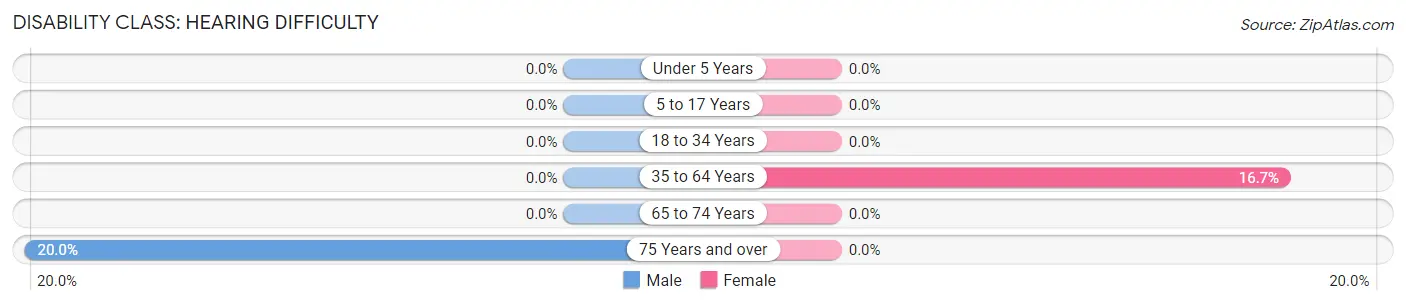
| Age Bracket | Male | Female |
| Under 5 Years | 0 (0.0%) | 0 (0.0%) |
| 5 to 17 Years | 0 (0.0%) | 0 (0.0%) |
| 18 to 34 Years | 0 (0.0%) | 0 (0.0%) |
| 35 to 64 Years | 0 (0.0%) | 4 (16.7%) |
| 65 to 74 Years | 0 (0.0%) | 0 (0.0%) |
| 75 Years and over | 1 (20.0%) | 0 (0.0%) |
Disability Class: Vision Difficulty
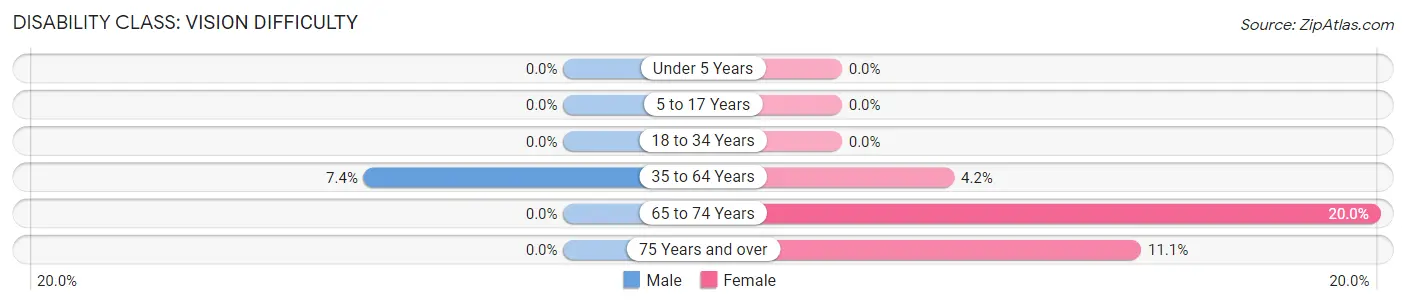
| Age Bracket | Male | Female |
| Under 5 Years | 0 (0.0%) | 0 (0.0%) |
| 5 to 17 Years | 0 (0.0%) | 0 (0.0%) |
| 18 to 34 Years | 0 (0.0%) | 0 (0.0%) |
| 35 to 64 Years | 2 (7.4%) | 1 (4.2%) |
| 65 to 74 Years | 0 (0.0%) | 2 (20.0%) |
| 75 Years and over | 0 (0.0%) | 1 (11.1%) |
Disability Class: Cognitive Difficulty
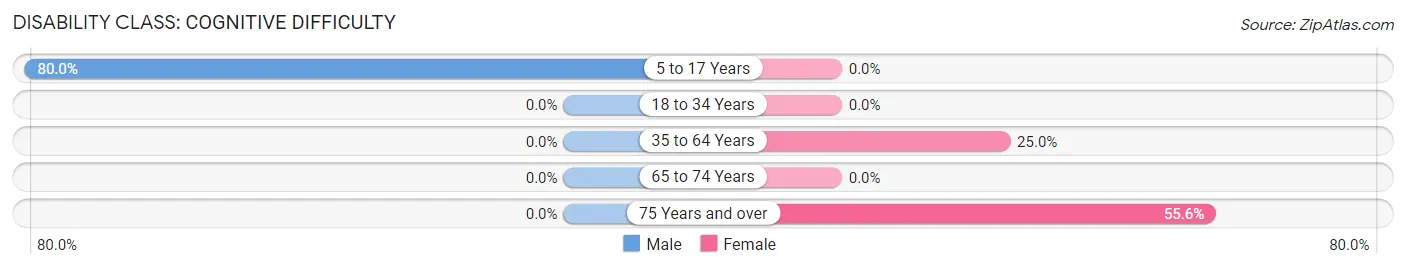
| Age Bracket | Male | Female |
| 5 to 17 Years | 4 (80.0%) | 0 (0.0%) |
| 18 to 34 Years | 0 (0.0%) | 0 (0.0%) |
| 35 to 64 Years | 0 (0.0%) | 6 (25.0%) |
| 65 to 74 Years | 0 (0.0%) | 0 (0.0%) |
| 75 Years and over | 0 (0.0%) | 5 (55.6%) |
Disability Class: Ambulatory Difficulty
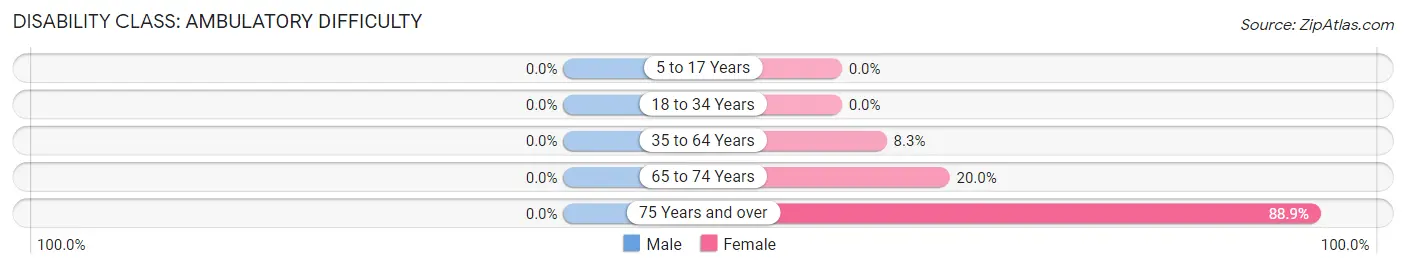
| Age Bracket | Male | Female |
| 5 to 17 Years | 0 (0.0%) | 0 (0.0%) |
| 18 to 34 Years | 0 (0.0%) | 0 (0.0%) |
| 35 to 64 Years | 0 (0.0%) | 2 (8.3%) |
| 65 to 74 Years | 0 (0.0%) | 2 (20.0%) |
| 75 Years and over | 0 (0.0%) | 8 (88.9%) |
Disability Class: Self-Care Difficulty
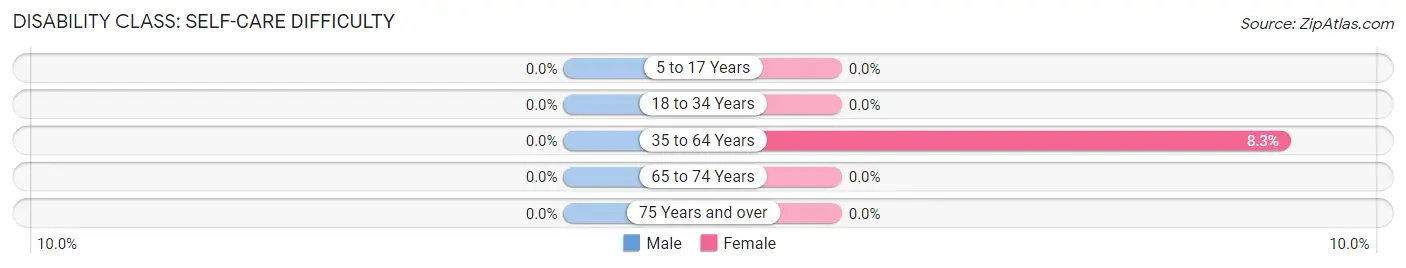
| Age Bracket | Male | Female |
| 5 to 17 Years | 0 (0.0%) | 0 (0.0%) |
| 18 to 34 Years | 0 (0.0%) | 0 (0.0%) |
| 35 to 64 Years | 0 (0.0%) | 2 (8.3%) |
| 65 to 74 Years | 0 (0.0%) | 0 (0.0%) |
| 75 Years and over | 0 (0.0%) | 0 (0.0%) |
Technology Access in Lublin
Computing Device Access in Lublin
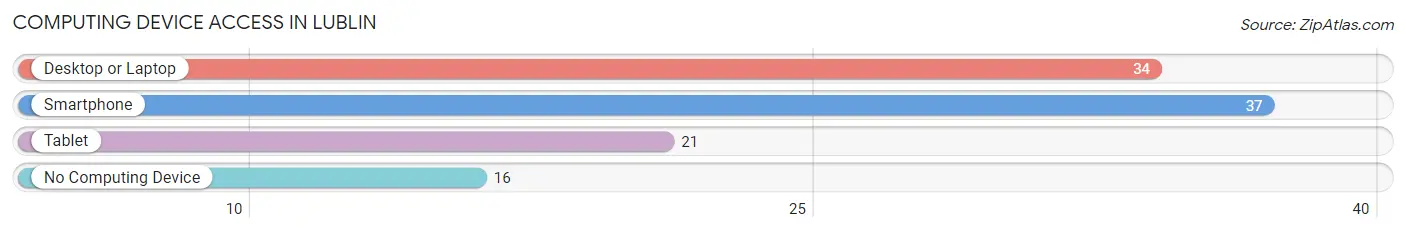
| Device Type | # Households | % Households |
| Desktop or Laptop | 34 | 54.8% |
| Smartphone | 37 | 59.7% |
| Tablet | 21 | 33.9% |
| No Computing Device | 16 | 25.8% |
| Total | 62 | 100.0% |
Internet Access in Lublin
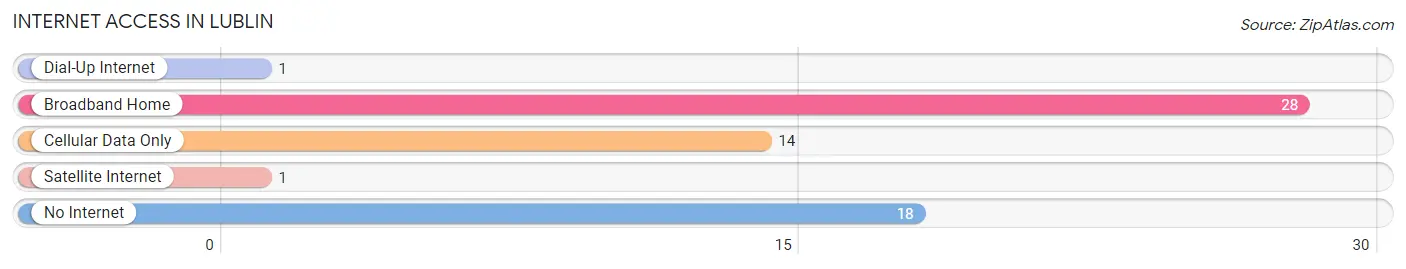
| Internet Type | # Households | % Households |
| Dial-Up Internet | 1 | 1.6% |
| Broadband Home | 28 | 45.2% |
| Cellular Data Only | 14 | 22.6% |
| Satellite Internet | 1 | 1.6% |
| No Internet | 18 | 29.0% |
| Total | 62 | 100.0% |
Lublin Summary
Lublin is a city located in the eastern part of Wisconsin, in the county of Dunn. It is situated on the banks of the Chippewa River, and is part of the Eau Claire metropolitan area. The city has a population of approximately 1,500 people, and is the county seat of Dunn County.
History
Lublin was founded in 1856 by a group of Polish immigrants who had come to the area in search of a better life. The city was named after the city of Lublin in Poland, and the settlers were primarily of Polish descent. The city was incorporated in 1872, and the first mayor was John Kowalski.
The city grew rapidly in the late 19th and early 20th centuries, and by the 1920s, it had become a major center for the lumber industry. The city was also home to a number of other industries, including a brickyard, a flour mill, and a cheese factory.
In the 1950s, the city began to decline as the lumber industry moved away and the population began to decline. The city was hit hard by the Great Recession of 2008, and the population has continued to decline since then.
Geography
Lublin is located in the eastern part of Wisconsin, in the county of Dunn. It is situated on the banks of the Chippewa River, and is part of the Eau Claire metropolitan area. The city has a total area of 1.3 square miles, all of which is land.
The city is located in a hilly region, and the terrain is mostly flat. The climate is humid continental, with cold winters and warm summers. The average annual temperature is around 40 degrees Fahrenheit.
Economy
The economy of Lublin is largely based on agriculture and tourism. The city is home to a number of farms, and the surrounding area is known for its dairy production. The city is also home to a number of small businesses, including restaurants, retail stores, and service providers.
The city is also home to a number of tourist attractions, including the Chippewa River State Park, the Dunn County Historical Museum, and the Lublin Historical Society. The city is also home to a number of festivals and events, including the Lublin Days Festival and the Lublin County Fair.
Demographics
As of the 2010 census, the population of Lublin was 1,500 people. The racial makeup of the city was 97.3% White, 0.7% African American, 0.3% Native American, 0.3% Asian, and 1.3% from other races. The median household income was $41,250, and the median family income was $50,000.
The city is home to a number of churches, including the St. Stanislaus Catholic Church, the First Presbyterian Church, and the First Lutheran Church. The city is also home to a number of schools, including the Lublin Elementary School, the Lublin Middle School, and the Lublin High School.
Common Questions
What is Per Capita Income in Lublin?
Per Capita income in Lublin is $38,410.
What is the Median Family Income in Lublin?
Median Family Income in Lublin is $75,833.
What is the Median Household income in Lublin?
Median Household Income in Lublin is $40,000.
What is Income or Wage Gap in Lublin?
Income or Wage Gap in Lublin is 53.0%.
Women in Lublin earn 47.0 cents for every dollar earned by a man.
What is Inequality or Gini Index in Lublin?
Inequality or Gini Index in Lublin is 0.52.
What is the Total Population of Lublin?
Total Population of Lublin is 105.
What is the Total Male Population of Lublin?
Total Male Population of Lublin is 53.
What is the Total Female Population of Lublin?
Total Female Population of Lublin is 52.
What is the Ratio of Males per 100 Females in Lublin?
There are 101.92 Males per 100 Females in Lublin.
What is the Ratio of Females per 100 Males in Lublin?
There are 98.11 Females per 100 Males in Lublin.
What is the Median Population Age in Lublin?
Median Population Age in Lublin is 56.5 Years.
What is the Average Family Size in Lublin
Average Family Size in Lublin is 2.7 People.
What is the Average Household Size in Lublin
Average Household Size in Lublin is 1.7 People.
How Large is the Labor Force in Lublin?
There are 57 People in the Labor Forcein in Lublin.
What is the Percentage of People in the Labor Force in Lublin?
58.8% of People are in the Labor Force in Lublin.