French Island, WI Map & Demographics
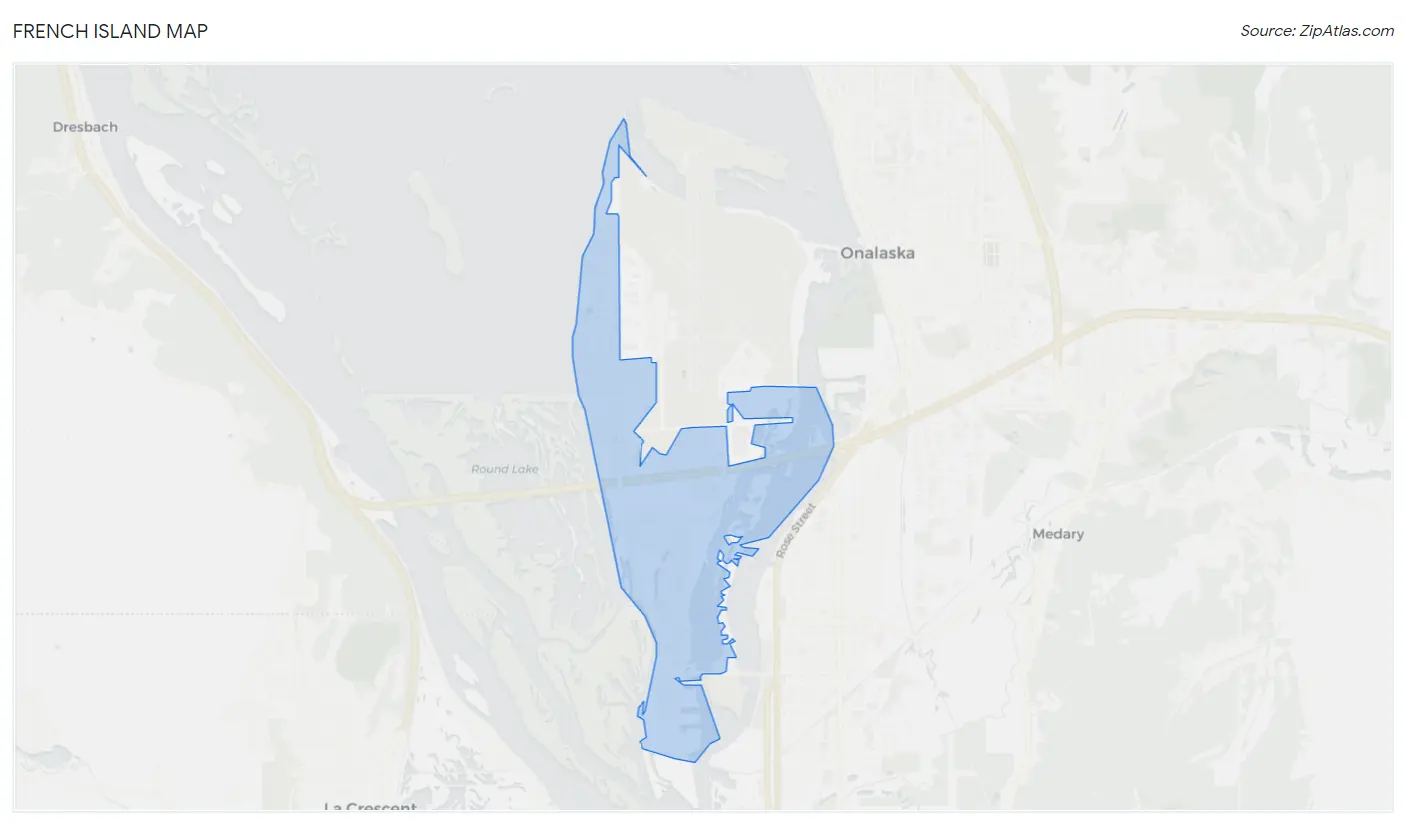
French Island Map
French Island Overview
$37,568
PER CAPITA INCOME
$71,991
AVG FAMILY INCOME
$59,574
AVG HOUSEHOLD INCOME
22.4%
WAGE / INCOME GAP [ % ]
77.6¢/ $1
WAGE / INCOME GAP [ $ ]
0.47
INEQUALITY / GINI INDEX
4,266
TOTAL POPULATION
2,071
MALE POPULATION
2,195
FEMALE POPULATION
94.35
MALES / 100 FEMALES
105.99
FEMALES / 100 MALES
44.6
MEDIAN AGE
2.5
AVG FAMILY SIZE
2.2
AVG HOUSEHOLD SIZE
2,375
LABOR FORCE [ PEOPLE ]
66.5%
PERCENT IN LABOR FORCE
6.4%
UNEMPLOYMENT RATE
Income in French Island
Income Overview in French Island
Per Capita Income in French Island is $37,568, while median incomes of families and households are $71,991 and $59,574 respectively.
| Characteristic | Number | Measure |
| Per Capita Income | 4,266 | $37,568 |
| Median Family Income | 1,263 | $71,991 |
| Mean Family Income | 1,263 | $104,186 |
| Median Household Income | 1,964 | $59,574 |
| Mean Household Income | 1,964 | $81,798 |
| Income Deficit | 1,263 | $0 |
| Wage / Income Gap (%) | 4,266 | 22.41% |
| Wage / Income Gap ($) | 4,266 | 77.59¢ per $1 |
| Gini / Inequality Index | 4,266 | 0.47 |
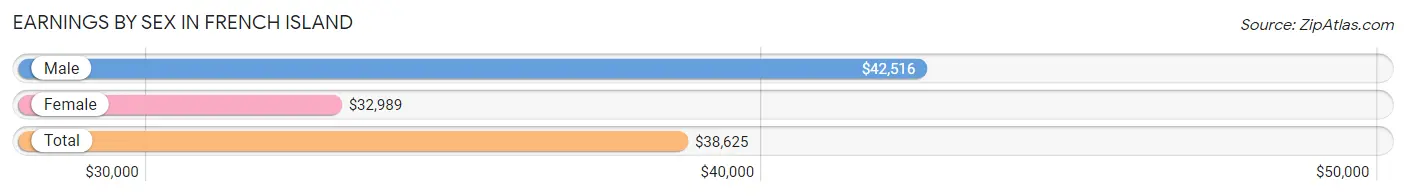
Earnings by Sex in French Island
Average Earnings in French Island are $38,625, $42,516 for men and $32,989 for women, a difference of 22.4%.
| Sex | Number | Average Earnings |
| Male | 1,268 (52.8%) | $42,516 |
| Female | 1,135 (47.2%) | $32,989 |
| Total | 2,403 (100.0%) | $38,625 |
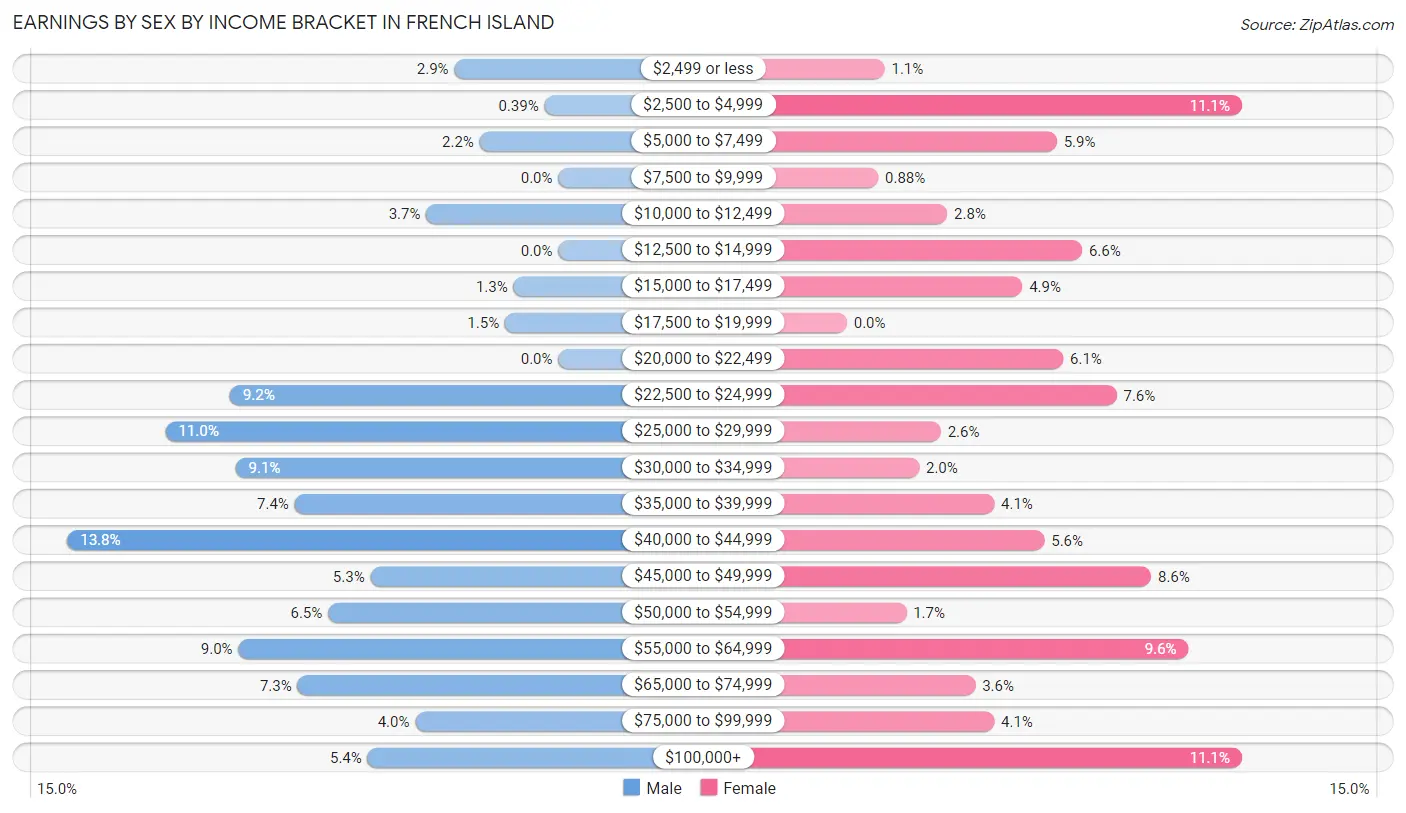
Earnings by Sex by Income Bracket in French Island
The most common earnings brackets in French Island are $40,000 to $44,999 for men (175 | 13.8%) and $2,500 to $4,999 for women (126 | 11.1%).
| Income | Male | Female |
| $2,499 or less | 37 (2.9%) | 12 (1.1%) |
| $2,500 to $4,999 | 5 (0.4%) | 126 (11.1%) |
| $5,000 to $7,499 | 28 (2.2%) | 67 (5.9%) |
| $7,500 to $9,999 | 0 (0.0%) | 10 (0.9%) |
| $10,000 to $12,499 | 47 (3.7%) | 32 (2.8%) |
| $12,500 to $14,999 | 0 (0.0%) | 75 (6.6%) |
| $15,000 to $17,499 | 16 (1.3%) | 56 (4.9%) |
| $17,500 to $19,999 | 19 (1.5%) | 0 (0.0%) |
| $20,000 to $22,499 | 0 (0.0%) | 69 (6.1%) |
| $22,500 to $24,999 | 117 (9.2%) | 86 (7.6%) |
| $25,000 to $29,999 | 140 (11.0%) | 30 (2.6%) |
| $30,000 to $34,999 | 115 (9.1%) | 23 (2.0%) |
| $35,000 to $39,999 | 94 (7.4%) | 47 (4.1%) |
| $40,000 to $44,999 | 175 (13.8%) | 63 (5.6%) |
| $45,000 to $49,999 | 67 (5.3%) | 97 (8.6%) |
| $50,000 to $54,999 | 82 (6.5%) | 19 (1.7%) |
| $55,000 to $64,999 | 114 (9.0%) | 109 (9.6%) |
| $65,000 to $74,999 | 93 (7.3%) | 41 (3.6%) |
| $75,000 to $99,999 | 51 (4.0%) | 47 (4.1%) |
| $100,000+ | 68 (5.4%) | 126 (11.1%) |
| Total | 1,268 (100.0%) | 1,135 (100.0%) |
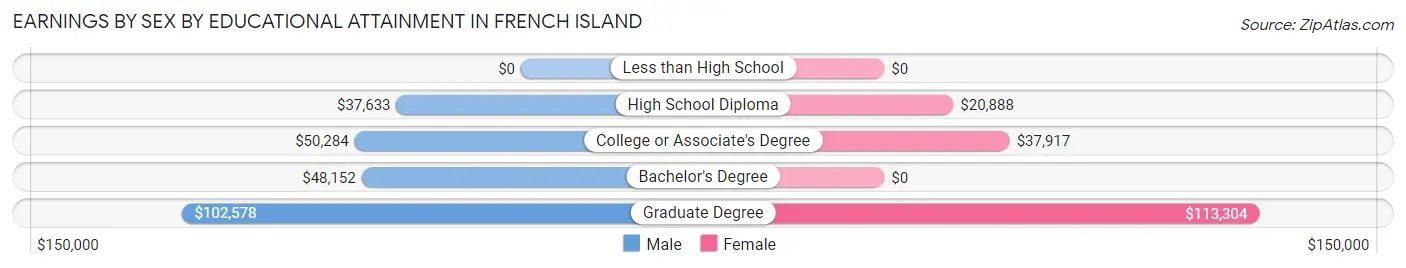
Earnings by Sex by Educational Attainment in French Island
Average earnings in French Island are $43,438 for men and $36,563 for women, a difference of 15.8%. Men with an educational attainment of graduate degree enjoy the highest average annual earnings of $102,578, while those with high school diploma education earn the least with $37,633. Women with an educational attainment of graduate degree earn the most with the average annual earnings of $113,304, while those with high school diploma education have the smallest earnings of $20,888.
| Educational Attainment | Male Income | Female Income |
| Less than High School | - | - |
| High School Diploma | $37,633 | $20,888 |
| College or Associate's Degree | $50,284 | $37,917 |
| Bachelor's Degree | $48,152 | $0 |
| Graduate Degree | $102,578 | $113,304 |
| Total | $43,438 | $36,563 |
Family Income in French Island
Family Income Brackets in French Island
According to the French Island family income data, there are 282 families falling into the $50,000 to $74,999 income range, which is the most common income bracket and makes up 22.3% of all families.
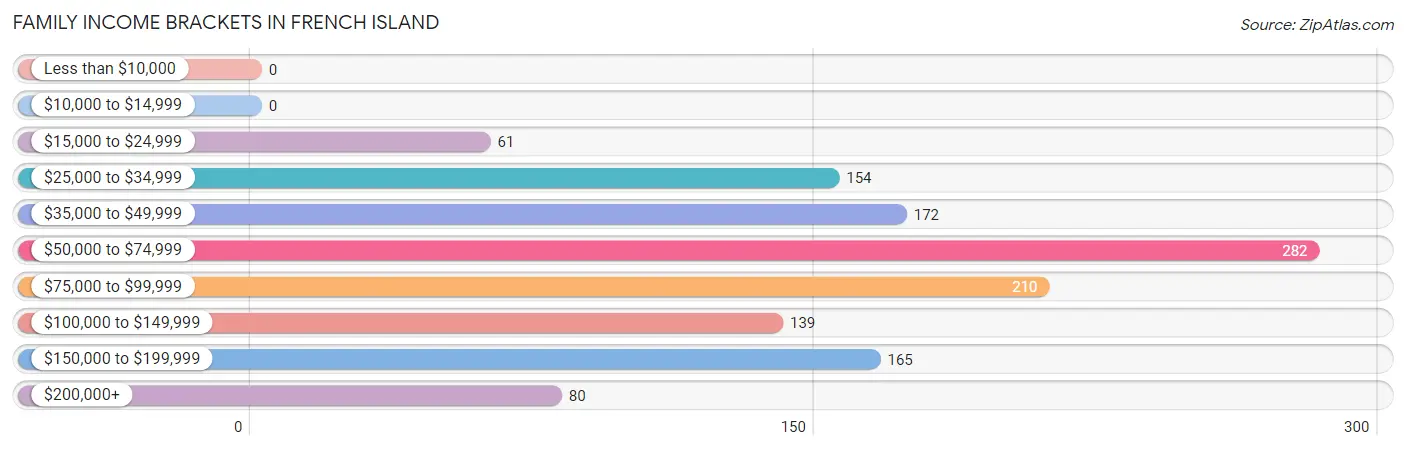
| Income Bracket | # Families | % Families |
| Less than $10,000 | 0 | 0.0% |
| $10,000 to $14,999 | 0 | 0.0% |
| $15,000 to $24,999 | 61 | 4.8% |
| $25,000 to $34,999 | 154 | 12.2% |
| $35,000 to $49,999 | 172 | 13.6% |
| $50,000 to $74,999 | 282 | 22.3% |
| $75,000 to $99,999 | 210 | 16.6% |
| $100,000 to $149,999 | 139 | 11.0% |
| $150,000 to $199,999 | 165 | 13.1% |
| $200,000+ | 80 | 6.3% |
Family Income by Famaliy Size in French Island
3-person families (222 | 17.6%) account for the highest median family income in French Island with $86,250 per family, while 2-person families (830 | 65.7%) have the highest median income of $37,732 per family member.
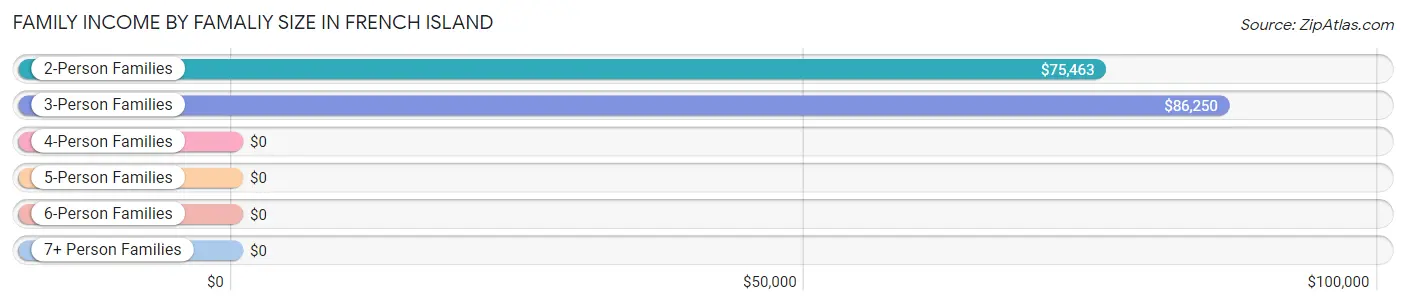
| Income Bracket | # Families | Median Income |
| 2-Person Families | 830 (65.7%) | $75,463 |
| 3-Person Families | 222 (17.6%) | $86,250 |
| 4-Person Families | 181 (14.3%) | $0 |
| 5-Person Families | 30 (2.4%) | $0 |
| 6-Person Families | 0 (0.0%) | $0 |
| 7+ Person Families | 0 (0.0%) | $0 |
| Total | 1,263 (100.0%) | $71,991 |
Family Income by Number of Earners in French Island
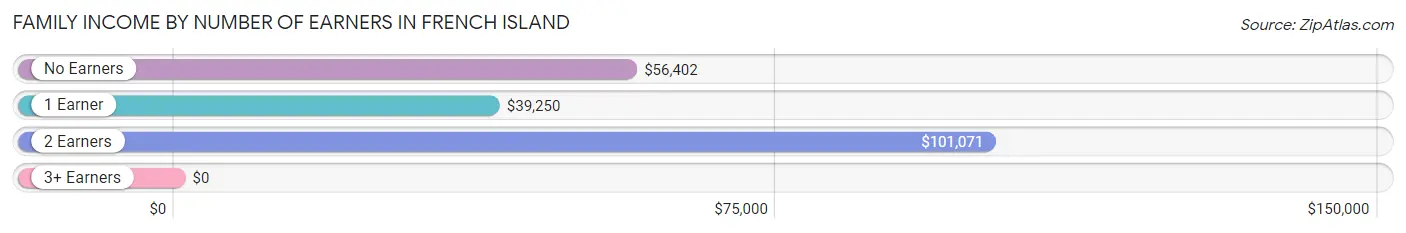
| Number of Earners | # Families | Median Income |
| No Earners | 209 (16.6%) | $56,402 |
| 1 Earner | 483 (38.2%) | $39,250 |
| 2 Earners | 540 (42.8%) | $101,071 |
| 3+ Earners | 31 (2.5%) | $0 |
| Total | 1,263 (100.0%) | $71,991 |
Household Income in French Island
Household Income Brackets in French Island
With 509 households falling in the category, the $50,000 to $74,999 income range is the most frequent in French Island, accounting for 25.9% of all households. In contrast, only 12 households (0.6%) fall into the $10,000 to $14,999 income bracket, making it the least populous group.
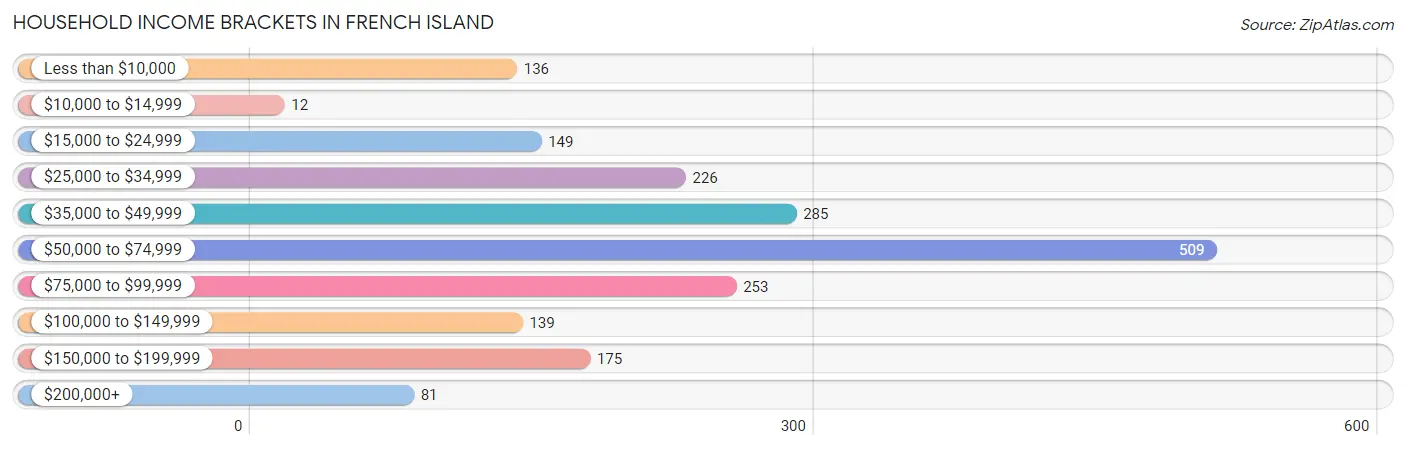
| Income Bracket | # Households | % Households |
| Less than $10,000 | 136 | 6.9% |
| $10,000 to $14,999 | 12 | 0.6% |
| $15,000 to $24,999 | 149 | 7.6% |
| $25,000 to $34,999 | 226 | 11.5% |
| $35,000 to $49,999 | 285 | 14.5% |
| $50,000 to $74,999 | 509 | 25.9% |
| $75,000 to $99,999 | 253 | 12.9% |
| $100,000 to $149,999 | 139 | 7.1% |
| $150,000 to $199,999 | 175 | 8.9% |
| $200,000+ | 81 | 4.1% |
Household Income by Householder Age in French Island
The median household income in French Island is $59,574, with the highest median household income of $72,083 found in the 45 to 64 years age bracket for the primary householder. A total of 742 households (37.8%) fall into this category. Meanwhile, the 15 to 24 years age bracket for the primary householder has the lowest median household income of $0, with 76 households (3.9%) in this group.
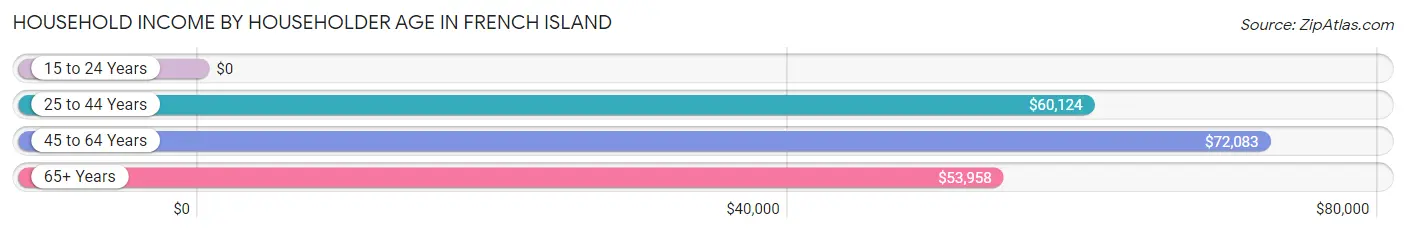
| Income Bracket | # Households | Median Income |
| 15 to 24 Years | 76 (3.9%) | $0 |
| 25 to 44 Years | 658 (33.5%) | $60,124 |
| 45 to 64 Years | 742 (37.8%) | $72,083 |
| 65+ Years | 488 (24.8%) | $53,958 |
| Total | 1,964 (100.0%) | $59,574 |
Poverty in French Island
Income Below Poverty by Sex and Age in French Island
With 9.5% poverty level for males and 15.9% for females among the residents of French Island, 18 to 24 year old males and 18 to 24 year old females are the most vulnerable to poverty, with 32 males (27.1%) and 45 females (58.4%) in their respective age groups living below the poverty level.
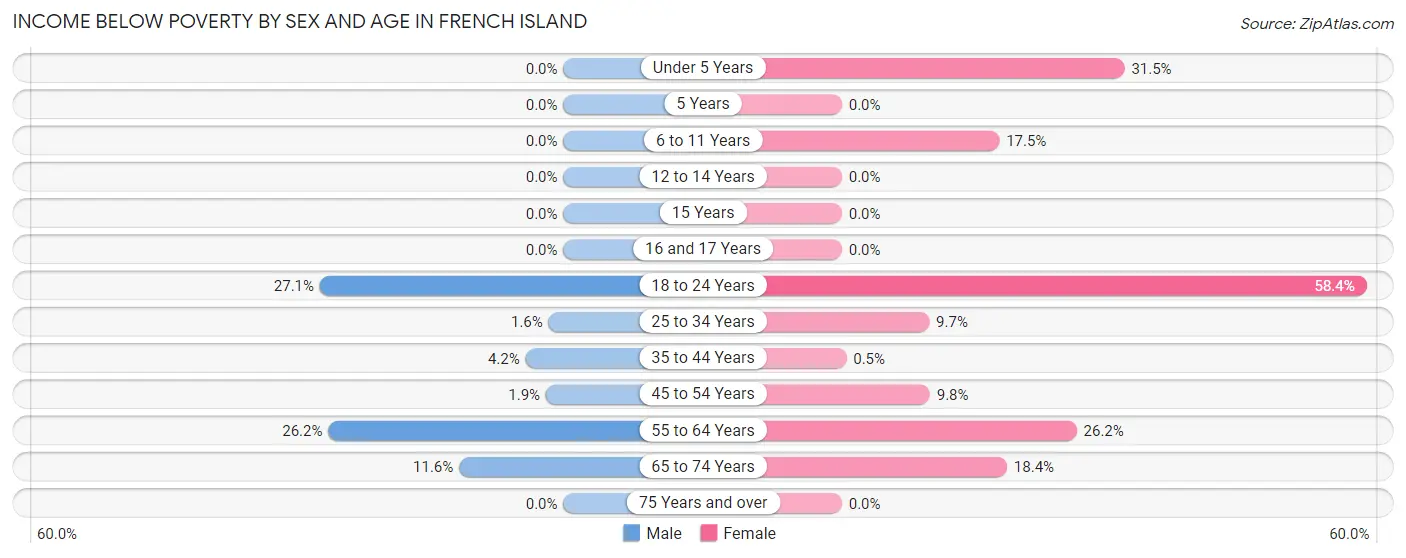
| Age Bracket | Male | Female |
| Under 5 Years | 0 (0.0%) | 34 (31.5%) |
| 5 Years | 0 (0.0%) | 0 (0.0%) |
| 6 to 11 Years | 0 (0.0%) | 44 (17.5%) |
| 12 to 14 Years | 0 (0.0%) | 0 (0.0%) |
| 15 Years | 0 (0.0%) | 0 (0.0%) |
| 16 and 17 Years | 0 (0.0%) | 0 (0.0%) |
| 18 to 24 Years | 32 (27.1%) | 45 (58.4%) |
| 25 to 34 Years | 5 (1.6%) | 43 (9.7%) |
| 35 to 44 Years | 13 (4.2%) | 1 (0.5%) |
| 45 to 54 Years | 6 (1.9%) | 15 (9.8%) |
| 55 to 64 Years | 105 (26.2%) | 119 (26.2%) |
| 65 to 74 Years | 36 (11.6%) | 48 (18.4%) |
| 75 Years and over | 0 (0.0%) | 0 (0.0%) |
| Total | 197 (9.5%) | 349 (15.9%) |
Income Above Poverty by Sex and Age in French Island
According to the poverty statistics in French Island, males aged under 5 years and females aged 5 years are the age groups that are most secure financially, with 100.0% of males and 100.0% of females in these age groups living above the poverty line.
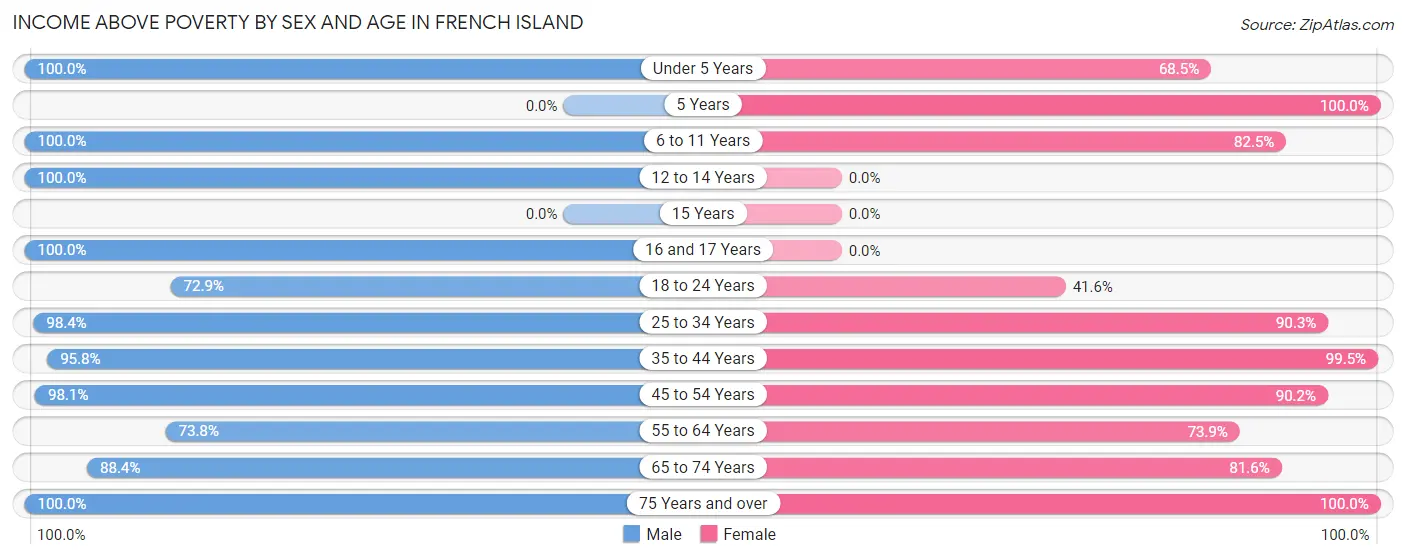
| Age Bracket | Male | Female |
| Under 5 Years | 157 (100.0%) | 74 (68.5%) |
| 5 Years | 0 (0.0%) | 148 (100.0%) |
| 6 to 11 Years | 15 (100.0%) | 207 (82.5%) |
| 12 to 14 Years | 14 (100.0%) | 0 (0.0%) |
| 15 Years | 0 (0.0%) | 0 (0.0%) |
| 16 and 17 Years | 16 (100.0%) | 0 (0.0%) |
| 18 to 24 Years | 86 (72.9%) | 32 (41.6%) |
| 25 to 34 Years | 299 (98.4%) | 399 (90.3%) |
| 35 to 44 Years | 296 (95.8%) | 198 (99.5%) |
| 45 to 54 Years | 304 (98.1%) | 138 (90.2%) |
| 55 to 64 Years | 296 (73.8%) | 336 (73.9%) |
| 65 to 74 Years | 274 (88.4%) | 213 (81.6%) |
| 75 Years and over | 117 (100.0%) | 99 (100.0%) |
| Total | 1,874 (90.5%) | 1,844 (84.1%) |
Income Below Poverty Among Married-Couple Families in French Island
The poverty statistics for married-couple families in French Island show that 1.6% or 16 of the total 990 families live below the poverty line. Families with no children have the highest poverty rate of 2.1%, comprising of 16 families. On the other hand, families with 1 or 2 children have the lowest poverty rate of 0.0%, which includes 0 families.
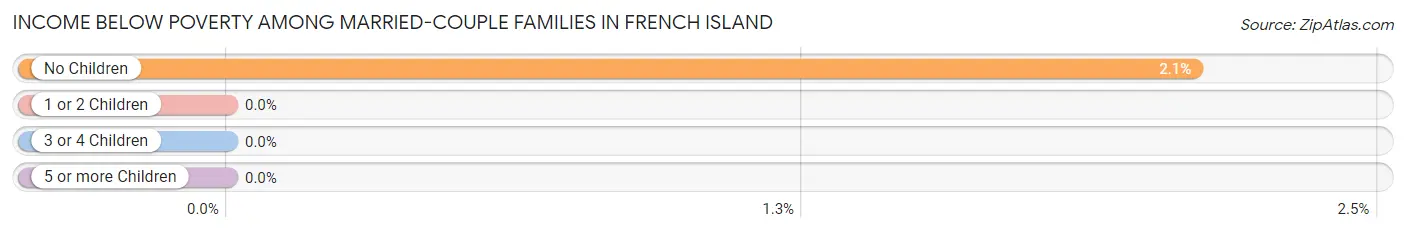
| Children | Above Poverty | Below Poverty |
| No Children | 745 (97.9%) | 16 (2.1%) |
| 1 or 2 Children | 199 (100.0%) | 0 (0.0%) |
| 3 or 4 Children | 30 (100.0%) | 0 (0.0%) |
| 5 or more Children | 0 (0.0%) | 0 (0.0%) |
| Total | 974 (98.4%) | 16 (1.6%) |
Income Below Poverty Among Single-Parent Households in French Island
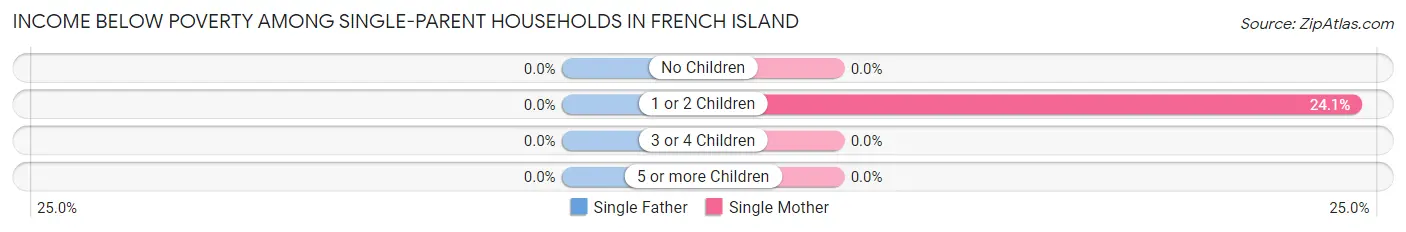
| Children | Single Father | Single Mother |
| No Children | 0 (0.0%) | 0 (0.0%) |
| 1 or 2 Children | 0 (0.0%) | 35 (24.1%) |
| 3 or 4 Children | 0 (0.0%) | 0 (0.0%) |
| 5 or more Children | 0 (0.0%) | 0 (0.0%) |
| Total | 0 (0.0%) | 35 (21.5%) |
Income Below Poverty Among Married-Couple vs Single-Parent Households in French Island
The poverty data for French Island shows that 16 of the married-couple family households (1.6%) and 35 of the single-parent households (12.8%) are living below the poverty level. Within the married-couple family households, those with no children have the highest poverty rate, with 16 households (2.1%) falling below the poverty line. Among the single-parent households, those with 1 or 2 children have the highest poverty rate, with 35 household (15.9%) living below poverty.
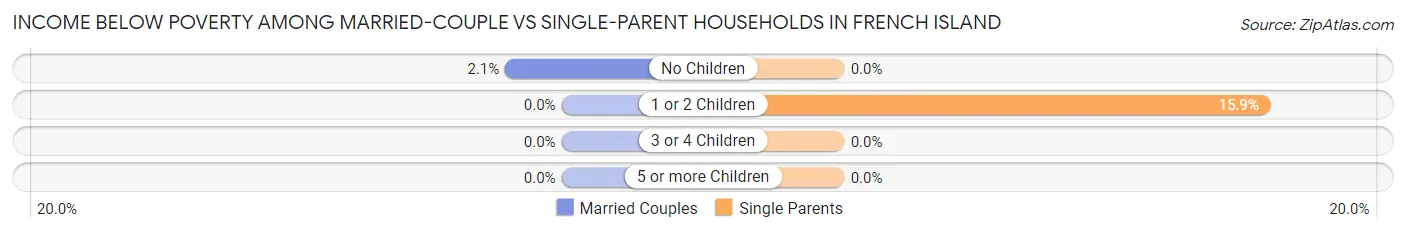
| Children | Married-Couple Families | Single-Parent Households |
| No Children | 16 (2.1%) | 0 (0.0%) |
| 1 or 2 Children | 0 (0.0%) | 35 (15.9%) |
| 3 or 4 Children | 0 (0.0%) | 0 (0.0%) |
| 5 or more Children | 0 (0.0%) | 0 (0.0%) |
| Total | 16 (1.6%) | 35 (12.8%) |
Race in French Island
The most populous races in French Island are White / Caucasian (3,962 | 92.9%), Two or more Races (157 | 3.7%), and Asian (86 | 2.0%).
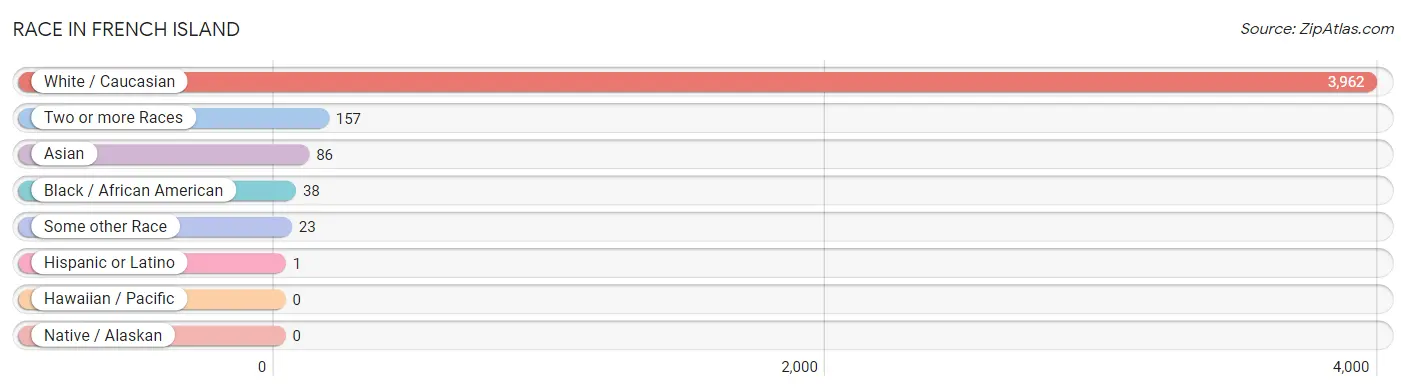
| Race | # Population | % Population |
| Asian | 86 | 2.0% |
| Black / African American | 38 | 0.9% |
| Hawaiian / Pacific | 0 | 0.0% |
| Hispanic or Latino | 1 | 0.0% |
| Native / Alaskan | 0 | 0.0% |
| White / Caucasian | 3,962 | 92.9% |
| Two or more Races | 157 | 3.7% |
| Some other Race | 23 | 0.5% |
| Total | 4,266 | 100.0% |
Ancestry in French Island
The most populous ancestries reported in French Island are German (1,922 | 45.1%), Irish (1,173 | 27.5%), Norwegian (748 | 17.5%), Polish (244 | 5.7%), and English (214 | 5.0%), together accounting for 100.8% of all French Island residents.
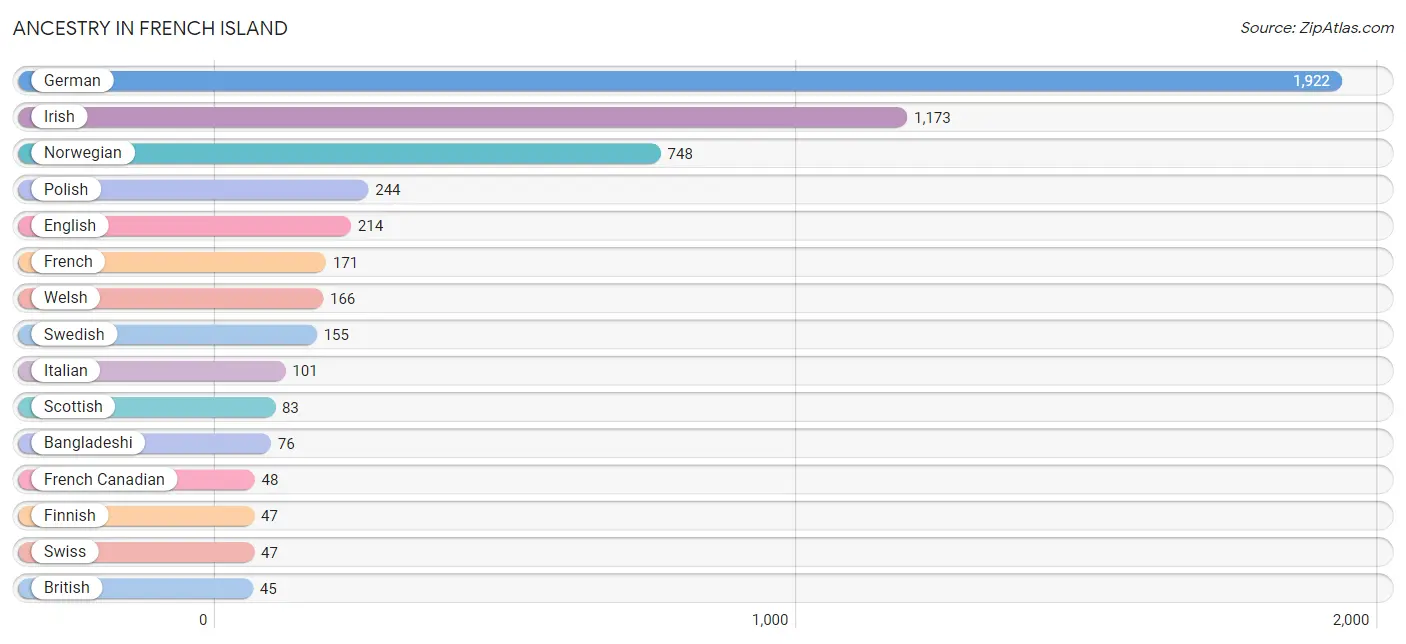
| Ancestry | # Population | % Population |
| American | 32 | 0.7% |
| Arab | 15 | 0.4% |
| Bangladeshi | 76 | 1.8% |
| Blackfeet | 1 | 0.0% |
| British | 45 | 1.1% |
| Cherokee | 1 | 0.0% |
| Czech | 14 | 0.3% |
| Czechoslovakian | 13 | 0.3% |
| Danish | 10 | 0.2% |
| English | 214 | 5.0% |
| European | 35 | 0.8% |
| Finnish | 47 | 1.1% |
| French | 171 | 4.0% |
| French Canadian | 48 | 1.1% |
| German | 1,922 | 45.1% |
| Indian (Asian) | 42 | 1.0% |
| Irish | 1,173 | 27.5% |
| Italian | 101 | 2.4% |
| Luxembourger | 13 | 0.3% |
| Moroccan | 15 | 0.4% |
| Norwegian | 748 | 17.5% |
| Polish | 244 | 5.7% |
| Scottish | 83 | 1.9% |
| Swedish | 155 | 3.6% |
| Swiss | 47 | 1.1% |
| Welsh | 166 | 3.9% | View All 26 Rows |
Immigrants in French Island
The most numerous immigrant groups reported in French Island came from Europe (116 | 2.7%), Northern Europe (94 | 2.2%), Asia (42 | 1.0%), China (42 | 1.0%), and Eastern Asia (42 | 1.0%), together accounting for 7.9% of all French Island residents.
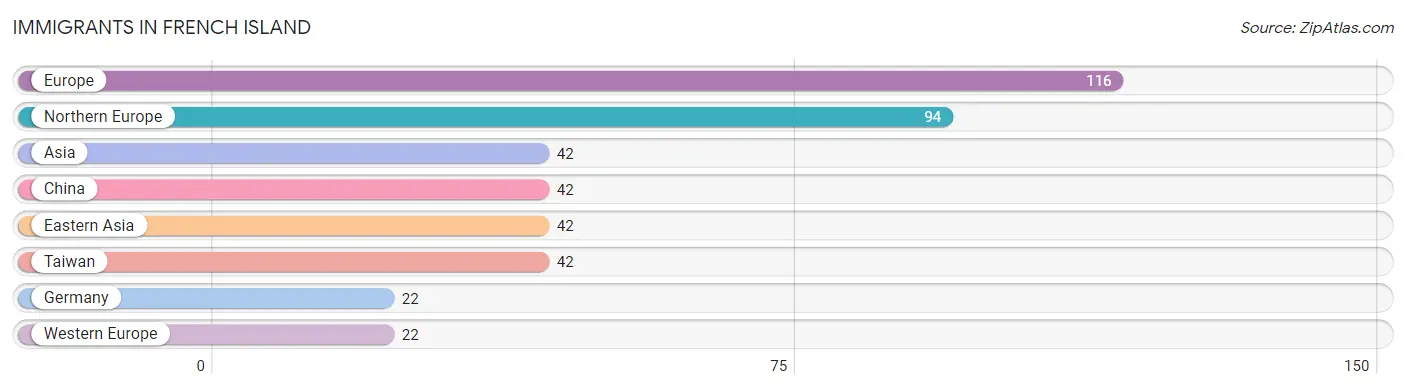
| Immigration Origin | # Population | % Population |
| Asia | 42 | 1.0% |
| China | 42 | 1.0% |
| Eastern Asia | 42 | 1.0% |
| Europe | 116 | 2.7% |
| Germany | 22 | 0.5% |
| Northern Europe | 94 | 2.2% |
| Taiwan | 42 | 1.0% |
| Western Europe | 22 | 0.5% | View All 8 Rows |
Sex and Age in French Island
Sex and Age in French Island
The most populous age groups in French Island are 55 to 59 Years (290 | 14.0%) for men and 5 to 9 Years (355 | 16.2%) for women.
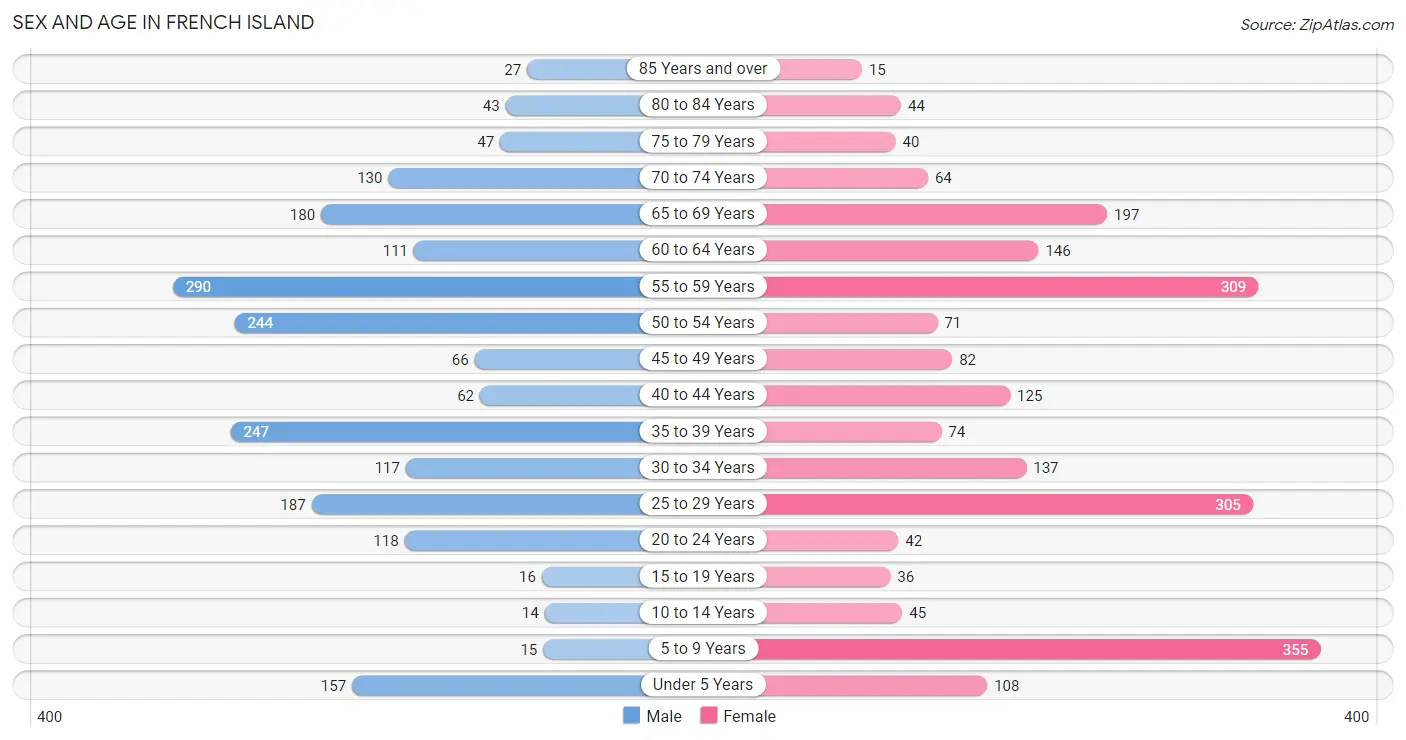
| Age Bracket | Male | Female |
| Under 5 Years | 157 (7.6%) | 108 (4.9%) |
| 5 to 9 Years | 15 (0.7%) | 355 (16.2%) |
| 10 to 14 Years | 14 (0.7%) | 45 (2.1%) |
| 15 to 19 Years | 16 (0.8%) | 36 (1.6%) |
| 20 to 24 Years | 118 (5.7%) | 42 (1.9%) |
| 25 to 29 Years | 187 (9.0%) | 305 (13.9%) |
| 30 to 34 Years | 117 (5.7%) | 137 (6.2%) |
| 35 to 39 Years | 247 (11.9%) | 74 (3.4%) |
| 40 to 44 Years | 62 (3.0%) | 125 (5.7%) |
| 45 to 49 Years | 66 (3.2%) | 82 (3.7%) |
| 50 to 54 Years | 244 (11.8%) | 71 (3.2%) |
| 55 to 59 Years | 290 (14.0%) | 309 (14.1%) |
| 60 to 64 Years | 111 (5.4%) | 146 (6.7%) |
| 65 to 69 Years | 180 (8.7%) | 197 (9.0%) |
| 70 to 74 Years | 130 (6.3%) | 64 (2.9%) |
| 75 to 79 Years | 47 (2.3%) | 40 (1.8%) |
| 80 to 84 Years | 43 (2.1%) | 44 (2.0%) |
| 85 Years and over | 27 (1.3%) | 15 (0.7%) |
| Total | 2,071 (100.0%) | 2,195 (100.0%) |
Families and Households in French Island
Median Family Size in French Island
The median family size in French Island is 2.54 persons per family, with single female/mother families (163 | 12.9%) accounting for the largest median family size of 2.6 persons per family. On the other hand, single male/father families (110 | 8.7%) represent the smallest median family size with 2.18 persons per family.
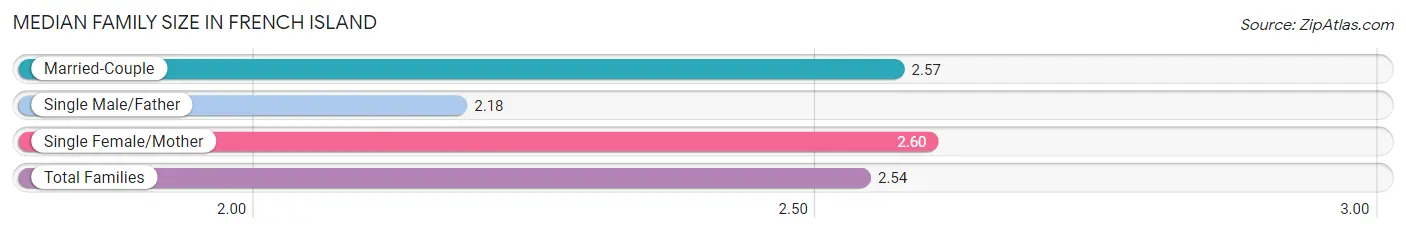
| Family Type | # Families | Family Size |
| Married-Couple | 990 (78.4%) | 2.57 |
| Single Male/Father | 110 (8.7%) | 2.18 |
| Single Female/Mother | 163 (12.9%) | 2.60 |
| Total Families | 1,263 (100.0%) | 2.54 |
Median Household Size in French Island
The median household size in French Island is 2.16 persons per household, with single female/mother households (163 | 8.3%) accounting for the largest median household size of 2.82 persons per household. non-family households (701 | 35.7%) represent the smallest median household size with 1.33 persons per household.
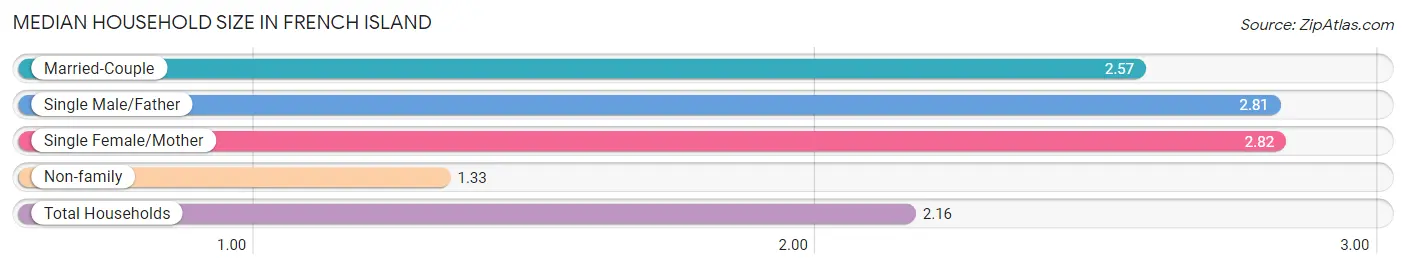
| Household Type | # Households | Household Size |
| Married-Couple | 990 (50.4%) | 2.57 |
| Single Male/Father | 110 (5.6%) | 2.81 |
| Single Female/Mother | 163 (8.3%) | 2.82 |
| Non-family | 701 (35.7%) | 1.33 |
| Total Households | 1,964 (100.0%) | 2.16 |
Household Size by Marriage Status in French Island
Out of a total of 1,964 households in French Island, 1,263 (64.3%) are family households, while 701 (35.7%) are nonfamily households. The most numerous type of family households are 2-person households, comprising 725, and the most common type of nonfamily households are 1-person households, comprising 436.
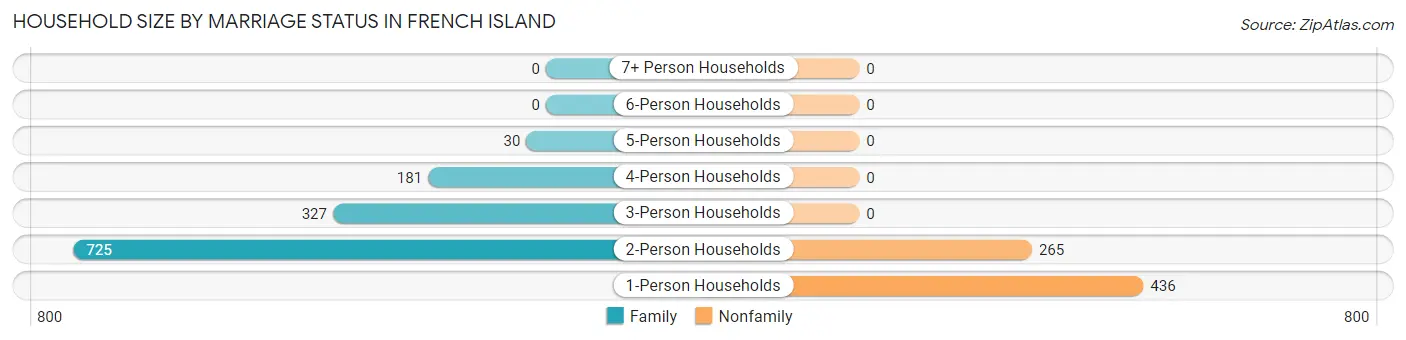
| Household Size | Family Households | Nonfamily Households |
| 1-Person Households | - | 436 (22.2%) |
| 2-Person Households | 725 (36.9%) | 265 (13.5%) |
| 3-Person Households | 327 (16.7%) | 0 (0.0%) |
| 4-Person Households | 181 (9.2%) | 0 (0.0%) |
| 5-Person Households | 30 (1.5%) | 0 (0.0%) |
| 6-Person Households | 0 (0.0%) | 0 (0.0%) |
| 7+ Person Households | 0 (0.0%) | 0 (0.0%) |
| Total | 1,263 (64.3%) | 701 (35.7%) |
Female Fertility in French Island
Fertility by Age in French Island
Average fertility rate in French Island is 89.0 births per 1,000 women. Women in the age bracket of 20 to 34 years have the highest fertility rate with 151.0 births per 1,000 women. Women in the age bracket of 20 to 34 years acount for 100.0% of all women with births.
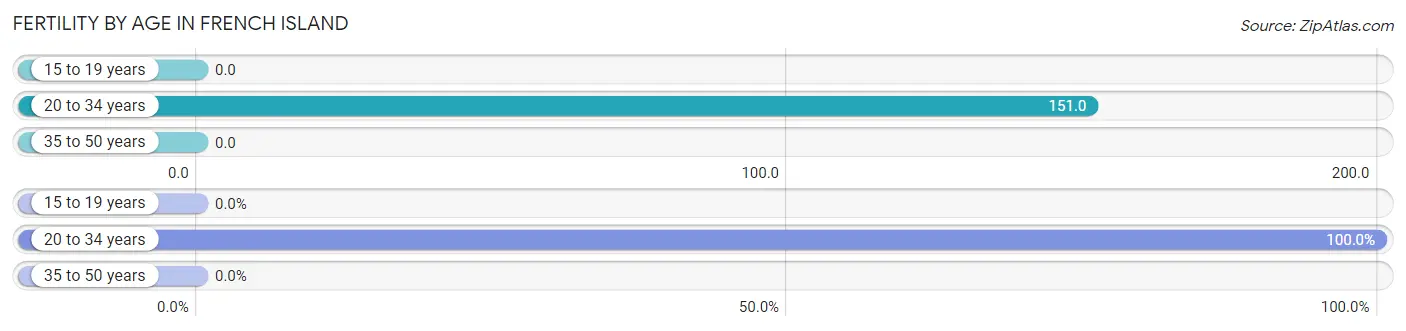
| Age Bracket | Women with Births | Births / 1,000 Women |
| 15 to 19 years | 0 (0.0%) | 0.0 |
| 20 to 34 years | 73 (100.0%) | 151.0 |
| 35 to 50 years | 0 (0.0%) | 0.0 |
| Total | 73 (100.0%) | 89.0 |
Fertility by Age by Marriage Status in French Island
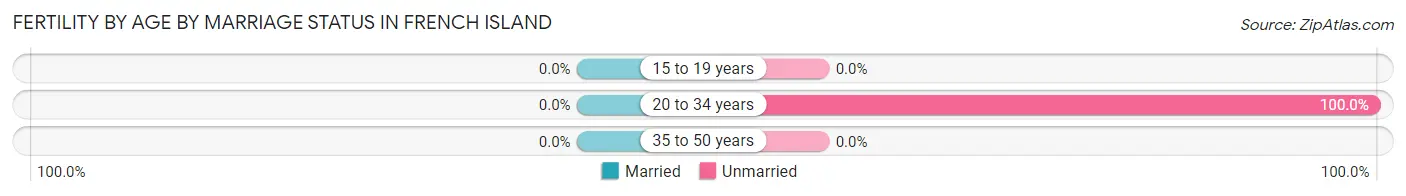
| Age Bracket | Married | Unmarried |
| 15 to 19 years | 0 (0.0%) | 0 (0.0%) |
| 20 to 34 years | 0 (0.0%) | 73 (100.0%) |
| 35 to 50 years | 0 (0.0%) | 0 (0.0%) |
| Total | 0 (0.0%) | 73 (100.0%) |
Fertility by Education in French Island
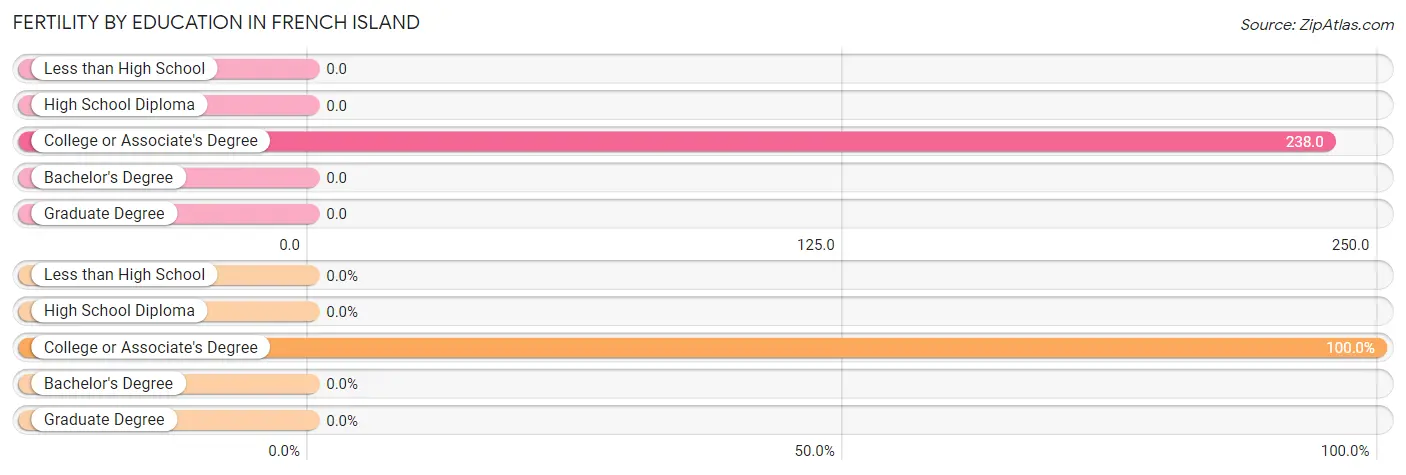
| Educational Attainment | Women with Births | Births / 1,000 Women |
| Less than High School | 0 (0.0%) | 0.0 |
| High School Diploma | 0 (0.0%) | 0.0 |
| College or Associate's Degree | 73 (100.0%) | 238.0 |
| Bachelor's Degree | 0 (0.0%) | 0.0 |
| Graduate Degree | 0 (0.0%) | 0.0 |
| Total | 73 (100.0%) | 89.0 |
Fertility by Education by Marriage Status in French Island
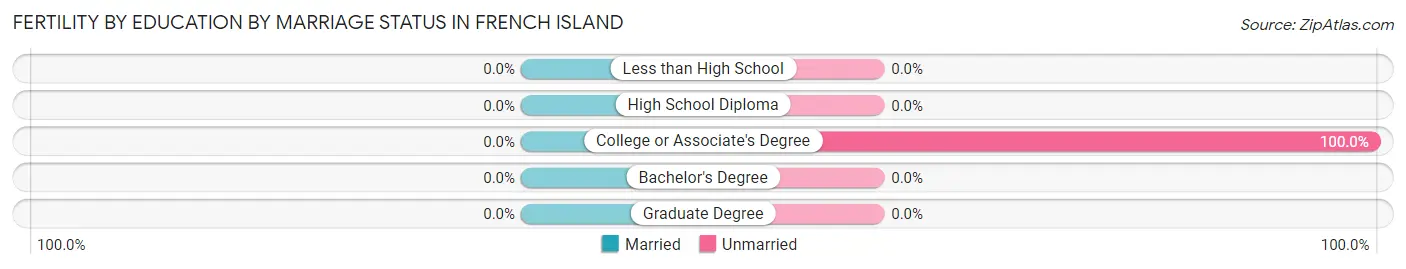
| Educational Attainment | Married | Unmarried |
| Less than High School | 0 (0.0%) | 0 (0.0%) |
| High School Diploma | 0 (0.0%) | 0 (0.0%) |
| College or Associate's Degree | 0 (0.0%) | 73 (100.0%) |
| Bachelor's Degree | 0 (0.0%) | 0 (0.0%) |
| Graduate Degree | 0 (0.0%) | 0 (0.0%) |
| Total | 0 (0.0%) | 73 (100.0%) |
Employment Characteristics in French Island
Employment by Class of Employer in French Island
Among the 2,224 employed individuals in French Island, private company employees (1,674 | 75.3%), not-for-profit organizations (213 | 9.6%), and self-employed (not incorporated) (121 | 5.4%) make up the most common classes of employment.
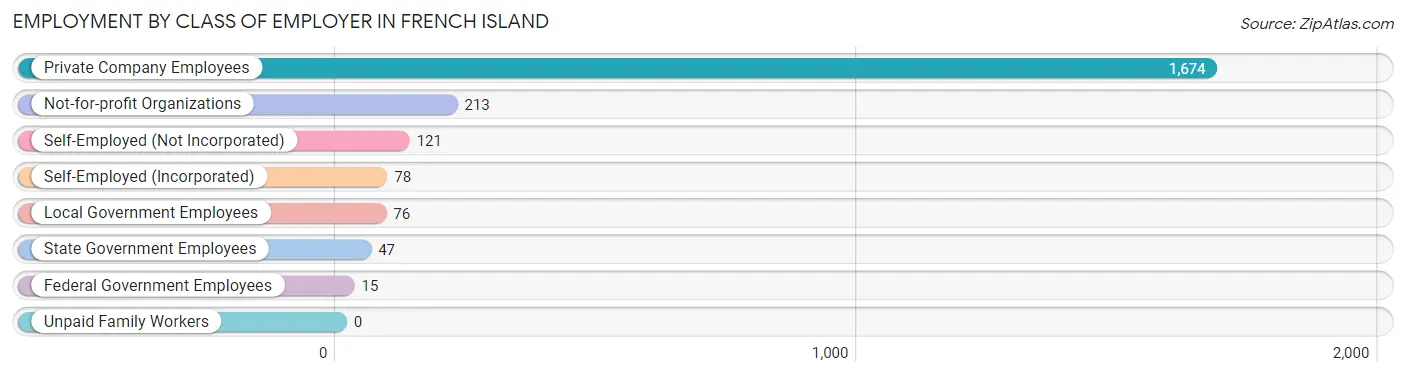
| Employer Class | # Employees | % Employees |
| Private Company Employees | 1,674 | 75.3% |
| Self-Employed (Incorporated) | 78 | 3.5% |
| Self-Employed (Not Incorporated) | 121 | 5.4% |
| Not-for-profit Organizations | 213 | 9.6% |
| Local Government Employees | 76 | 3.4% |
| State Government Employees | 47 | 2.1% |
| Federal Government Employees | 15 | 0.7% |
| Unpaid Family Workers | 0 | 0.0% |
| Total | 2,224 | 100.0% |
Employment Status by Age in French Island
According to the labor force statistics for French Island, out of the total population over 16 years of age (3,571), 66.5% or 2,375 individuals are in the labor force, with 6.4% or 152 of them unemployed. The age group with the highest labor force participation rate is 20 to 24 years, with 100.0% or 160 individuals in the labor force. Within the labor force, the 55 to 59 years age range has the highest percentage of unemployed individuals, with 21.5% or 105 of them being unemployed.
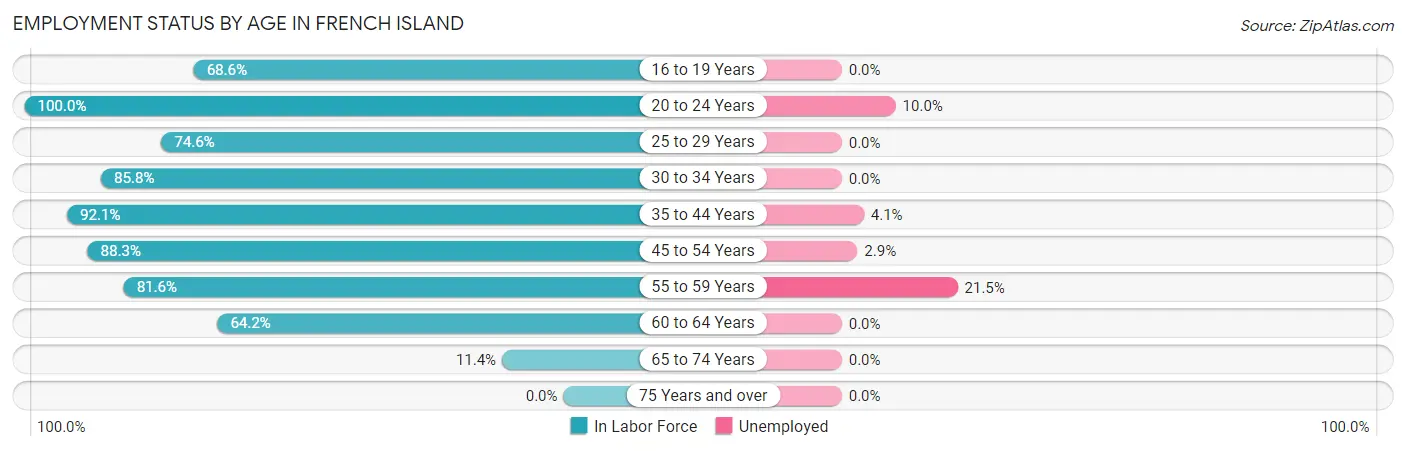
| Age Bracket | In Labor Force | Unemployed |
| 16 to 19 Years | 35 (68.6%) | 0 (0.0%) |
| 20 to 24 Years | 160 (100.0%) | 16 (10.0%) |
| 25 to 29 Years | 367 (74.6%) | 0 (0.0%) |
| 30 to 34 Years | 218 (85.8%) | 0 (0.0%) |
| 35 to 44 Years | 468 (92.1%) | 19 (4.1%) |
| 45 to 54 Years | 409 (88.3%) | 12 (2.9%) |
| 55 to 59 Years | 489 (81.6%) | 105 (21.5%) |
| 60 to 64 Years | 165 (64.2%) | 0 (0.0%) |
| 65 to 74 Years | 65 (11.4%) | 0 (0.0%) |
| 75 Years and over | 0 (0.0%) | 0 (0.0%) |
| Total | 2,375 (66.5%) | 152 (6.4%) |
Employment Status by Educational Attainment in French Island
According to labor force statistics for French Island, 82.2% of individuals (2,115) out of the total population between 25 and 64 years of age (2,573) are in the labor force, with 6.4% or 135 of them being unemployed. The group with the highest labor force participation rate are those with the educational attainment of less than high school, with 100.0% or 32 individuals in the labor force. Within the labor force, individuals with high school diploma education have the highest percentage of unemployment, with 10.7% or 88 of them being unemployed.
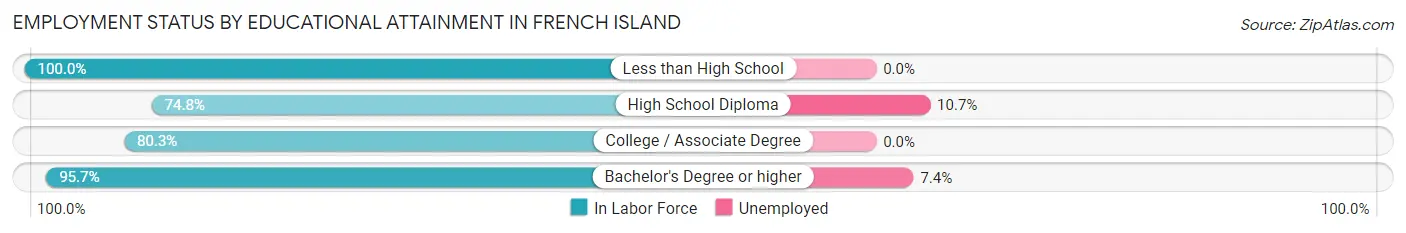
| Educational Attainment | In Labor Force | Unemployed |
| Less than High School | 32 (100.0%) | 0 (0.0%) |
| High School Diploma | 821 (74.8%) | 117 (10.7%) |
| College / Associate Degree | 615 (80.3%) | 0 (0.0%) |
| Bachelor's Degree or higher | 648 (95.7%) | 50 (7.4%) |
| Total | 2,115 (82.2%) | 165 (6.4%) |
Employment Occupations by Sex in French Island
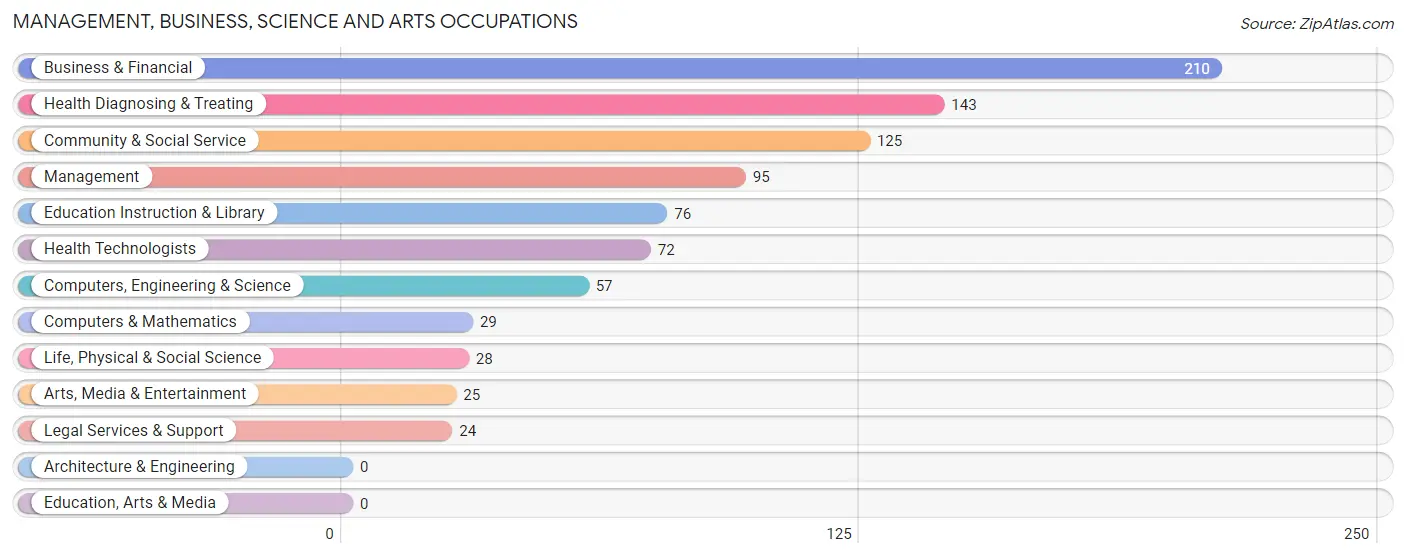
Management, Business, Science and Arts Occupations
The most common Management, Business, Science and Arts occupations in French Island are Business & Financial (210 | 9.4%), Health Diagnosing & Treating (143 | 6.4%), Community & Social Service (125 | 5.6%), Management (95 | 4.3%), and Education Instruction & Library (76 | 3.4%).
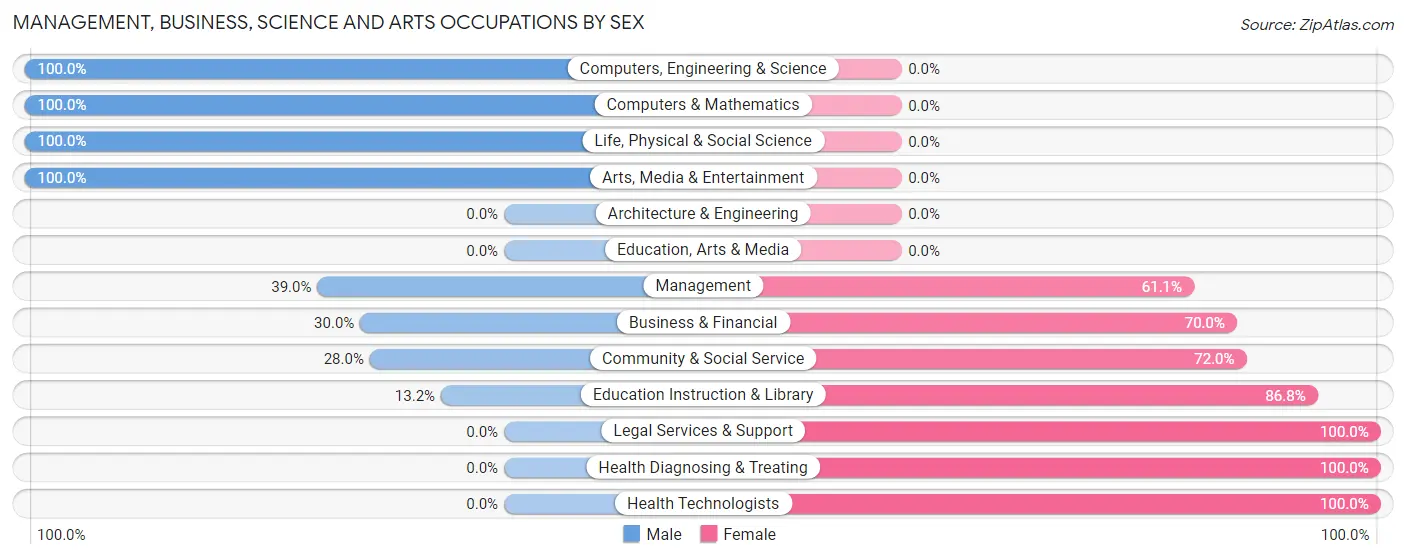
Management, Business, Science and Arts Occupations by Sex
Within the Management, Business, Science and Arts occupations in French Island, the most male-oriented occupations are Computers, Engineering & Science (100.0%), Computers & Mathematics (100.0%), and Life, Physical & Social Science (100.0%), while the most female-oriented occupations are Legal Services & Support (100.0%), Health Diagnosing & Treating (100.0%), and Health Technologists (100.0%).
| Occupation | Male | Female |
| Management | 37 (39.0%) | 58 (61.1%) |
| Business & Financial | 63 (30.0%) | 147 (70.0%) |
| Computers, Engineering & Science | 57 (100.0%) | 0 (0.0%) |
| Computers & Mathematics | 29 (100.0%) | 0 (0.0%) |
| Architecture & Engineering | 0 (0.0%) | 0 (0.0%) |
| Life, Physical & Social Science | 28 (100.0%) | 0 (0.0%) |
| Community & Social Service | 35 (28.0%) | 90 (72.0%) |
| Education, Arts & Media | 0 (0.0%) | 0 (0.0%) |
| Legal Services & Support | 0 (0.0%) | 24 (100.0%) |
| Education Instruction & Library | 10 (13.2%) | 66 (86.8%) |
| Arts, Media & Entertainment | 25 (100.0%) | 0 (0.0%) |
| Health Diagnosing & Treating | 0 (0.0%) | 143 (100.0%) |
| Health Technologists | 0 (0.0%) | 72 (100.0%) |
| Total (Category) | 192 (30.5%) | 438 (69.5%) |
| Total (Overall) | 1,131 (50.8%) | 1,093 (49.1%) |
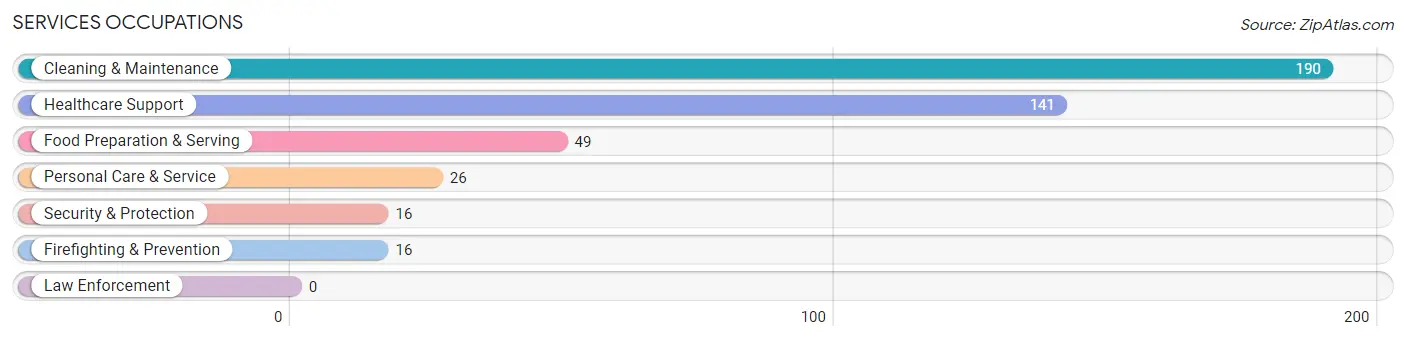
Services Occupations
The most common Services occupations in French Island are Cleaning & Maintenance (190 | 8.5%), Healthcare Support (141 | 6.3%), Food Preparation & Serving (49 | 2.2%), Personal Care & Service (26 | 1.2%), and Security & Protection (16 | 0.7%).
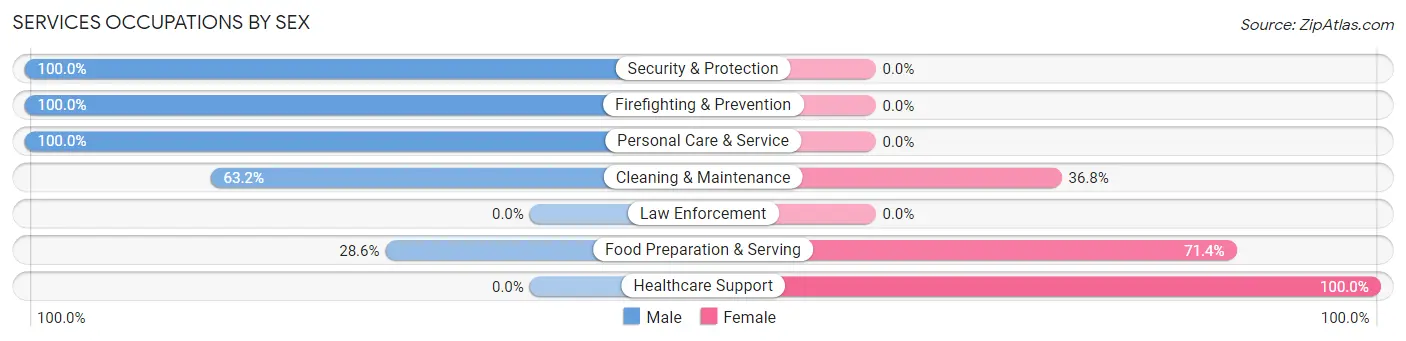
Services Occupations by Sex
Within the Services occupations in French Island, the most male-oriented occupations are Security & Protection (100.0%), Firefighting & Prevention (100.0%), and Personal Care & Service (100.0%), while the most female-oriented occupations are Healthcare Support (100.0%), Food Preparation & Serving (71.4%), and Cleaning & Maintenance (36.8%).
| Occupation | Male | Female |
| Healthcare Support | 0 (0.0%) | 141 (100.0%) |
| Security & Protection | 16 (100.0%) | 0 (0.0%) |
| Firefighting & Prevention | 16 (100.0%) | 0 (0.0%) |
| Law Enforcement | 0 (0.0%) | 0 (0.0%) |
| Food Preparation & Serving | 14 (28.6%) | 35 (71.4%) |
| Cleaning & Maintenance | 120 (63.2%) | 70 (36.8%) |
| Personal Care & Service | 26 (100.0%) | 0 (0.0%) |
| Total (Category) | 176 (41.7%) | 246 (58.3%) |
| Total (Overall) | 1,131 (50.8%) | 1,093 (49.1%) |
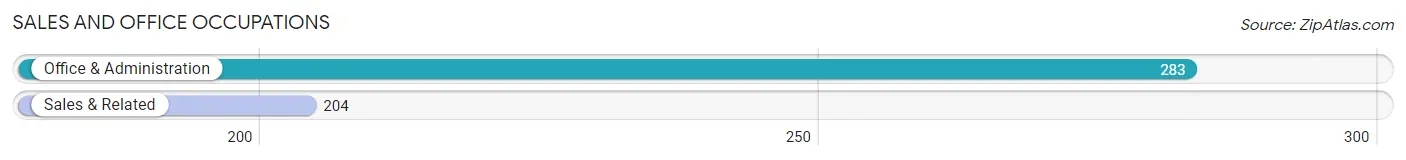
Sales and Office Occupations
The most common Sales and Office occupations in French Island are Office & Administration (283 | 12.7%), and Sales & Related (204 | 9.2%).
Sales and Office Occupations by Sex
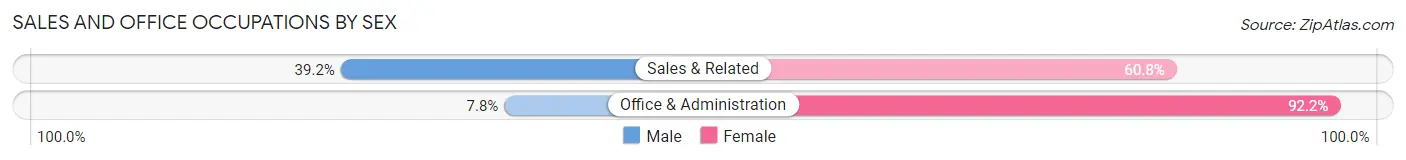
| Occupation | Male | Female |
| Sales & Related | 80 (39.2%) | 124 (60.8%) |
| Office & Administration | 22 (7.8%) | 261 (92.2%) |
| Total (Category) | 102 (20.9%) | 385 (79.1%) |
| Total (Overall) | 1,131 (50.8%) | 1,093 (49.1%) |
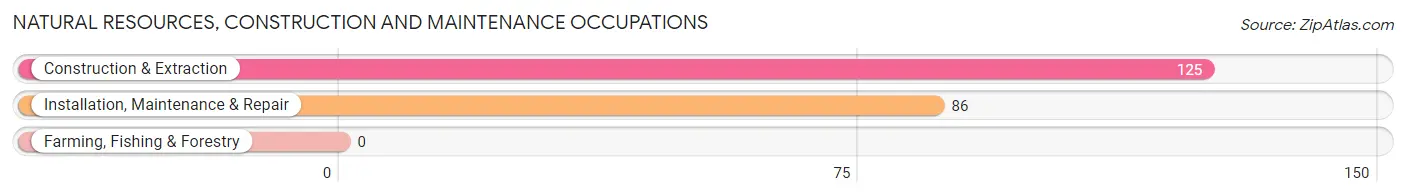
Natural Resources, Construction and Maintenance Occupations
The most common Natural Resources, Construction and Maintenance occupations in French Island are Construction & Extraction (125 | 5.6%), and Installation, Maintenance & Repair (86 | 3.9%).
Natural Resources, Construction and Maintenance Occupations by Sex
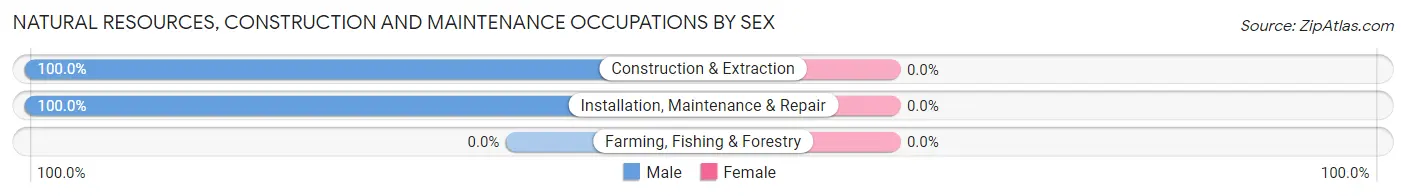
| Occupation | Male | Female |
| Farming, Fishing & Forestry | 0 (0.0%) | 0 (0.0%) |
| Construction & Extraction | 125 (100.0%) | 0 (0.0%) |
| Installation, Maintenance & Repair | 86 (100.0%) | 0 (0.0%) |
| Total (Category) | 211 (100.0%) | 0 (0.0%) |
| Total (Overall) | 1,131 (50.8%) | 1,093 (49.1%) |
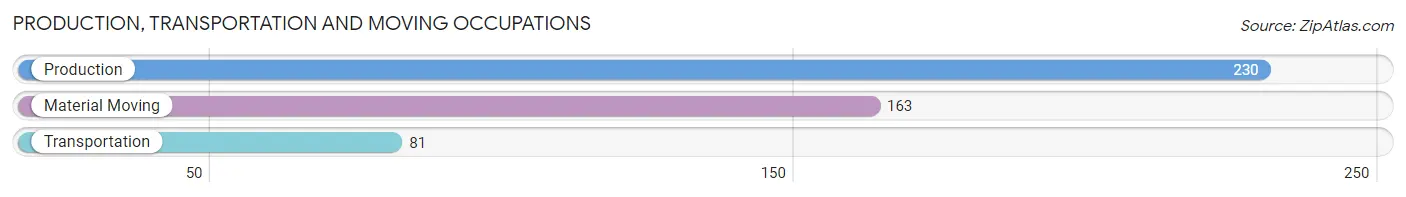
Production, Transportation and Moving Occupations
The most common Production, Transportation and Moving occupations in French Island are Production (230 | 10.3%), Material Moving (163 | 7.3%), and Transportation (81 | 3.6%).
Production, Transportation and Moving Occupations by Sex
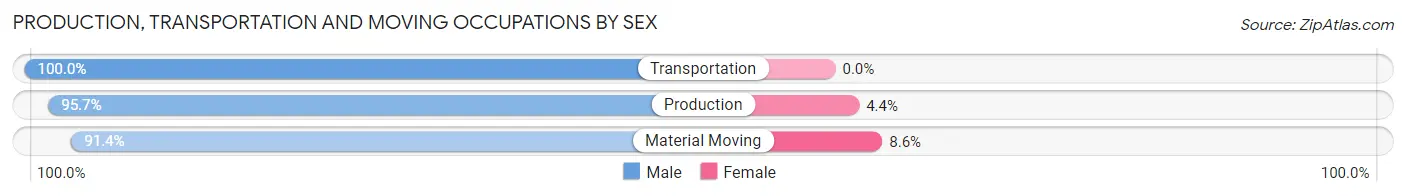
| Occupation | Male | Female |
| Production | 220 (95.7%) | 10 (4.3%) |
| Transportation | 81 (100.0%) | 0 (0.0%) |
| Material Moving | 149 (91.4%) | 14 (8.6%) |
| Total (Category) | 450 (94.9%) | 24 (5.1%) |
| Total (Overall) | 1,131 (50.8%) | 1,093 (49.1%) |
Employment Industries by Sex in French Island
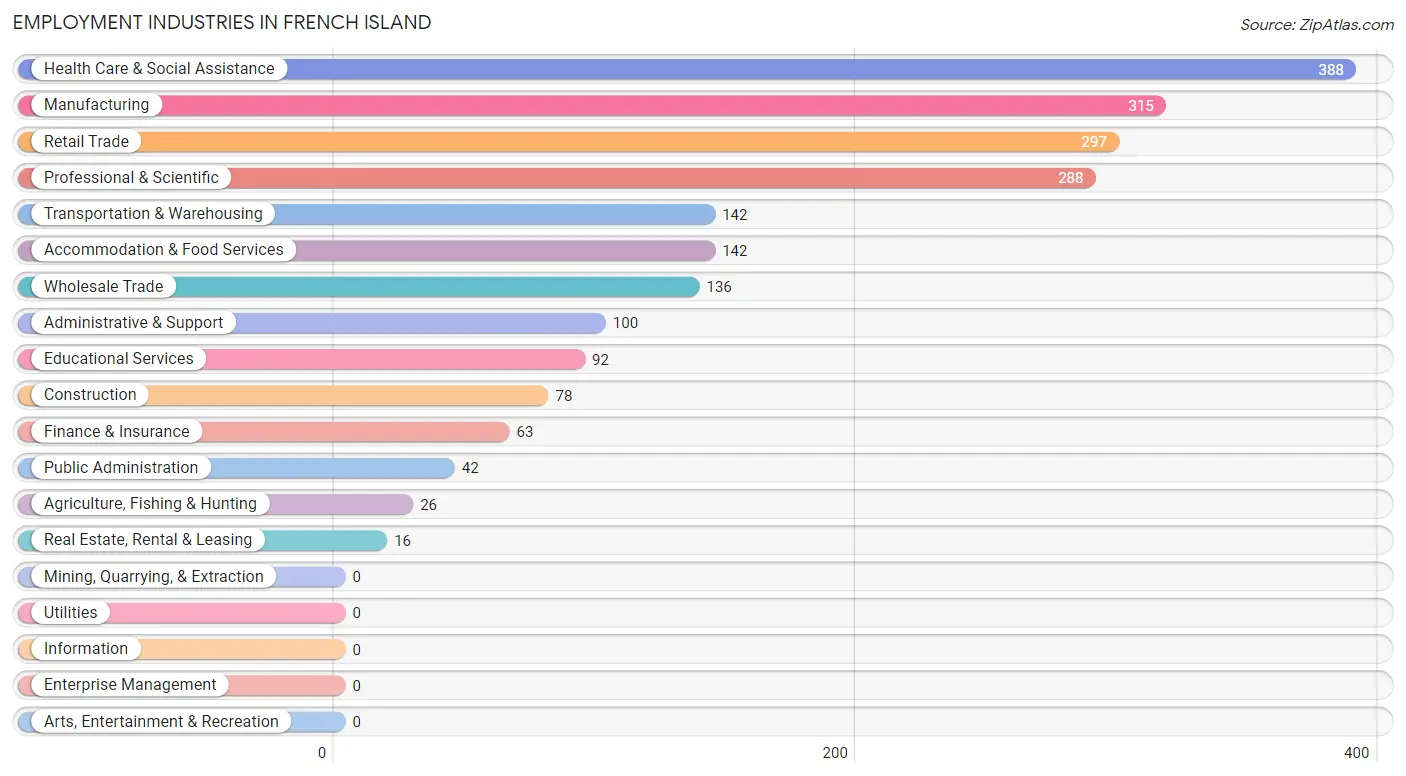
Employment Industries in French Island
The major employment industries in French Island include Health Care & Social Assistance (388 | 17.4%), Manufacturing (315 | 14.2%), Retail Trade (297 | 13.4%), Professional & Scientific (288 | 13.0%), and Transportation & Warehousing (142 | 6.4%).
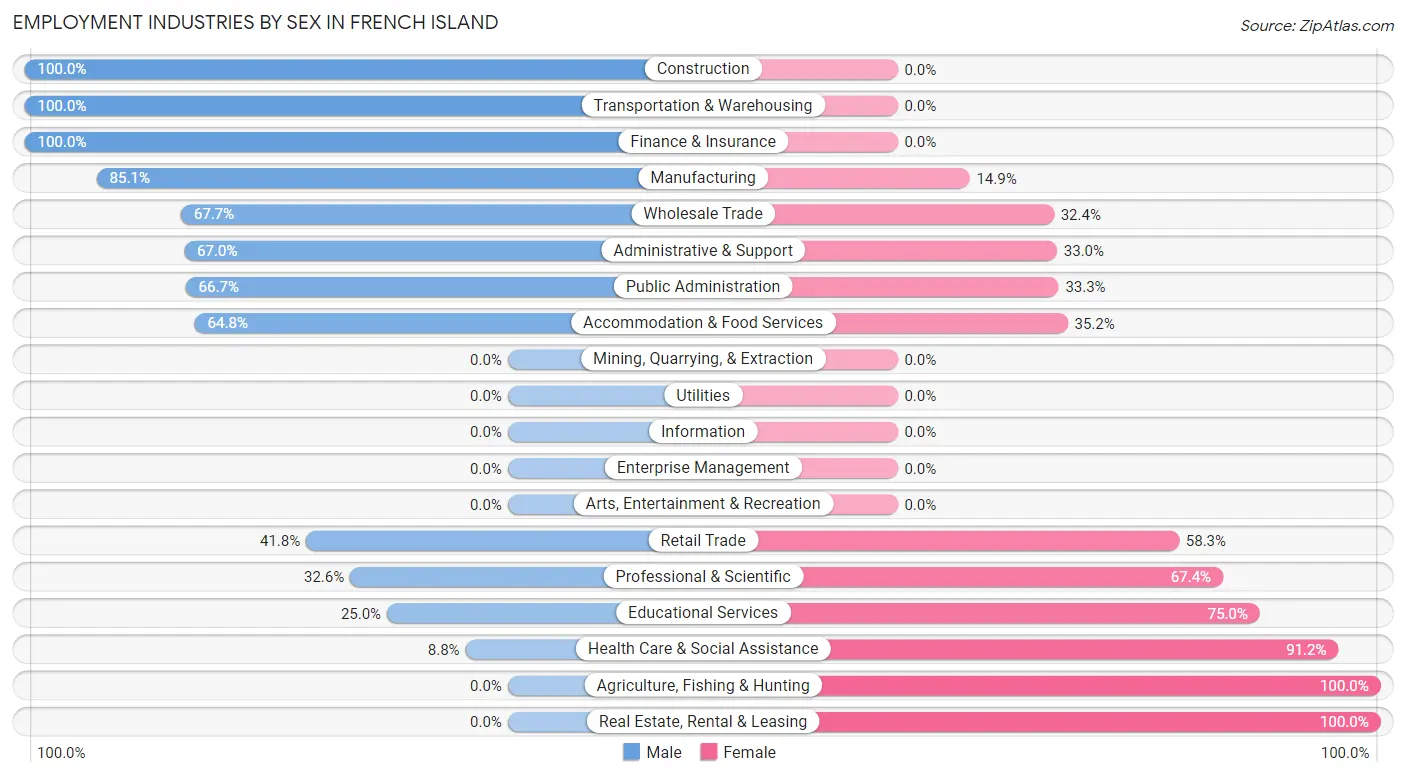
Employment Industries by Sex in French Island
The French Island industries that see more men than women are Construction (100.0%), Transportation & Warehousing (100.0%), and Finance & Insurance (100.0%), whereas the industries that tend to have a higher number of women are Agriculture, Fishing & Hunting (100.0%), Real Estate, Rental & Leasing (100.0%), and Health Care & Social Assistance (91.2%).
| Industry | Male | Female |
| Agriculture, Fishing & Hunting | 0 (0.0%) | 26 (100.0%) |
| Mining, Quarrying, & Extraction | 0 (0.0%) | 0 (0.0%) |
| Construction | 78 (100.0%) | 0 (0.0%) |
| Manufacturing | 268 (85.1%) | 47 (14.9%) |
| Wholesale Trade | 92 (67.6%) | 44 (32.4%) |
| Retail Trade | 124 (41.7%) | 173 (58.3%) |
| Transportation & Warehousing | 142 (100.0%) | 0 (0.0%) |
| Utilities | 0 (0.0%) | 0 (0.0%) |
| Information | 0 (0.0%) | 0 (0.0%) |
| Finance & Insurance | 63 (100.0%) | 0 (0.0%) |
| Real Estate, Rental & Leasing | 0 (0.0%) | 16 (100.0%) |
| Professional & Scientific | 94 (32.6%) | 194 (67.4%) |
| Enterprise Management | 0 (0.0%) | 0 (0.0%) |
| Administrative & Support | 67 (67.0%) | 33 (33.0%) |
| Educational Services | 23 (25.0%) | 69 (75.0%) |
| Health Care & Social Assistance | 34 (8.8%) | 354 (91.2%) |
| Arts, Entertainment & Recreation | 0 (0.0%) | 0 (0.0%) |
| Accommodation & Food Services | 92 (64.8%) | 50 (35.2%) |
| Public Administration | 28 (66.7%) | 14 (33.3%) |
| Total | 1,131 (50.8%) | 1,093 (49.1%) |
Education in French Island
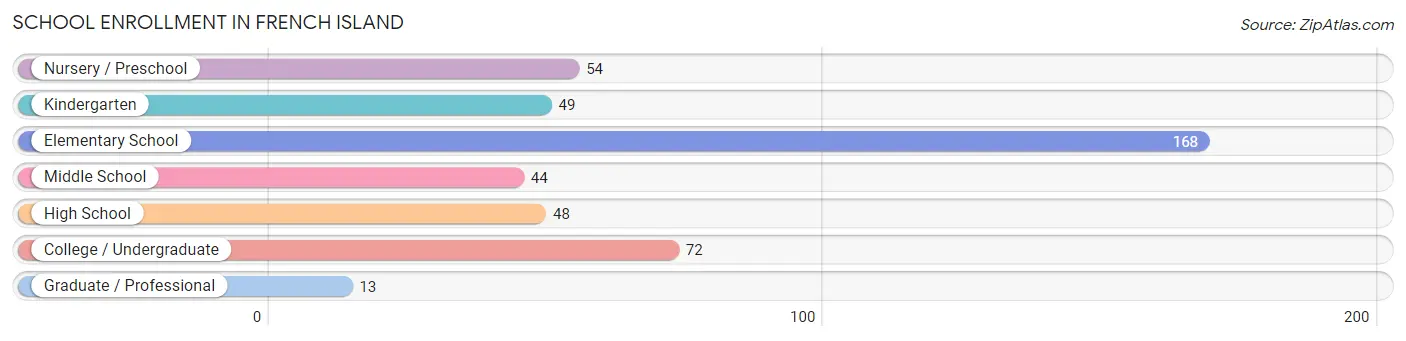
School Enrollment in French Island
The most common levels of schooling among the 448 students in French Island are elementary school (168 | 37.5%), college / undergraduate (72 | 16.1%), and nursery / preschool (54 | 12.0%).
| School Level | # Students | % Students |
| Nursery / Preschool | 54 | 12.0% |
| Kindergarten | 49 | 10.9% |
| Elementary School | 168 | 37.5% |
| Middle School | 44 | 9.8% |
| High School | 48 | 10.7% |
| College / Undergraduate | 72 | 16.1% |
| Graduate / Professional | 13 | 2.9% |
| Total | 448 | 100.0% |
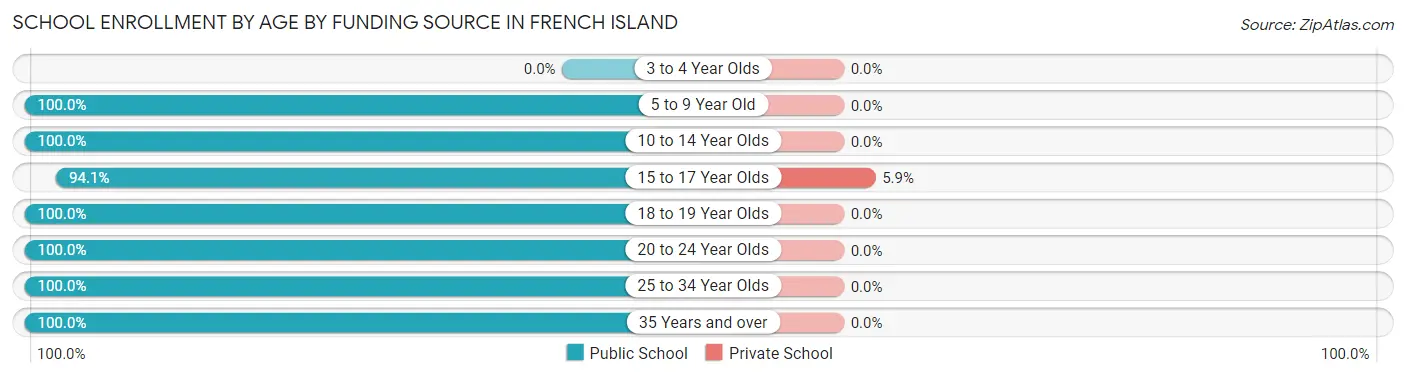
School Enrollment by Age by Funding Source in French Island
Out of a total of 448 students who are enrolled in schools in French Island, 1 (0.2%) attend a private institution, while the remaining 447 (99.8%) are enrolled in public schools. The age group of 15 to 17 year olds has the highest likelihood of being enrolled in private schools, with 1 (5.9% in the age bracket) enrolled. Conversely, the age group of 5 to 9 year old has the lowest likelihood of being enrolled in a private school, with 271 (100.0% in the age bracket) attending a public institution.
| Age Bracket | Public School | Private School |
| 3 to 4 Year Olds | 0 (0.0%) | 0 (0.0%) |
| 5 to 9 Year Old | 271 (100.0%) | 0 (0.0%) |
| 10 to 14 Year Olds | 59 (100.0%) | 0 (0.0%) |
| 15 to 17 Year Olds | 16 (94.1%) | 1 (5.9%) |
| 18 to 19 Year Olds | 35 (100.0%) | 0 (0.0%) |
| 20 to 24 Year Olds | 37 (100.0%) | 0 (0.0%) |
| 25 to 34 Year Olds | 13 (100.0%) | 0 (0.0%) |
| 35 Years and over | 16 (100.0%) | 0 (0.0%) |
| Total | 447 (99.8%) | 1 (0.2%) |
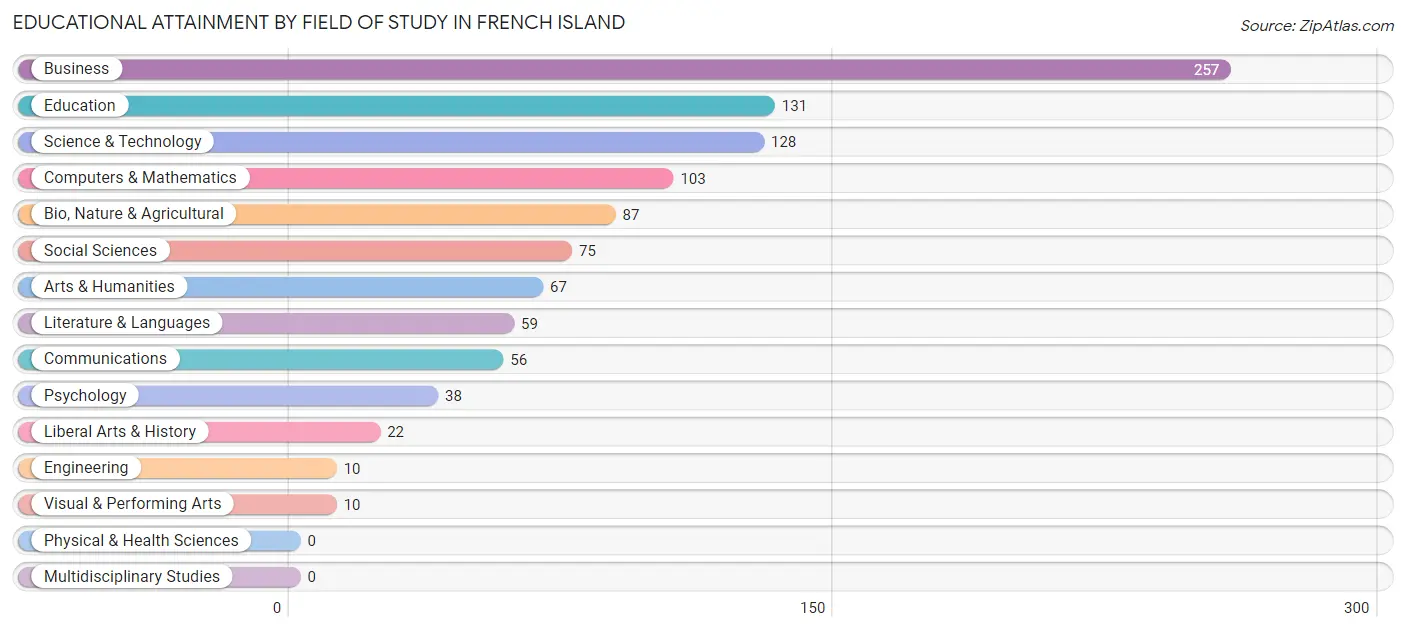
Educational Attainment by Field of Study in French Island
Business (257 | 24.6%), education (131 | 12.6%), science & technology (128 | 12.3%), computers & mathematics (103 | 9.9%), and bio, nature & agricultural (87 | 8.3%) are the most common fields of study among 1,043 individuals in French Island who have obtained a bachelor's degree or higher.
| Field of Study | # Graduates | % Graduates |
| Computers & Mathematics | 103 | 9.9% |
| Bio, Nature & Agricultural | 87 | 8.3% |
| Physical & Health Sciences | 0 | 0.0% |
| Psychology | 38 | 3.6% |
| Social Sciences | 75 | 7.2% |
| Engineering | 10 | 1.0% |
| Multidisciplinary Studies | 0 | 0.0% |
| Science & Technology | 128 | 12.3% |
| Business | 257 | 24.6% |
| Education | 131 | 12.6% |
| Literature & Languages | 59 | 5.7% |
| Liberal Arts & History | 22 | 2.1% |
| Visual & Performing Arts | 10 | 1.0% |
| Communications | 56 | 5.4% |
| Arts & Humanities | 67 | 6.4% |
| Total | 1,043 | 100.0% |
Transportation & Commute in French Island
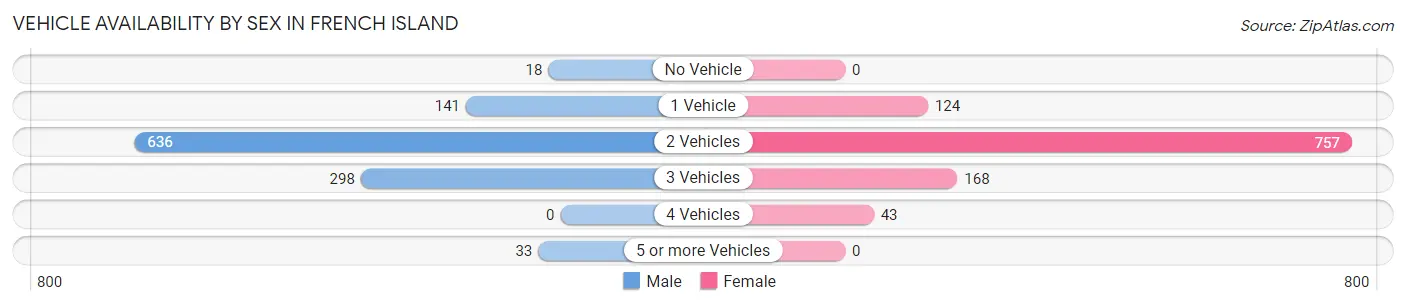
Vehicle Availability by Sex in French Island
The most prevalent vehicle ownership categories in French Island are males with 2 vehicles (636, accounting for 56.5%) and females with 2 vehicles (757, making up 58.2%).
| Vehicles Available | Male | Female |
| No Vehicle | 18 (1.6%) | 0 (0.0%) |
| 1 Vehicle | 141 (12.5%) | 124 (11.4%) |
| 2 Vehicles | 636 (56.5%) | 757 (69.3%) |
| 3 Vehicles | 298 (26.5%) | 168 (15.4%) |
| 4 Vehicles | 0 (0.0%) | 43 (3.9%) |
| 5 or more Vehicles | 33 (2.9%) | 0 (0.0%) |
| Total | 1,126 (100.0%) | 1,092 (100.0%) |
Commute Time in French Island
The most frequently occuring commute durations in French Island are 15 to 19 minutes (531 commuters, 25.7%), 5 to 9 minutes (435 commuters, 21.1%), and 20 to 24 minutes (383 commuters, 18.5%).
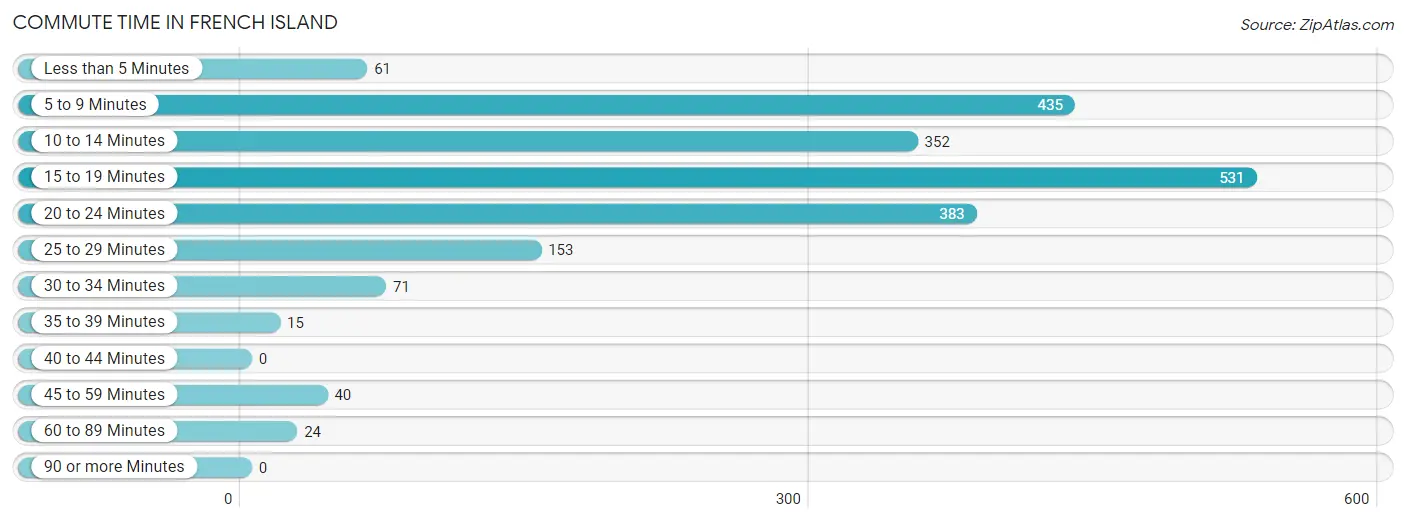
| Commute Time | # Commuters | % Commuters |
| Less than 5 Minutes | 61 | 2.9% |
| 5 to 9 Minutes | 435 | 21.1% |
| 10 to 14 Minutes | 352 | 17.1% |
| 15 to 19 Minutes | 531 | 25.7% |
| 20 to 24 Minutes | 383 | 18.5% |
| 25 to 29 Minutes | 153 | 7.4% |
| 30 to 34 Minutes | 71 | 3.4% |
| 35 to 39 Minutes | 15 | 0.7% |
| 40 to 44 Minutes | 0 | 0.0% |
| 45 to 59 Minutes | 40 | 1.9% |
| 60 to 89 Minutes | 24 | 1.2% |
| 90 or more Minutes | 0 | 0.0% |
Commute Time by Sex in French Island
The most common commute times in French Island are 5 to 9 minutes (316 commuters, 29.9%) for males and 15 to 19 minutes (356 commuters, 35.3%) for females.
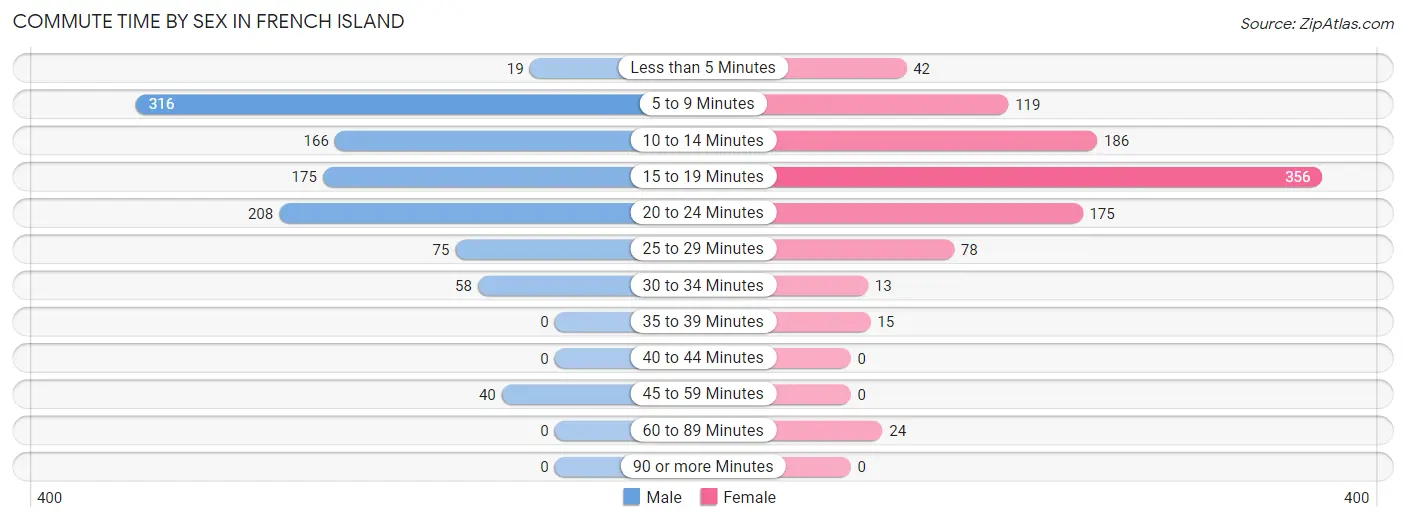
| Commute Time | Male | Female |
| Less than 5 Minutes | 19 (1.8%) | 42 (4.2%) |
| 5 to 9 Minutes | 316 (29.9%) | 119 (11.8%) |
| 10 to 14 Minutes | 166 (15.7%) | 186 (18.4%) |
| 15 to 19 Minutes | 175 (16.6%) | 356 (35.3%) |
| 20 to 24 Minutes | 208 (19.7%) | 175 (17.4%) |
| 25 to 29 Minutes | 75 (7.1%) | 78 (7.7%) |
| 30 to 34 Minutes | 58 (5.5%) | 13 (1.3%) |
| 35 to 39 Minutes | 0 (0.0%) | 15 (1.5%) |
| 40 to 44 Minutes | 0 (0.0%) | 0 (0.0%) |
| 45 to 59 Minutes | 40 (3.8%) | 0 (0.0%) |
| 60 to 89 Minutes | 0 (0.0%) | 24 (2.4%) |
| 90 or more Minutes | 0 (0.0%) | 0 (0.0%) |
Time of Departure to Work by Sex in French Island
The most frequent times of departure to work in French Island are 7:00 AM to 7:29 AM (169, 16.0%) for males and 7:00 AM to 7:29 AM (248, 24.6%) for females.
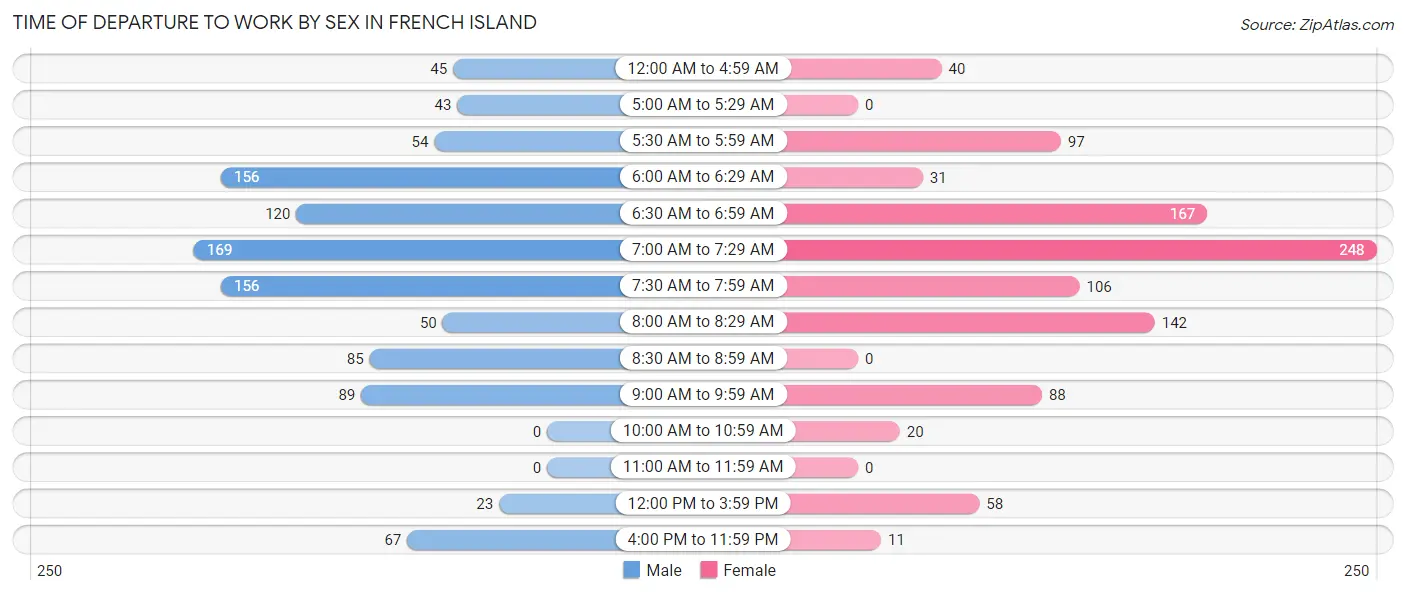
| Time of Departure | Male | Female |
| 12:00 AM to 4:59 AM | 45 (4.3%) | 40 (4.0%) |
| 5:00 AM to 5:29 AM | 43 (4.1%) | 0 (0.0%) |
| 5:30 AM to 5:59 AM | 54 (5.1%) | 97 (9.6%) |
| 6:00 AM to 6:29 AM | 156 (14.8%) | 31 (3.1%) |
| 6:30 AM to 6:59 AM | 120 (11.4%) | 167 (16.6%) |
| 7:00 AM to 7:29 AM | 169 (16.0%) | 248 (24.6%) |
| 7:30 AM to 7:59 AM | 156 (14.8%) | 106 (10.5%) |
| 8:00 AM to 8:29 AM | 50 (4.7%) | 142 (14.1%) |
| 8:30 AM to 8:59 AM | 85 (8.0%) | 0 (0.0%) |
| 9:00 AM to 9:59 AM | 89 (8.4%) | 88 (8.7%) |
| 10:00 AM to 10:59 AM | 0 (0.0%) | 20 (2.0%) |
| 11:00 AM to 11:59 AM | 0 (0.0%) | 0 (0.0%) |
| 12:00 PM to 3:59 PM | 23 (2.2%) | 58 (5.8%) |
| 4:00 PM to 11:59 PM | 67 (6.3%) | 11 (1.1%) |
| Total | 1,057 (100.0%) | 1,008 (100.0%) |
Housing Occupancy in French Island
Occupancy by Ownership in French Island
Of the total 1,964 dwellings in French Island, owner-occupied units account for 1,419 (72.3%), while renter-occupied units make up 545 (27.8%).
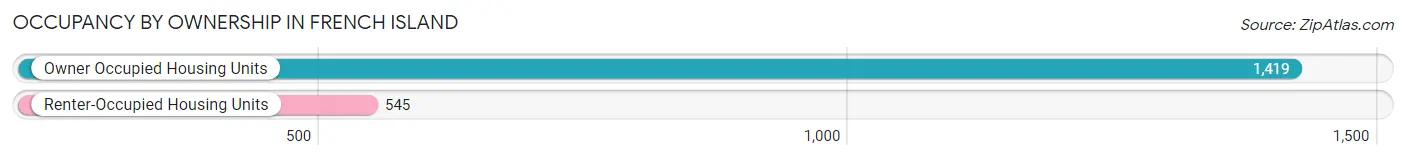
| Occupancy | # Housing Units | % Housing Units |
| Owner Occupied Housing Units | 1,419 | 72.3% |
| Renter-Occupied Housing Units | 545 | 27.8% |
| Total Occupied Housing Units | 1,964 | 100.0% |
Occupancy by Household Size in French Island
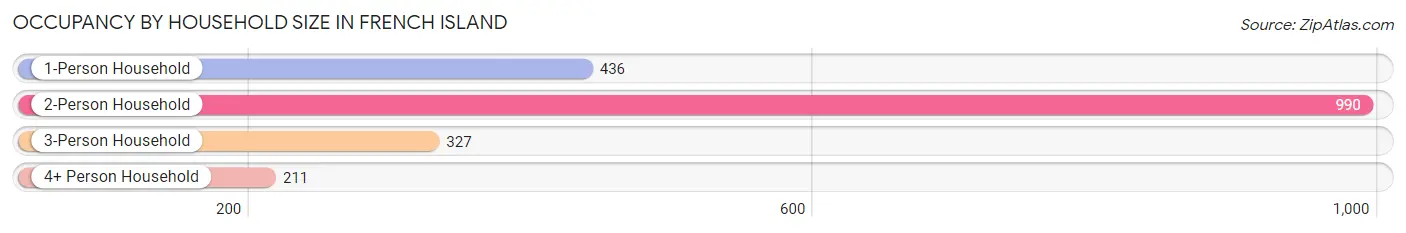
| Household Size | # Housing Units | % Housing Units |
| 1-Person Household | 436 | 22.2% |
| 2-Person Household | 990 | 50.4% |
| 3-Person Household | 327 | 16.7% |
| 4+ Person Household | 211 | 10.7% |
| Total Housing Units | 1,964 | 100.0% |
Occupancy by Ownership by Household Size in French Island
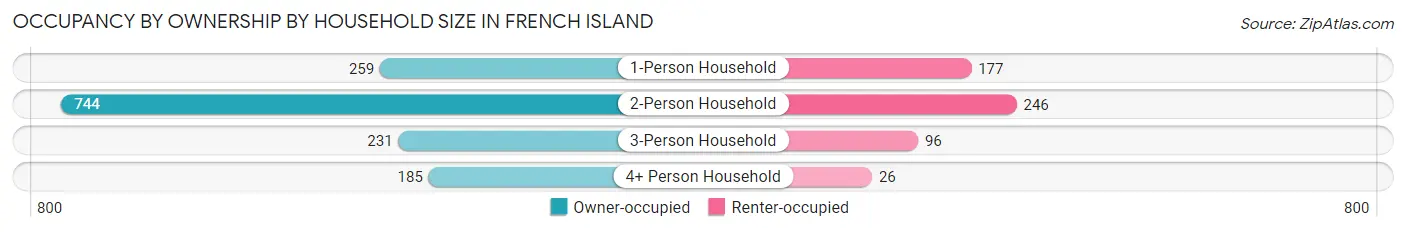
| Household Size | Owner-occupied | Renter-occupied |
| 1-Person Household | 259 (59.4%) | 177 (40.6%) |
| 2-Person Household | 744 (75.1%) | 246 (24.8%) |
| 3-Person Household | 231 (70.6%) | 96 (29.4%) |
| 4+ Person Household | 185 (87.7%) | 26 (12.3%) |
| Total Housing Units | 1,419 (72.3%) | 545 (27.8%) |
Occupancy by Educational Attainment in French Island
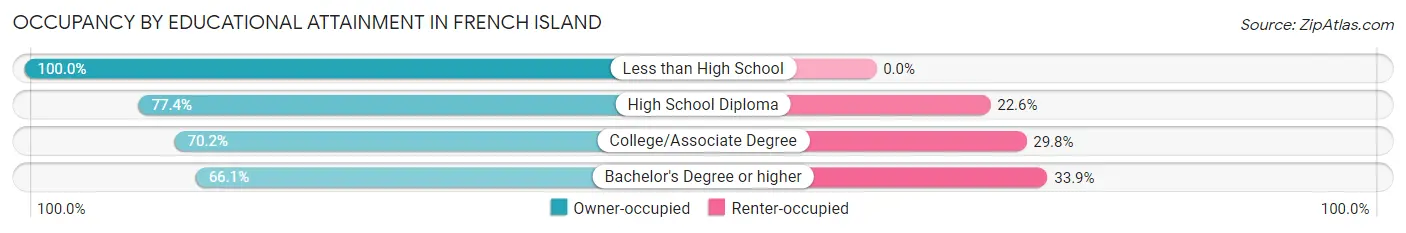
| Household Size | Owner-occupied | Renter-occupied |
| Less than High School | 16 (100.0%) | 0 (0.0%) |
| High School Diploma | 602 (77.4%) | 176 (22.6%) |
| College/Associate Degree | 472 (70.2%) | 200 (29.8%) |
| Bachelor's Degree or higher | 329 (66.1%) | 169 (33.9%) |
Occupancy by Age of Householder in French Island
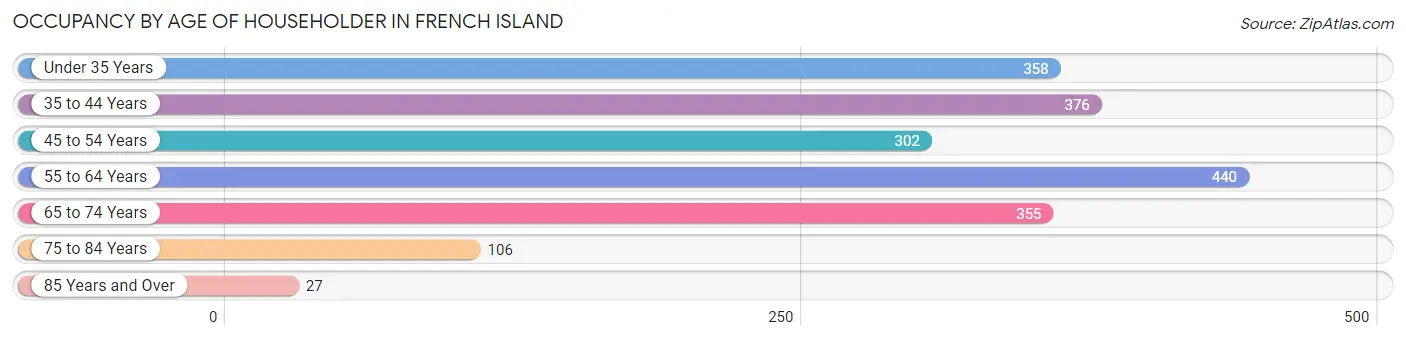
| Age Bracket | # Households | % Households |
| Under 35 Years | 358 | 18.2% |
| 35 to 44 Years | 376 | 19.1% |
| 45 to 54 Years | 302 | 15.4% |
| 55 to 64 Years | 440 | 22.4% |
| 65 to 74 Years | 355 | 18.1% |
| 75 to 84 Years | 106 | 5.4% |
| 85 Years and Over | 27 | 1.4% |
| Total | 1,964 | 100.0% |
Housing Finances in French Island
Median Income by Occupancy in French Island
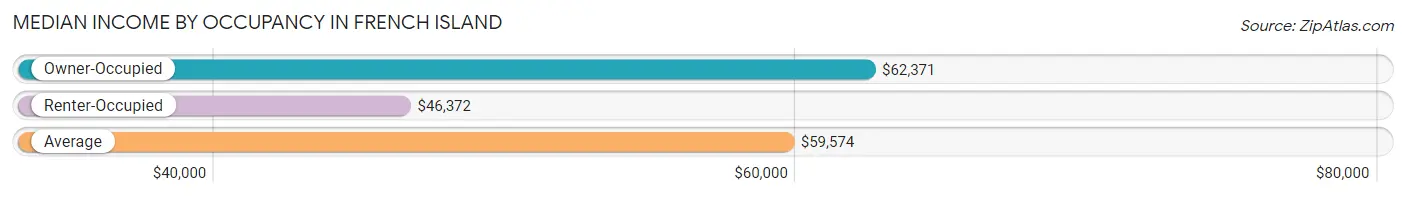
| Occupancy Type | # Households | Median Income |
| Owner-Occupied | 1,419 (72.3%) | $62,371 |
| Renter-Occupied | 545 (27.8%) | $46,372 |
| Average | 1,964 (100.0%) | $59,574 |
Occupancy by Householder Income Bracket in French Island
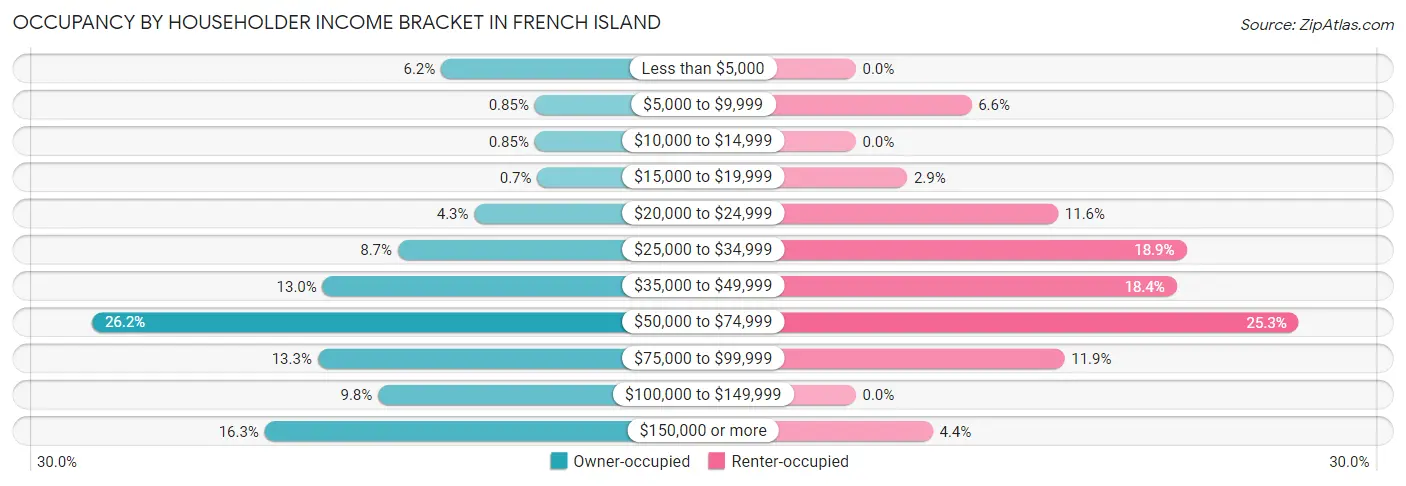
| Income Bracket | Owner-occupied | Renter-occupied |
| Less than $5,000 | 88 (6.2%) | 0 (0.0%) |
| $5,000 to $9,999 | 12 (0.9%) | 36 (6.6%) |
| $10,000 to $14,999 | 12 (0.9%) | 0 (0.0%) |
| $15,000 to $19,999 | 10 (0.7%) | 16 (2.9%) |
| $20,000 to $24,999 | 61 (4.3%) | 63 (11.6%) |
| $25,000 to $34,999 | 123 (8.7%) | 103 (18.9%) |
| $35,000 to $49,999 | 184 (13.0%) | 100 (18.3%) |
| $50,000 to $74,999 | 371 (26.2%) | 138 (25.3%) |
| $75,000 to $99,999 | 188 (13.3%) | 65 (11.9%) |
| $100,000 to $149,999 | 139 (9.8%) | 0 (0.0%) |
| $150,000 or more | 231 (16.3%) | 24 (4.4%) |
| Total | 1,419 (100.0%) | 545 (100.0%) |
Monthly Housing Cost Tiers in French Island
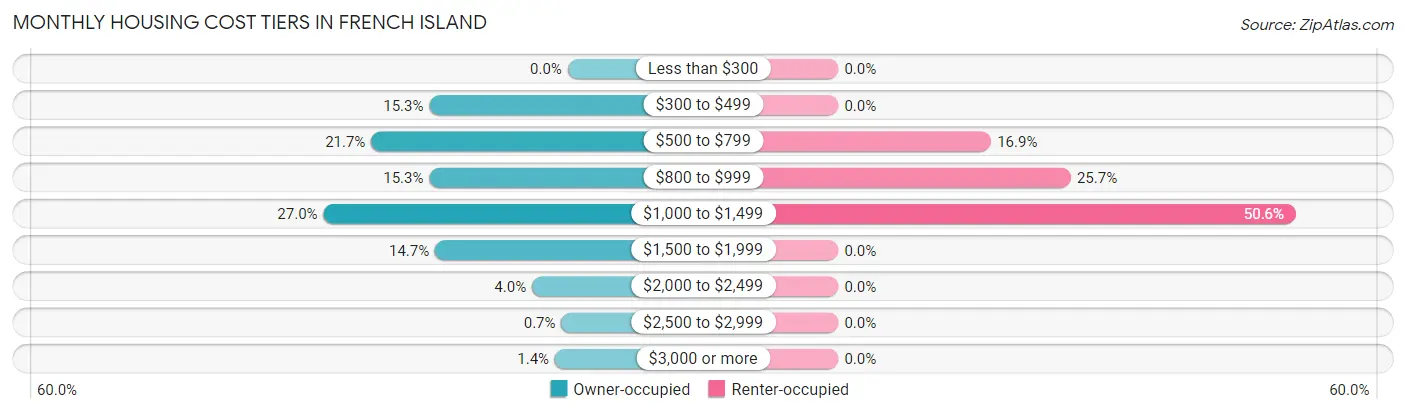
| Monthly Cost | Owner-occupied | Renter-occupied |
| Less than $300 | 0 (0.0%) | 0 (0.0%) |
| $300 to $499 | 217 (15.3%) | 0 (0.0%) |
| $500 to $799 | 308 (21.7%) | 92 (16.9%) |
| $800 to $999 | 217 (15.3%) | 140 (25.7%) |
| $1,000 to $1,499 | 383 (27.0%) | 276 (50.6%) |
| $1,500 to $1,999 | 208 (14.7%) | 0 (0.0%) |
| $2,000 to $2,499 | 56 (4.0%) | 0 (0.0%) |
| $2,500 to $2,999 | 10 (0.7%) | 0 (0.0%) |
| $3,000 or more | 20 (1.4%) | 0 (0.0%) |
| Total | 1,419 (100.0%) | 545 (100.0%) |
Physical Housing Characteristics in French Island
Housing Structures in French Island
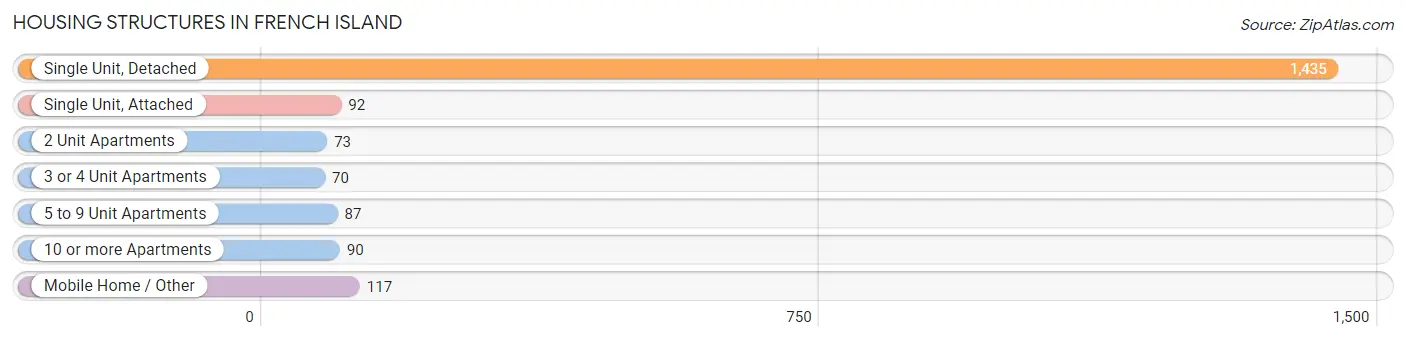
| Structure Type | # Housing Units | % Housing Units |
| Single Unit, Detached | 1,435 | 73.1% |
| Single Unit, Attached | 92 | 4.7% |
| 2 Unit Apartments | 73 | 3.7% |
| 3 or 4 Unit Apartments | 70 | 3.6% |
| 5 to 9 Unit Apartments | 87 | 4.4% |
| 10 or more Apartments | 90 | 4.6% |
| Mobile Home / Other | 117 | 6.0% |
| Total | 1,964 | 100.0% |
Housing Structures by Occupancy in French Island
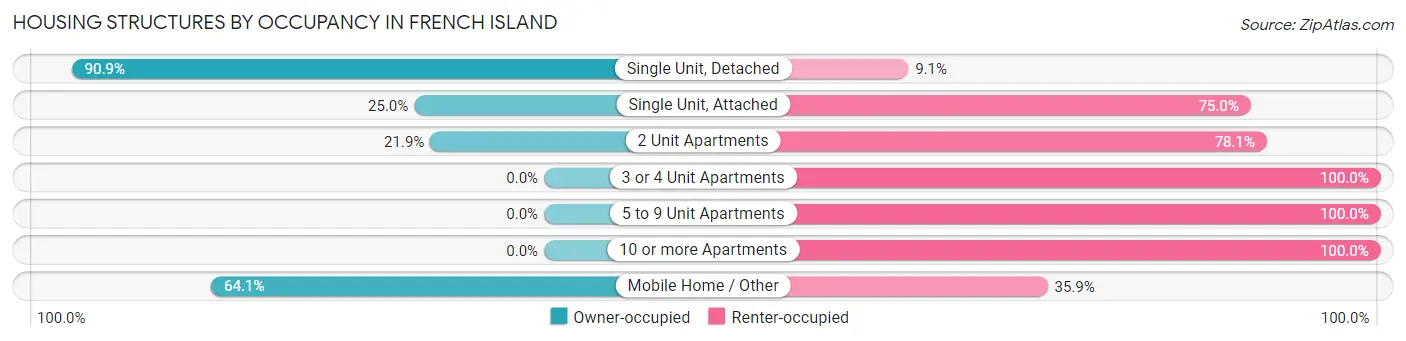
| Structure Type | Owner-occupied | Renter-occupied |
| Single Unit, Detached | 1,305 (90.9%) | 130 (9.1%) |
| Single Unit, Attached | 23 (25.0%) | 69 (75.0%) |
| 2 Unit Apartments | 16 (21.9%) | 57 (78.1%) |
| 3 or 4 Unit Apartments | 0 (0.0%) | 70 (100.0%) |
| 5 to 9 Unit Apartments | 0 (0.0%) | 87 (100.0%) |
| 10 or more Apartments | 0 (0.0%) | 90 (100.0%) |
| Mobile Home / Other | 75 (64.1%) | 42 (35.9%) |
| Total | 1,419 (72.3%) | 545 (27.8%) |
Housing Structures by Number of Rooms in French Island
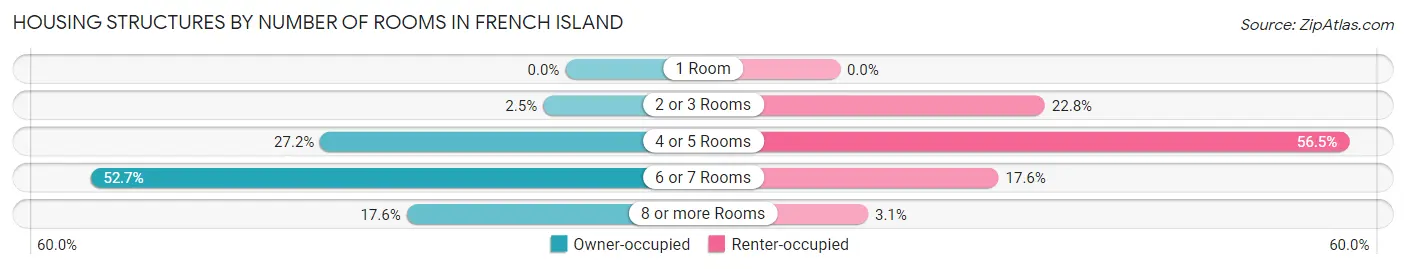
| Number of Rooms | Owner-occupied | Renter-occupied |
| 1 Room | 0 (0.0%) | 0 (0.0%) |
| 2 or 3 Rooms | 35 (2.5%) | 124 (22.8%) |
| 4 or 5 Rooms | 386 (27.2%) | 308 (56.5%) |
| 6 or 7 Rooms | 748 (52.7%) | 96 (17.6%) |
| 8 or more Rooms | 250 (17.6%) | 17 (3.1%) |
| Total | 1,419 (100.0%) | 545 (100.0%) |
Housing Structure by Heating Type in French Island
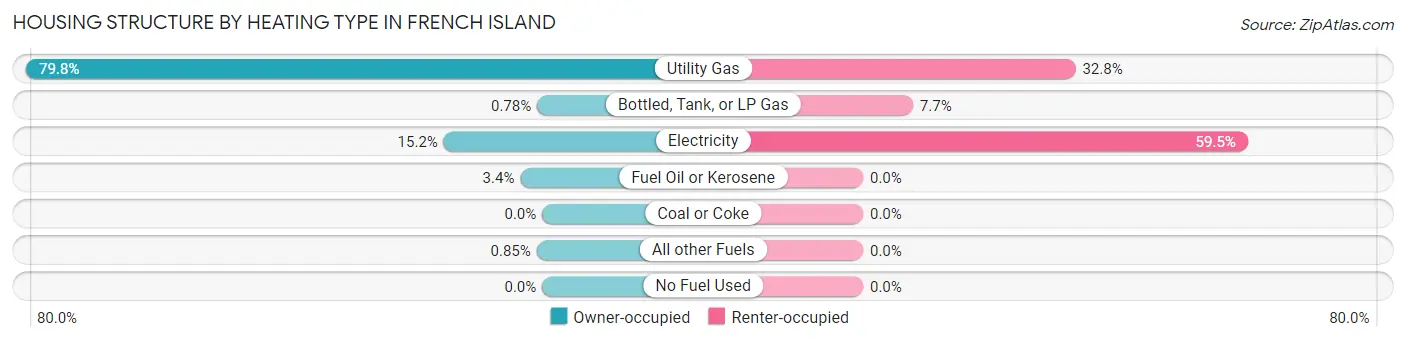
| Heating Type | Owner-occupied | Renter-occupied |
| Utility Gas | 1,132 (79.8%) | 179 (32.8%) |
| Bottled, Tank, or LP Gas | 11 (0.8%) | 42 (7.7%) |
| Electricity | 216 (15.2%) | 324 (59.5%) |
| Fuel Oil or Kerosene | 48 (3.4%) | 0 (0.0%) |
| Coal or Coke | 0 (0.0%) | 0 (0.0%) |
| All other Fuels | 12 (0.9%) | 0 (0.0%) |
| No Fuel Used | 0 (0.0%) | 0 (0.0%) |
| Total | 1,419 (100.0%) | 545 (100.0%) |
Household Vehicle Usage in French Island
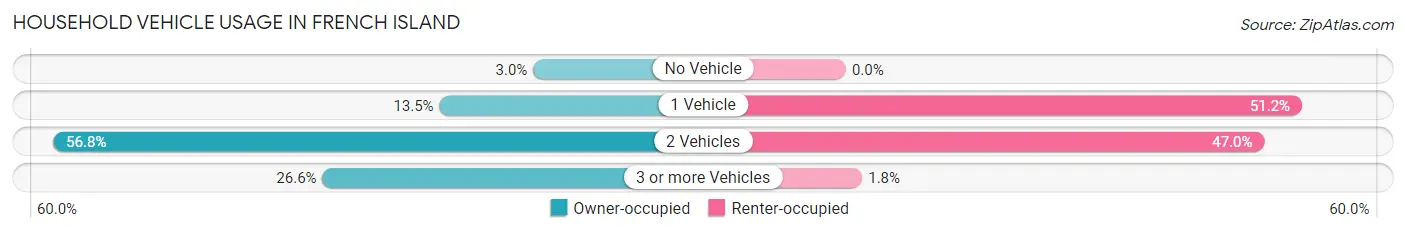
| Vehicles per Household | Owner-occupied | Renter-occupied |
| No Vehicle | 43 (3.0%) | 0 (0.0%) |
| 1 Vehicle | 192 (13.5%) | 279 (51.2%) |
| 2 Vehicles | 806 (56.8%) | 256 (47.0%) |
| 3 or more Vehicles | 378 (26.6%) | 10 (1.8%) |
| Total | 1,419 (100.0%) | 545 (100.0%) |
Real Estate & Mortgages in French Island
Real Estate and Mortgage Overview in French Island
| Characteristic | Without Mortgage | With Mortgage |
| Housing Units | 588 | 831 |
| Median Property Value | $172,300 | $190,000 |
| Median Household Income | $60,000 | $164 |
| Monthly Housing Costs | $563 | $20 |
| Real Estate Taxes | $3,530 | $36 |
Property Value by Mortgage Status in French Island
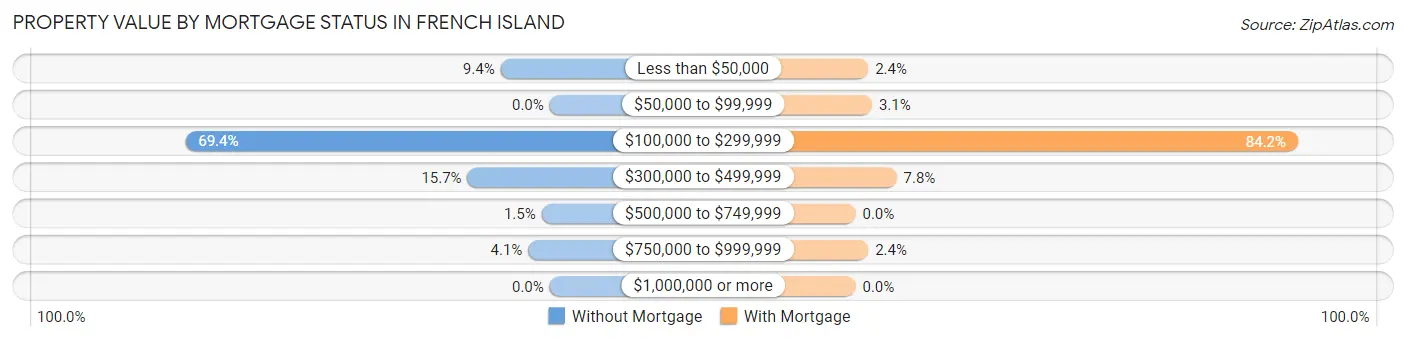
| Property Value | Without Mortgage | With Mortgage |
| Less than $50,000 | 55 (9.3%) | 20 (2.4%) |
| $50,000 to $99,999 | 0 (0.0%) | 26 (3.1%) |
| $100,000 to $299,999 | 408 (69.4%) | 700 (84.2%) |
| $300,000 to $499,999 | 92 (15.7%) | 65 (7.8%) |
| $500,000 to $749,999 | 9 (1.5%) | 0 (0.0%) |
| $750,000 to $999,999 | 24 (4.1%) | 20 (2.4%) |
| $1,000,000 or more | 0 (0.0%) | 0 (0.0%) |
| Total | 588 (100.0%) | 831 (100.0%) |
Household Income by Mortgage Status in French Island
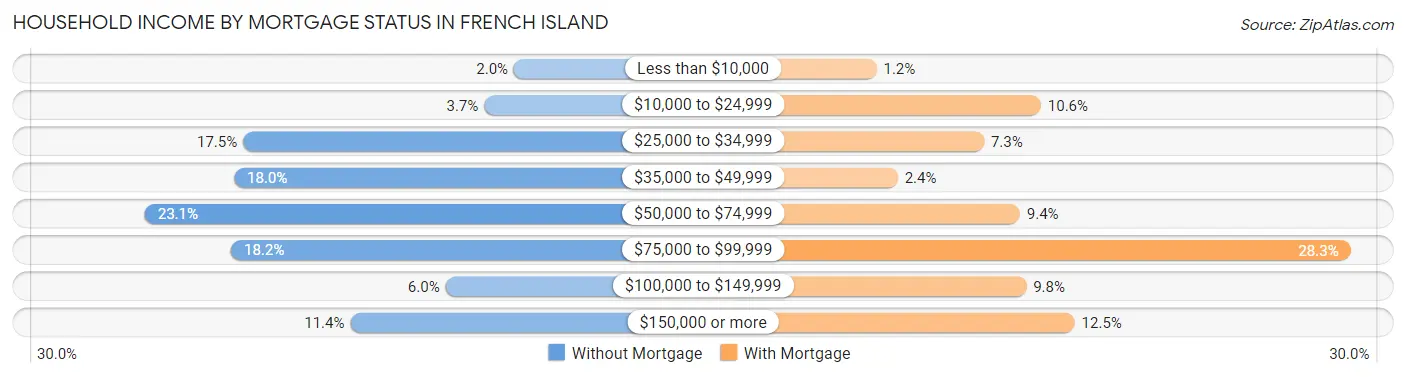
| Household Income | Without Mortgage | With Mortgage |
| Less than $10,000 | 12 (2.0%) | 10 (1.2%) |
| $10,000 to $24,999 | 22 (3.7%) | 88 (10.6%) |
| $25,000 to $34,999 | 103 (17.5%) | 61 (7.3%) |
| $35,000 to $49,999 | 106 (18.0%) | 20 (2.4%) |
| $50,000 to $74,999 | 136 (23.1%) | 78 (9.4%) |
| $75,000 to $99,999 | 107 (18.2%) | 235 (28.3%) |
| $100,000 to $149,999 | 35 (5.9%) | 81 (9.8%) |
| $150,000 or more | 67 (11.4%) | 104 (12.5%) |
| Total | 588 (100.0%) | 831 (100.0%) |
Property Value to Household Income Ratio in French Island
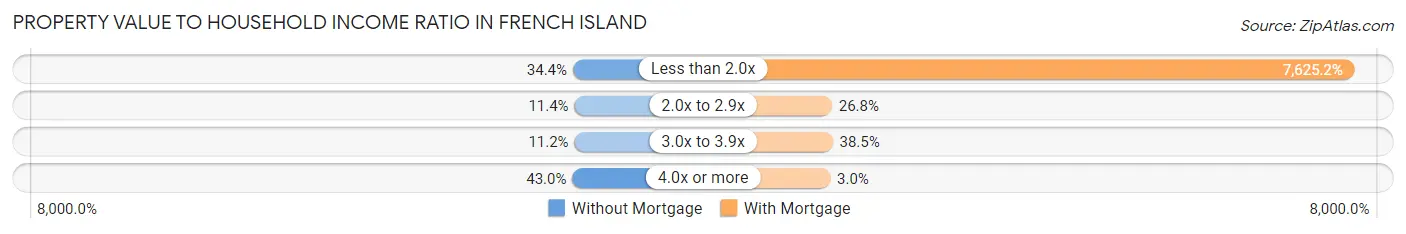
| Value-to-Income Ratio | Without Mortgage | With Mortgage |
| Less than 2.0x | 202 (34.4%) | 63,365 (7,625.1%) |
| 2.0x to 2.9x | 67 (11.4%) | 223 (26.8%) |
| 3.0x to 3.9x | 66 (11.2%) | 320 (38.5%) |
| 4.0x or more | 253 (43.0%) | 25 (3.0%) |
| Total | 588 (100.0%) | 831 (100.0%) |
Real Estate Taxes by Mortgage Status in French Island
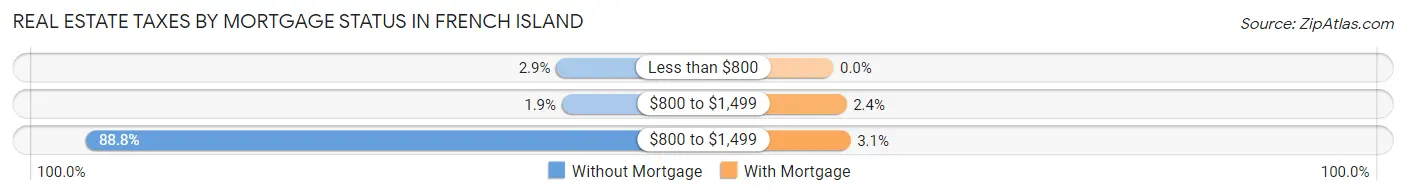
| Property Taxes | Without Mortgage | With Mortgage |
| Less than $800 | 17 (2.9%) | 0 (0.0%) |
| $800 to $1,499 | 11 (1.9%) | 20 (2.4%) |
| $800 to $1,499 | 522 (88.8%) | 26 (3.1%) |
| Total | 588 (100.0%) | 831 (100.0%) |
Health & Disability in French Island
Health Insurance Coverage by Age in French Island
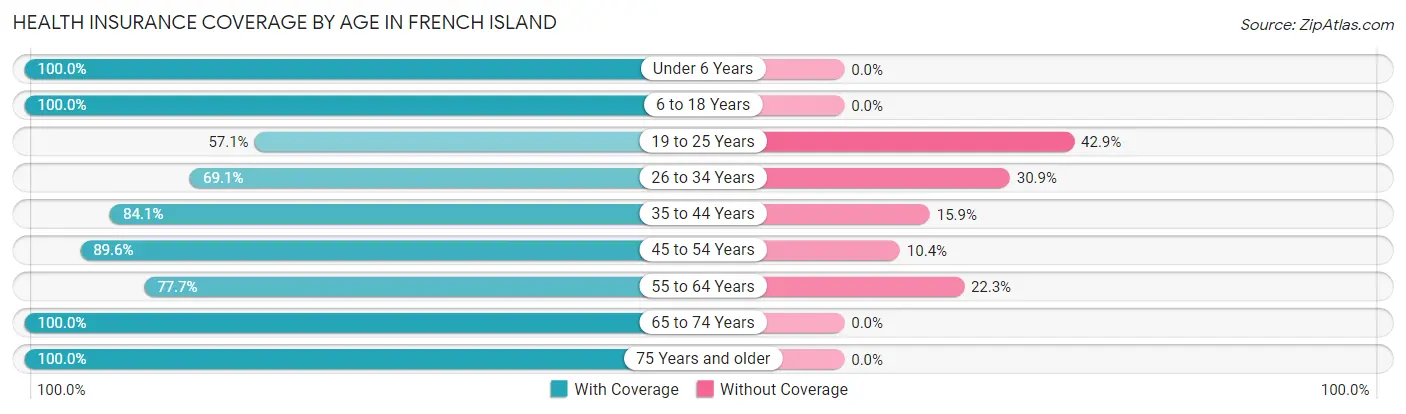
| Age Bracket | With Coverage | Without Coverage |
| Under 6 Years | 413 (100.0%) | 0 (0.0%) |
| 6 to 18 Years | 307 (100.0%) | 0 (0.0%) |
| 19 to 25 Years | 152 (57.1%) | 114 (42.9%) |
| 26 to 34 Years | 459 (69.1%) | 205 (30.9%) |
| 35 to 44 Years | 427 (84.1%) | 81 (15.9%) |
| 45 to 54 Years | 415 (89.6%) | 48 (10.4%) |
| 55 to 64 Years | 665 (77.7%) | 191 (22.3%) |
| 65 to 74 Years | 571 (100.0%) | 0 (0.0%) |
| 75 Years and older | 216 (100.0%) | 0 (0.0%) |
| Total | 3,625 (85.0%) | 639 (15.0%) |
Health Insurance Coverage by Citizenship Status in French Island
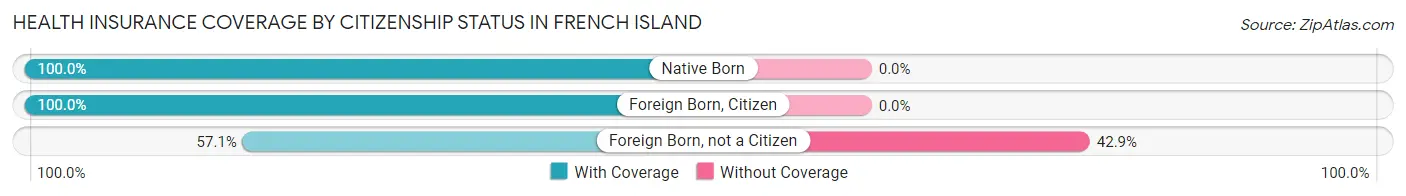
| Citizenship Status | With Coverage | Without Coverage |
| Native Born | 413 (100.0%) | 0 (0.0%) |
| Foreign Born, Citizen | 307 (100.0%) | 0 (0.0%) |
| Foreign Born, not a Citizen | 152 (57.1%) | 114 (42.9%) |
Health Insurance Coverage by Household Income in French Island
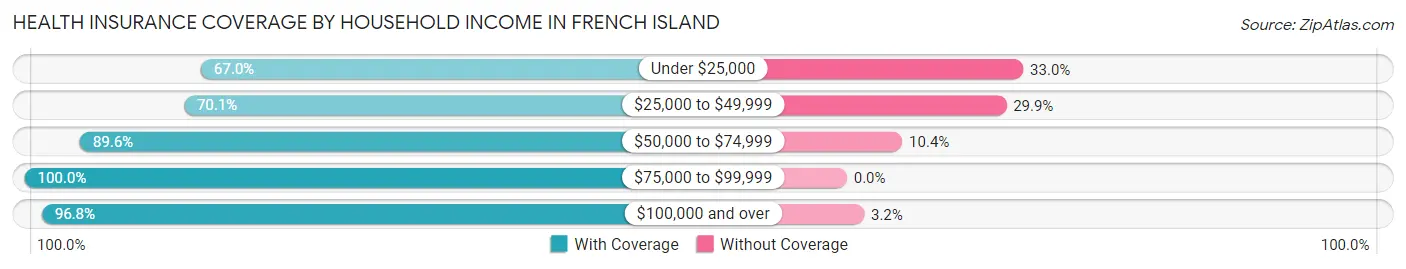
| Household Income | With Coverage | Without Coverage |
| Under $25,000 | 387 (67.0%) | 191 (33.0%) |
| $25,000 to $49,999 | 700 (70.1%) | 298 (29.9%) |
| $50,000 to $74,999 | 1,003 (89.6%) | 116 (10.4%) |
| $75,000 to $99,999 | 533 (100.0%) | 0 (0.0%) |
| $100,000 and over | 989 (96.8%) | 33 (3.2%) |
Public vs Private Health Insurance Coverage by Age in French Island
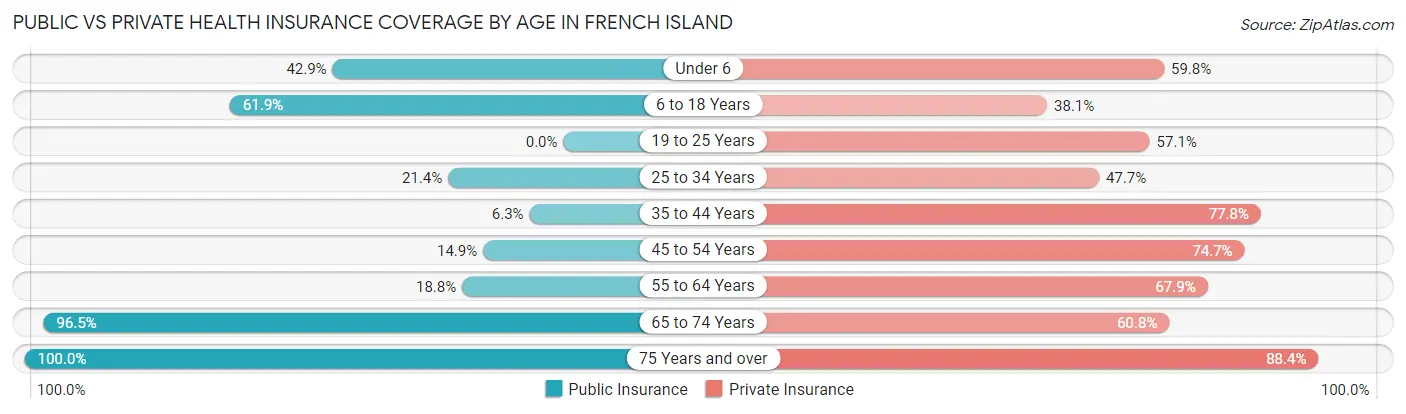
| Age Bracket | Public Insurance | Private Insurance |
| Under 6 | 177 (42.9%) | 247 (59.8%) |
| 6 to 18 Years | 190 (61.9%) | 117 (38.1%) |
| 19 to 25 Years | 0 (0.0%) | 152 (57.1%) |
| 25 to 34 Years | 142 (21.4%) | 317 (47.7%) |
| 35 to 44 Years | 32 (6.3%) | 395 (77.8%) |
| 45 to 54 Years | 69 (14.9%) | 346 (74.7%) |
| 55 to 64 Years | 161 (18.8%) | 581 (67.9%) |
| 65 to 74 Years | 551 (96.5%) | 347 (60.8%) |
| 75 Years and over | 216 (100.0%) | 191 (88.4%) |
| Total | 1,538 (36.1%) | 2,693 (63.2%) |
Disability Status by Sex by Age in French Island
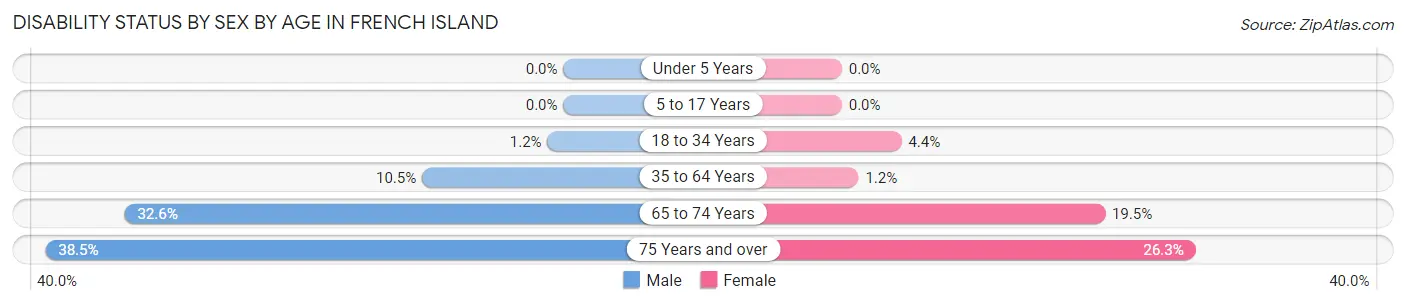
| Age Bracket | Male | Female |
| Under 5 Years | 0 (0.0%) | 0 (0.0%) |
| 5 to 17 Years | 0 (0.0%) | 0 (0.0%) |
| 18 to 34 Years | 5 (1.2%) | 23 (4.4%) |
| 35 to 64 Years | 107 (10.5%) | 10 (1.2%) |
| 65 to 74 Years | 101 (32.6%) | 51 (19.5%) |
| 75 Years and over | 45 (38.5%) | 26 (26.3%) |
Disability Class by Sex by Age in French Island
Disability Class: Hearing Difficulty
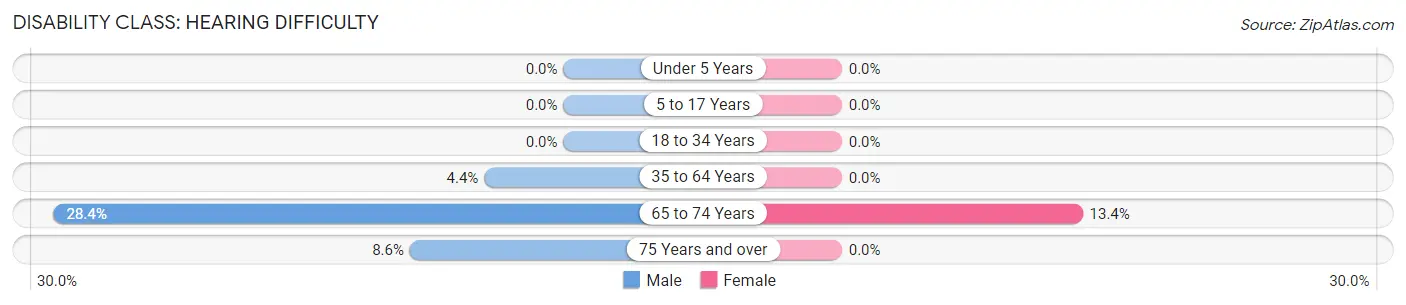
| Age Bracket | Male | Female |
| Under 5 Years | 0 (0.0%) | 0 (0.0%) |
| 5 to 17 Years | 0 (0.0%) | 0 (0.0%) |
| 18 to 34 Years | 0 (0.0%) | 0 (0.0%) |
| 35 to 64 Years | 45 (4.4%) | 0 (0.0%) |
| 65 to 74 Years | 88 (28.4%) | 35 (13.4%) |
| 75 Years and over | 10 (8.6%) | 0 (0.0%) |
Disability Class: Vision Difficulty
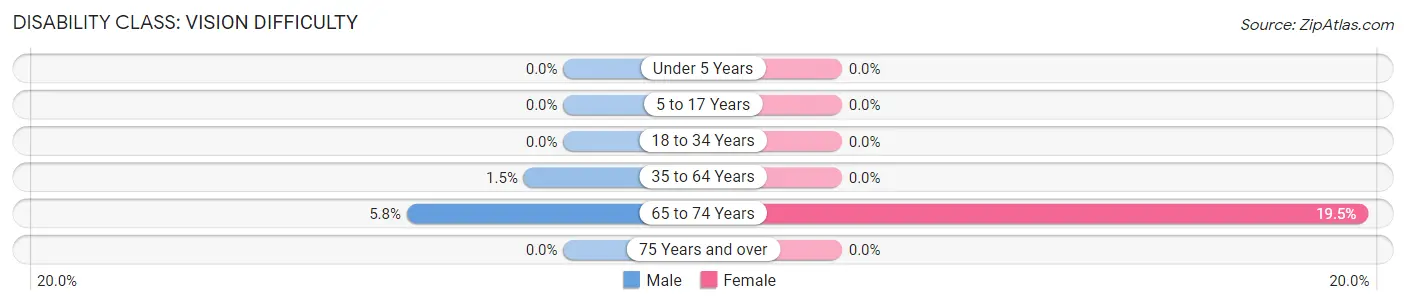
| Age Bracket | Male | Female |
| Under 5 Years | 0 (0.0%) | 0 (0.0%) |
| 5 to 17 Years | 0 (0.0%) | 0 (0.0%) |
| 18 to 34 Years | 0 (0.0%) | 0 (0.0%) |
| 35 to 64 Years | 15 (1.5%) | 0 (0.0%) |
| 65 to 74 Years | 18 (5.8%) | 51 (19.5%) |
| 75 Years and over | 0 (0.0%) | 0 (0.0%) |
Disability Class: Cognitive Difficulty
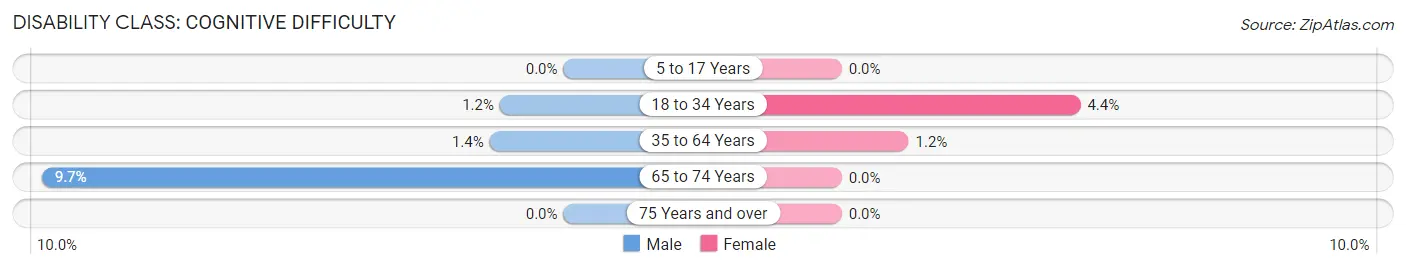
| Age Bracket | Male | Female |
| 5 to 17 Years | 0 (0.0%) | 0 (0.0%) |
| 18 to 34 Years | 5 (1.2%) | 23 (4.4%) |
| 35 to 64 Years | 14 (1.4%) | 10 (1.2%) |
| 65 to 74 Years | 30 (9.7%) | 0 (0.0%) |
| 75 Years and over | 0 (0.0%) | 0 (0.0%) |
Disability Class: Ambulatory Difficulty
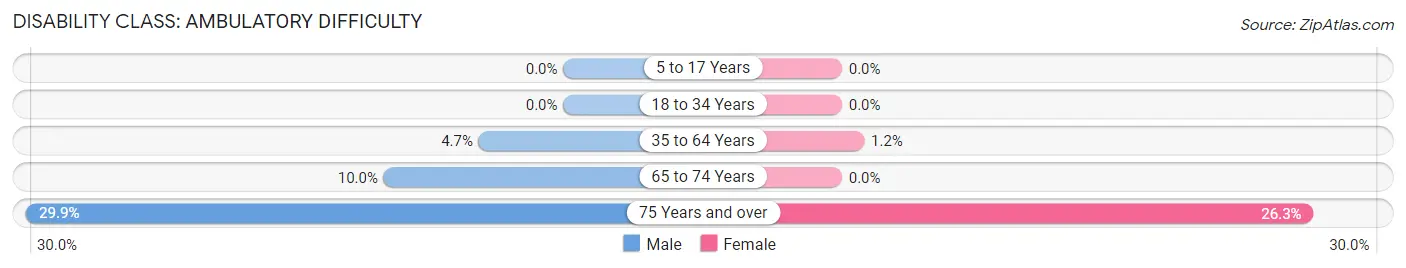
| Age Bracket | Male | Female |
| 5 to 17 Years | 0 (0.0%) | 0 (0.0%) |
| 18 to 34 Years | 0 (0.0%) | 0 (0.0%) |
| 35 to 64 Years | 48 (4.7%) | 10 (1.2%) |
| 65 to 74 Years | 31 (10.0%) | 0 (0.0%) |
| 75 Years and over | 35 (29.9%) | 26 (26.3%) |
Disability Class: Self-Care Difficulty
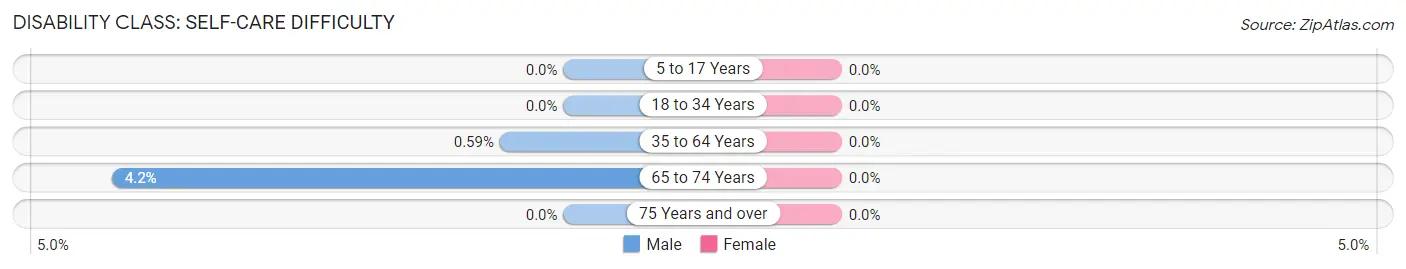
| Age Bracket | Male | Female |
| 5 to 17 Years | 0 (0.0%) | 0 (0.0%) |
| 18 to 34 Years | 0 (0.0%) | 0 (0.0%) |
| 35 to 64 Years | 6 (0.6%) | 0 (0.0%) |
| 65 to 74 Years | 13 (4.2%) | 0 (0.0%) |
| 75 Years and over | 0 (0.0%) | 0 (0.0%) |
Technology Access in French Island
Computing Device Access in French Island
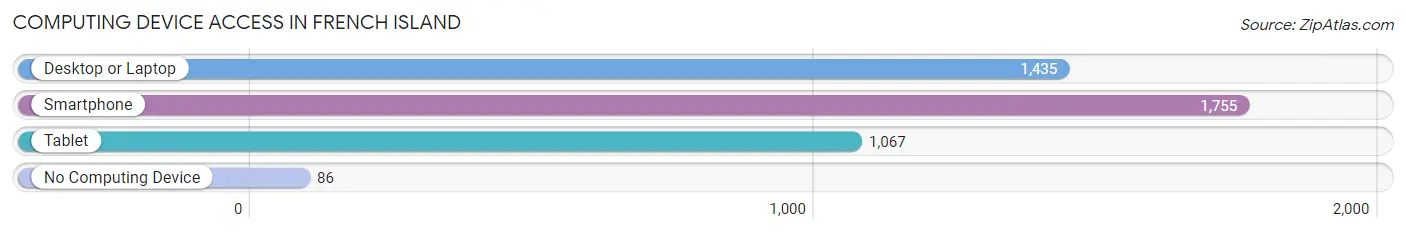
| Device Type | # Households | % Households |
| Desktop or Laptop | 1,435 | 73.1% |
| Smartphone | 1,755 | 89.4% |
| Tablet | 1,067 | 54.3% |
| No Computing Device | 86 | 4.4% |
| Total | 1,964 | 100.0% |
Internet Access in French Island
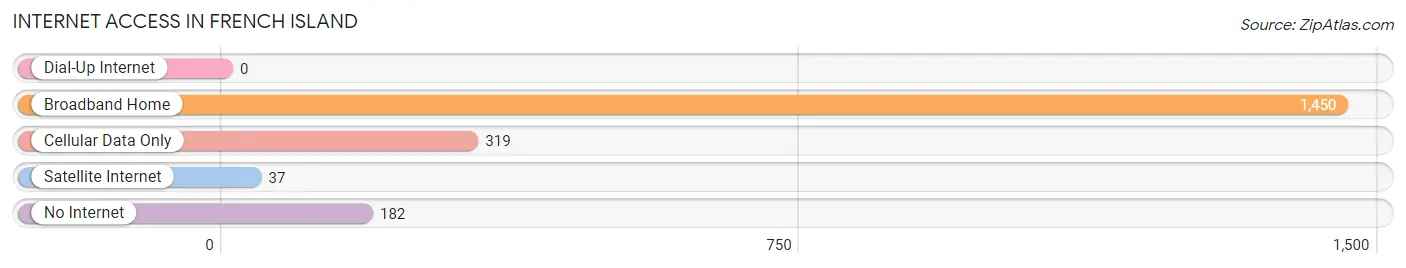
| Internet Type | # Households | % Households |
| Dial-Up Internet | 0 | 0.0% |
| Broadband Home | 1,450 | 73.8% |
| Cellular Data Only | 319 | 16.2% |
| Satellite Internet | 37 | 1.9% |
| No Internet | 182 | 9.3% |
| Total | 1,964 | 100.0% |
French Island Summary
History
French Island is an unincorporated community located in La Crosse County, Wisconsin, United States. It is located on an island in the Mississippi River, just south of La Crosse. The island is the largest in the Mississippi River, and is home to a variety of wildlife, including bald eagles, ospreys, and white-tailed deer.
The first settlers to the area were French fur traders, who arrived in the late 1700s. The island was originally known as “Isle de la Crosse”, and was used as a trading post for the fur trade. The island was also used as a refuge for Native Americans during the War of 1812.
In the mid-1800s, the island was settled by a group of German immigrants, who established a small farming community. The island was later renamed “French Island” in honor of the French fur traders who had originally settled the area.
In the late 1800s, the island became a popular tourist destination, with visitors coming to enjoy the natural beauty of the island and the nearby Mississippi River. The island was also home to a number of resorts, including the French Island Hotel, which was built in 1891.
In the early 1900s, the island was home to a number of industries, including a sawmill, a brickyard, and a cheese factory. The island also had a number of stores, including a general store, a post office, and a bank.
In the 1950s, the island was home to a number of summer camps, including Camp French Island, which was established in 1952. The camp was a popular destination for children from all over the Midwest.
Geography
French Island is located in La Crosse County, Wisconsin, United States. It is located on an island in the Mississippi River, just south of La Crosse. The island is the largest in the Mississippi River, and is home to a variety of wildlife, including bald eagles, ospreys, and white-tailed deer.
The island is approximately 4.5 miles long and 1.5 miles wide, and is divided into two sections by a narrow channel. The northern section of the island is known as “Upper French Island”, while the southern section is known as “Lower French Island”.
The island is surrounded by the Mississippi River on all sides, and is connected to the mainland by a bridge. The island is also connected to the mainland by a ferry service, which operates between the island and La Crosse.
Economy
The economy of French Island is largely based on tourism and agriculture. The island is home to a number of resorts, including the French Island Hotel, which was built in 1891. The island is also home to a number of summer camps, including Camp French Island, which was established in 1952.
The island is also home to a number of small businesses, including a general store, a post office, and a bank. The island is also home to a number of farms, which produce a variety of crops, including corn, soybeans, and hay.
Demographics
As of the 2010 census, the population of French Island was 1,845. The population is largely made up of white (94.3%) and Native American (2.2%) residents. The median household income is $45,000, and the median age is 44.
Conclusion
French Island is an unincorporated community located in La Crosse County, Wisconsin, United States. It is located on an island in the Mississippi River, just south of La Crosse. The island is the largest in the Mississippi River, and is home to a variety of wildlife, including bald eagles, ospreys, and white-tailed deer. The economy of French Island is largely based on tourism and agriculture, and the population is largely made up of white (94.3%) and Native American (2.2%) residents. The island is a popular tourist destination, and is home to a number of resorts, summer camps, and small businesses.
Common Questions
What is Per Capita Income in French Island?
Per Capita income in French Island is $37,568.
What is the Median Family Income in French Island?
Median Family Income in French Island is $71,991.
What is the Median Household income in French Island?
Median Household Income in French Island is $59,574.
What is Income or Wage Gap in French Island?
Income or Wage Gap in French Island is 22.4%.
Women in French Island earn 77.6 cents for every dollar earned by a man.
What is Inequality or Gini Index in French Island?
Inequality or Gini Index in French Island is 0.47.
What is the Total Population of French Island?
Total Population of French Island is 4,266.
What is the Total Male Population of French Island?
Total Male Population of French Island is 2,071.
What is the Total Female Population of French Island?
Total Female Population of French Island is 2,195.
What is the Ratio of Males per 100 Females in French Island?
There are 94.35 Males per 100 Females in French Island.
What is the Ratio of Females per 100 Males in French Island?
There are 105.99 Females per 100 Males in French Island.
What is the Median Population Age in French Island?
Median Population Age in French Island is 44.6 Years.
What is the Average Family Size in French Island
Average Family Size in French Island is 2.5 People.
What is the Average Household Size in French Island
Average Household Size in French Island is 2.2 People.
How Large is the Labor Force in French Island?
There are 2,375 People in the Labor Forcein in French Island.
What is the Percentage of People in the Labor Force in French Island?
66.5% of People are in the Labor Force in French Island.
What is the Unemployment Rate in French Island?
Unemployment Rate in French Island is 6.4%.