Footville, WI Map & Demographics
Footville Map
Footville Overview
$35,031
PER CAPITA INCOME
$74,917
AVG FAMILY INCOME
$61,250
AVG HOUSEHOLD INCOME
42.6%
WAGE / INCOME GAP [ % ]
57.4¢/ $1
WAGE / INCOME GAP [ $ ]
0.42
INEQUALITY / GINI INDEX
939
TOTAL POPULATION
506
MALE POPULATION
433
FEMALE POPULATION
116.86
MALES / 100 FEMALES
85.57
FEMALES / 100 MALES
42.2
MEDIAN AGE
3.0
AVG FAMILY SIZE
2.3
AVG HOUSEHOLD SIZE
472
LABOR FORCE [ PEOPLE ]
62.4%
PERCENT IN LABOR FORCE
3.0%
UNEMPLOYMENT RATE
Footville Zip Codes
Income in Footville
Income Overview in Footville
Per Capita Income in Footville is $35,031, while median incomes of families and households are $74,917 and $61,250 respectively.
| Characteristic | Number | Measure |
| Per Capita Income | 939 | $35,031 |
| Median Family Income | 239 | $74,917 |
| Mean Family Income | 239 | $82,146 |
| Median Household Income | 399 | $61,250 |
| Mean Household Income | 399 | $77,540 |
| Income Deficit | 239 | $0 |
| Wage / Income Gap (%) | 939 | 42.65% |
| Wage / Income Gap ($) | 939 | 57.35¢ per $1 |
| Gini / Inequality Index | 939 | 0.42 |
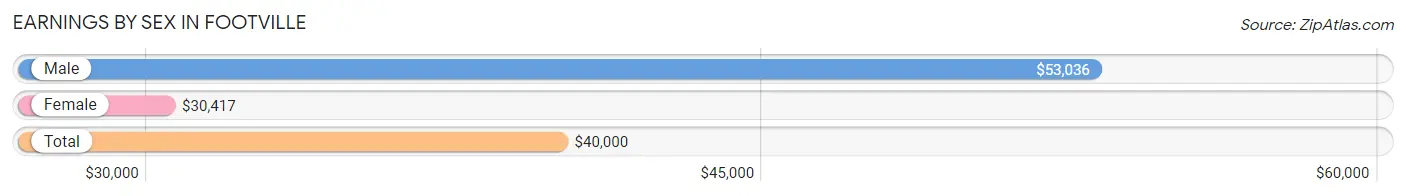
Earnings by Sex in Footville
Average Earnings in Footville are $40,000, $53,036 for men and $30,417 for women, a difference of 42.6%.
| Sex | Number | Average Earnings |
| Male | 257 (49.8%) | $53,036 |
| Female | 259 (50.2%) | $30,417 |
| Total | 516 (100.0%) | $40,000 |
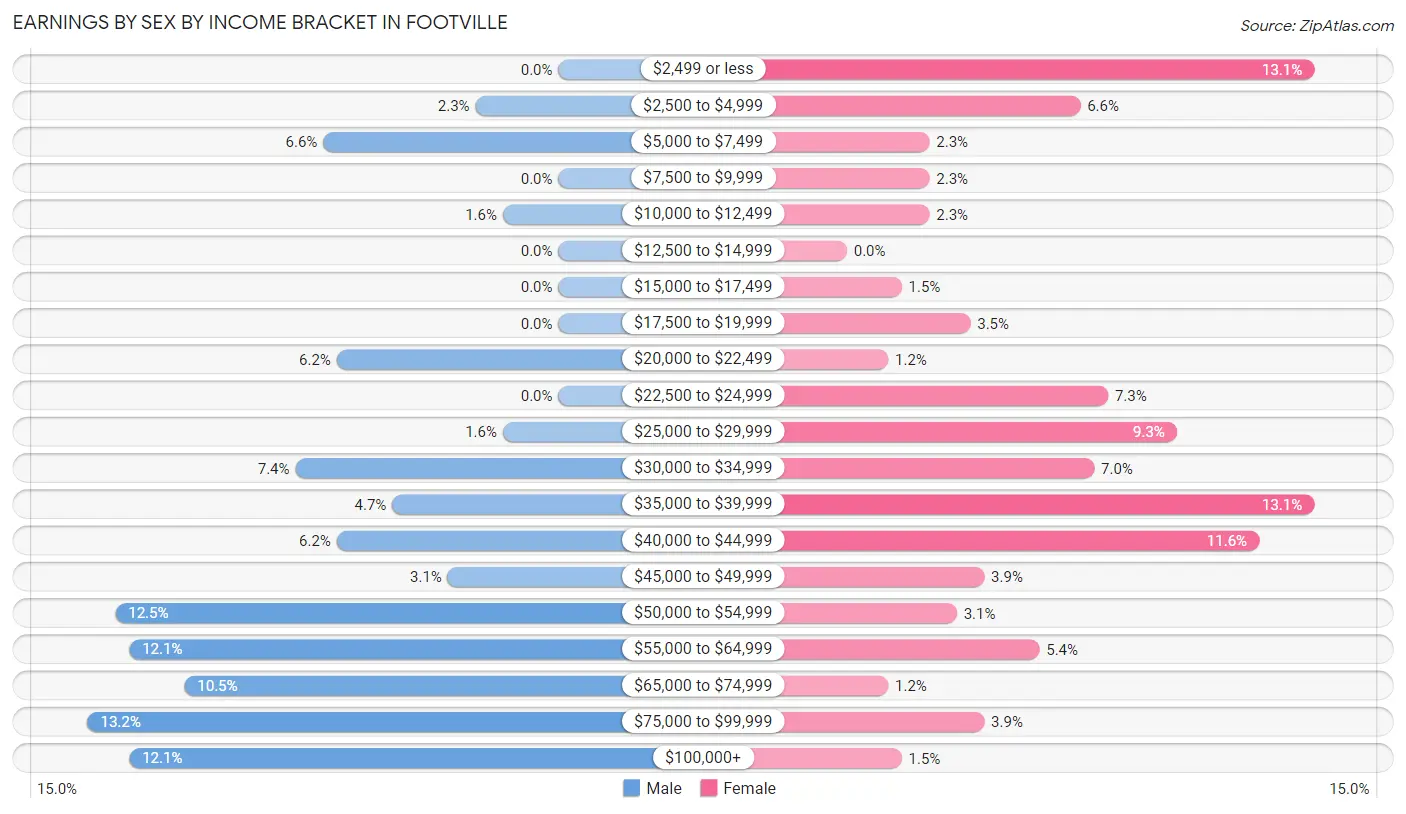
Earnings by Sex by Income Bracket in Footville
The most common earnings brackets in Footville are $75,000 to $99,999 for men (34 | 13.2%) and $2,499 or less for women (34 | 13.1%).
| Income | Male | Female |
| $2,499 or less | 0 (0.0%) | 34 (13.1%) |
| $2,500 to $4,999 | 6 (2.3%) | 17 (6.6%) |
| $5,000 to $7,499 | 17 (6.6%) | 6 (2.3%) |
| $7,500 to $9,999 | 0 (0.0%) | 6 (2.3%) |
| $10,000 to $12,499 | 4 (1.6%) | 6 (2.3%) |
| $12,500 to $14,999 | 0 (0.0%) | 0 (0.0%) |
| $15,000 to $17,499 | 0 (0.0%) | 4 (1.5%) |
| $17,500 to $19,999 | 0 (0.0%) | 9 (3.5%) |
| $20,000 to $22,499 | 16 (6.2%) | 3 (1.2%) |
| $22,500 to $24,999 | 0 (0.0%) | 19 (7.3%) |
| $25,000 to $29,999 | 4 (1.6%) | 24 (9.3%) |
| $30,000 to $34,999 | 19 (7.4%) | 18 (7.0%) |
| $35,000 to $39,999 | 12 (4.7%) | 34 (13.1%) |
| $40,000 to $44,999 | 16 (6.2%) | 30 (11.6%) |
| $45,000 to $49,999 | 8 (3.1%) | 10 (3.9%) |
| $50,000 to $54,999 | 32 (12.4%) | 8 (3.1%) |
| $55,000 to $64,999 | 31 (12.1%) | 14 (5.4%) |
| $65,000 to $74,999 | 27 (10.5%) | 3 (1.2%) |
| $75,000 to $99,999 | 34 (13.2%) | 10 (3.9%) |
| $100,000+ | 31 (12.1%) | 4 (1.5%) |
| Total | 257 (100.0%) | 259 (100.0%) |
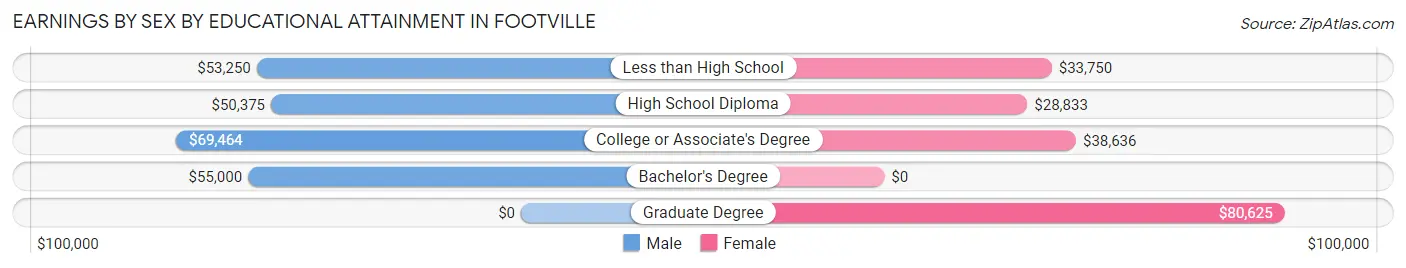
Earnings by Sex by Educational Attainment in Footville
Average earnings in Footville are $55,054 for men and $29,926 for women, a difference of 45.6%. Men with an educational attainment of college or associate's degree enjoy the highest average annual earnings of $69,464, while those with high school diploma education earn the least with $50,375. Women with an educational attainment of graduate degree earn the most with the average annual earnings of $80,625, while those with high school diploma education have the smallest earnings of $28,833.
| Educational Attainment | Male Income | Female Income |
| Less than High School | $53,250 | $33,750 |
| High School Diploma | $50,375 | $28,833 |
| College or Associate's Degree | $69,464 | $38,636 |
| Bachelor's Degree | $55,000 | $0 |
| Graduate Degree | - | - |
| Total | $55,054 | $29,926 |
Family Income in Footville
Family Income Brackets in Footville
According to the Footville family income data, there are 60 families falling into the $50,000 to $74,999 income range, which is the most common income bracket and makes up 25.1% of all families. Conversely, the $10,000 to $14,999 income bracket is the least frequent group with only 4 families (1.7%) belonging to this category.
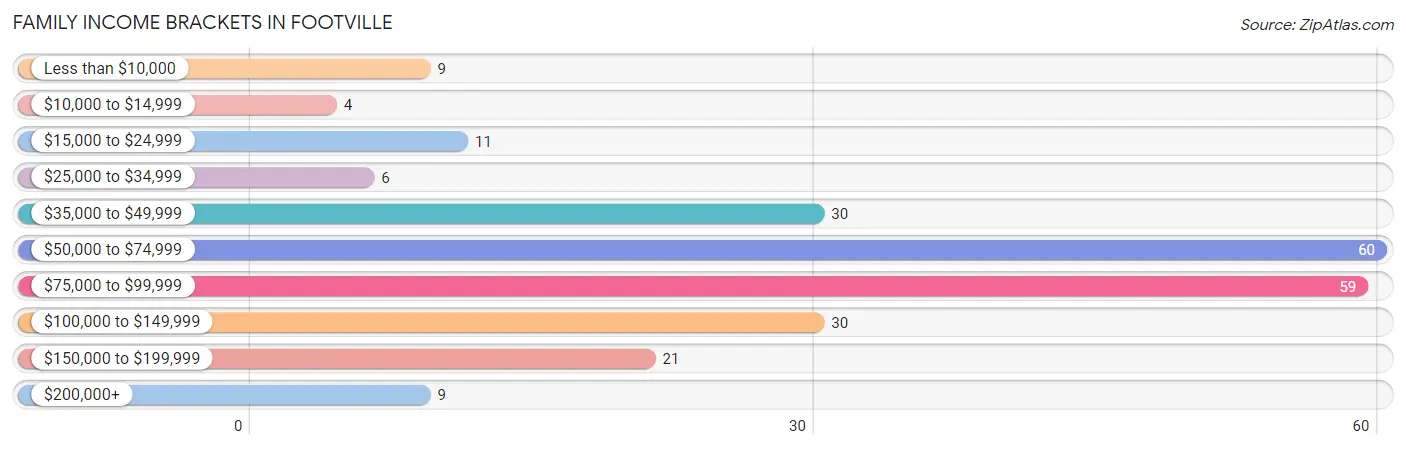
| Income Bracket | # Families | % Families |
| Less than $10,000 | 9 | 3.8% |
| $10,000 to $14,999 | 4 | 1.7% |
| $15,000 to $24,999 | 11 | 4.6% |
| $25,000 to $34,999 | 6 | 2.5% |
| $35,000 to $49,999 | 30 | 12.6% |
| $50,000 to $74,999 | 60 | 25.1% |
| $75,000 to $99,999 | 59 | 24.7% |
| $100,000 to $149,999 | 30 | 12.6% |
| $150,000 to $199,999 | 21 | 8.8% |
| $200,000+ | 9 | 3.8% |
Family Income by Famaliy Size in Footville
4-person families (43 | 18.0%) account for the highest median family income in Footville with $95,625 per family, while 2-person families (140 | 58.6%) have the highest median income of $31,000 per family member.
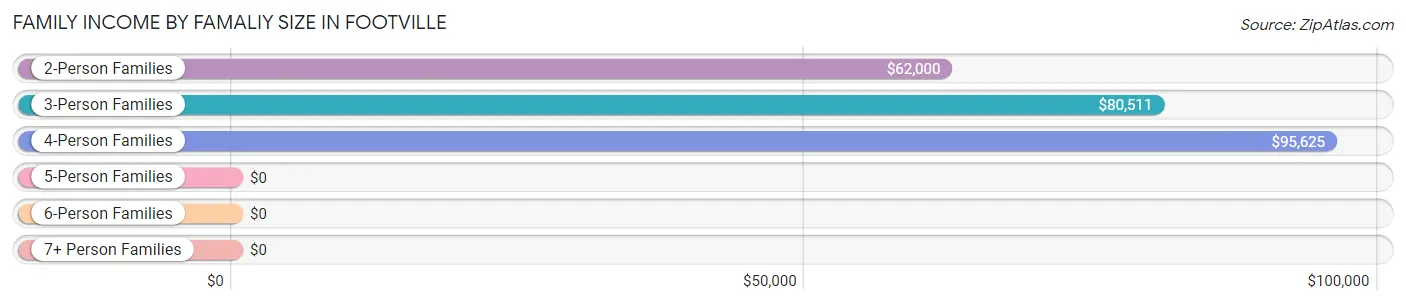
| Income Bracket | # Families | Median Income |
| 2-Person Families | 140 (58.6%) | $62,000 |
| 3-Person Families | 41 (17.2%) | $80,511 |
| 4-Person Families | 43 (18.0%) | $95,625 |
| 5-Person Families | 9 (3.8%) | $0 |
| 6-Person Families | 6 (2.5%) | $0 |
| 7+ Person Families | 0 (0.0%) | $0 |
| Total | 239 (100.0%) | $74,917 |
Family Income by Number of Earners in Footville
The median family income in Footville is $74,917, with families comprising 3+ earners (25) having the highest median family income of $151,058, while families with no earners (31) have the lowest median family income of $46,458, accounting for 10.5% and 13.0% of families, respectively.
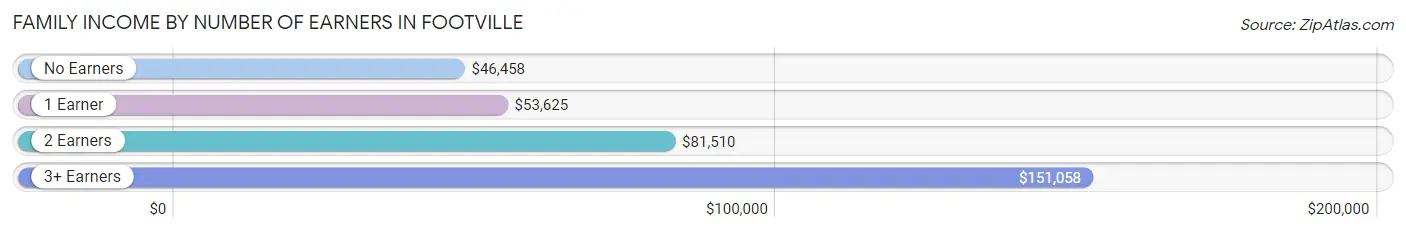
| Number of Earners | # Families | Median Income |
| No Earners | 31 (13.0%) | $46,458 |
| 1 Earner | 66 (27.6%) | $53,625 |
| 2 Earners | 117 (48.9%) | $81,510 |
| 3+ Earners | 25 (10.5%) | $151,058 |
| Total | 239 (100.0%) | $74,917 |
Household Income in Footville
Household Income Brackets in Footville
With 80 households falling in the category, the $50,000 to $74,999 income range is the most frequent in Footville, accounting for 20.1% of all households. In contrast, only 14 households (3.5%) fall into the $15,000 to $24,999 income bracket, making it the least populous group.
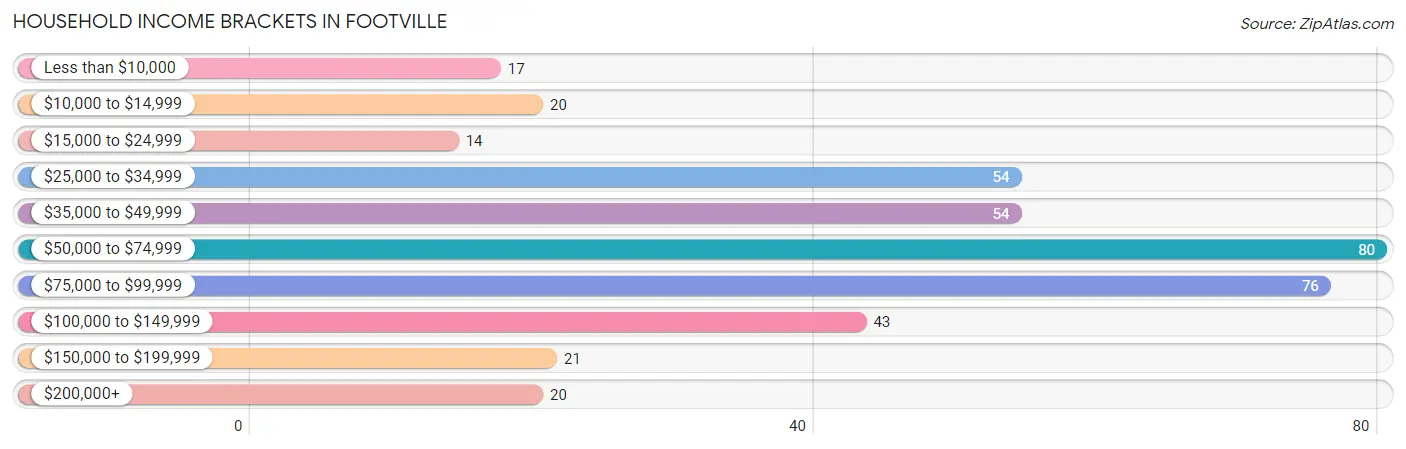
| Income Bracket | # Households | % Households |
| Less than $10,000 | 17 | 4.3% |
| $10,000 to $14,999 | 20 | 5.0% |
| $15,000 to $24,999 | 14 | 3.5% |
| $25,000 to $34,999 | 54 | 13.5% |
| $35,000 to $49,999 | 54 | 13.5% |
| $50,000 to $74,999 | 80 | 20.1% |
| $75,000 to $99,999 | 76 | 19.0% |
| $100,000 to $149,999 | 43 | 10.8% |
| $150,000 to $199,999 | 21 | 5.3% |
| $200,000+ | 20 | 5.0% |
Household Income by Householder Age in Footville
The median household income in Footville is $61,250, with the highest median household income of $80,417 found in the 45 to 64 years age bracket for the primary householder. A total of 115 households (28.8%) fall into this category. Meanwhile, the 65+ years age bracket for the primary householder has the lowest median household income of $40,500, with 132 households (33.1%) in this group.
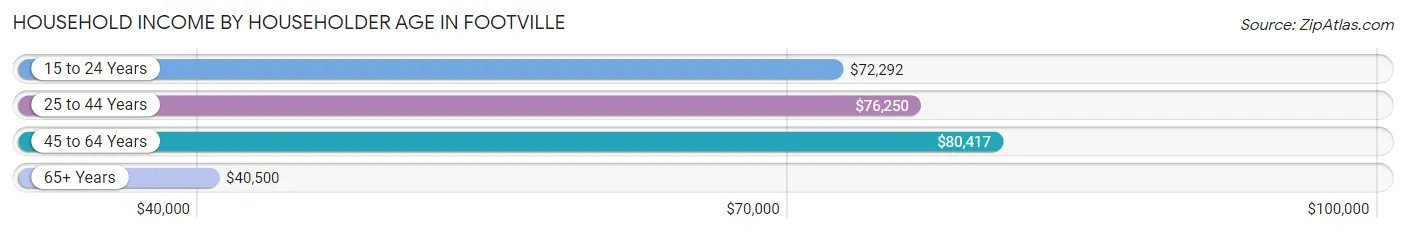
| Income Bracket | # Households | Median Income |
| 15 to 24 Years | 17 (4.3%) | $72,292 |
| 25 to 44 Years | 135 (33.8%) | $76,250 |
| 45 to 64 Years | 115 (28.8%) | $80,417 |
| 65+ Years | 132 (33.1%) | $40,500 |
| Total | 399 (100.0%) | $61,250 |
Poverty in Footville
Income Below Poverty by Sex and Age in Footville
With 6.1% poverty level for males and 8.9% for females among the residents of Footville, 55 to 64 year old males and 45 to 54 year old females are the most vulnerable to poverty, with 7 males (12.7%) and 6 females (25.0%) in their respective age groups living below the poverty level.
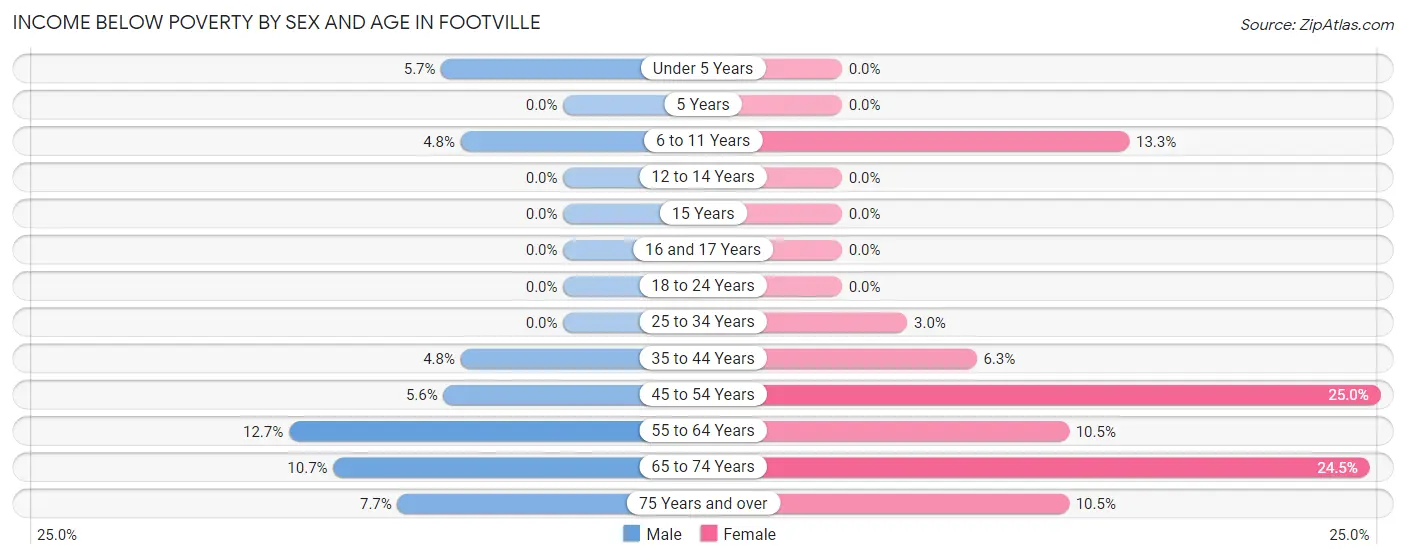
| Age Bracket | Male | Female |
| Under 5 Years | 3 (5.7%) | 0 (0.0%) |
| 5 Years | 0 (0.0%) | 0 (0.0%) |
| 6 to 11 Years | 2 (4.8%) | 2 (13.3%) |
| 12 to 14 Years | 0 (0.0%) | 0 (0.0%) |
| 15 Years | 0 (0.0%) | 0 (0.0%) |
| 16 and 17 Years | 0 (0.0%) | 0 (0.0%) |
| 18 to 24 Years | 0 (0.0%) | 0 (0.0%) |
| 25 to 34 Years | 0 (0.0%) | 3 (3.0%) |
| 35 to 44 Years | 2 (4.8%) | 3 (6.2%) |
| 45 to 54 Years | 3 (5.6%) | 6 (25.0%) |
| 55 to 64 Years | 7 (12.7%) | 8 (10.5%) |
| 65 to 74 Years | 8 (10.7%) | 12 (24.5%) |
| 75 Years and over | 6 (7.7%) | 2 (10.5%) |
| Total | 31 (6.1%) | 36 (8.9%) |
Income Above Poverty by Sex and Age in Footville
According to the poverty statistics in Footville, males aged 5 years and females aged under 5 years are the age groups that are most secure financially, with 100.0% of males and 100.0% of females in these age groups living above the poverty line.
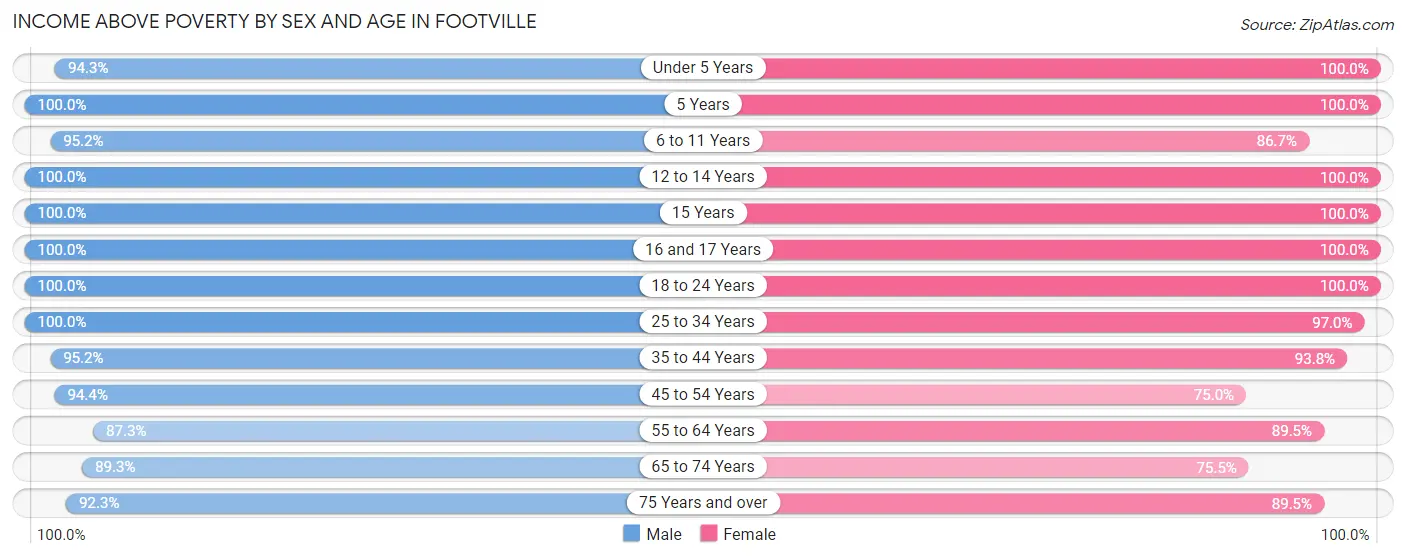
| Age Bracket | Male | Female |
| Under 5 Years | 50 (94.3%) | 27 (100.0%) |
| 5 Years | 7 (100.0%) | 3 (100.0%) |
| 6 to 11 Years | 40 (95.2%) | 13 (86.7%) |
| 12 to 14 Years | 3 (100.0%) | 20 (100.0%) |
| 15 Years | 4 (100.0%) | 3 (100.0%) |
| 16 and 17 Years | 9 (100.0%) | 2 (100.0%) |
| 18 to 24 Years | 12 (100.0%) | 20 (100.0%) |
| 25 to 34 Years | 70 (100.0%) | 96 (97.0%) |
| 35 to 44 Years | 40 (95.2%) | 45 (93.8%) |
| 45 to 54 Years | 51 (94.4%) | 18 (75.0%) |
| 55 to 64 Years | 48 (87.3%) | 68 (89.5%) |
| 65 to 74 Years | 67 (89.3%) | 37 (75.5%) |
| 75 Years and over | 72 (92.3%) | 17 (89.5%) |
| Total | 473 (93.9%) | 369 (91.1%) |
Income Below Poverty Among Married-Couple Families in Footville
The poverty statistics for married-couple families in Footville show that 4.4% or 8 of the total 181 families live below the poverty line. Families with no children have the highest poverty rate of 6.7%, comprising of 8 families. On the other hand, families with 1 or 2 children have the lowest poverty rate of 0.0%, which includes 0 families.
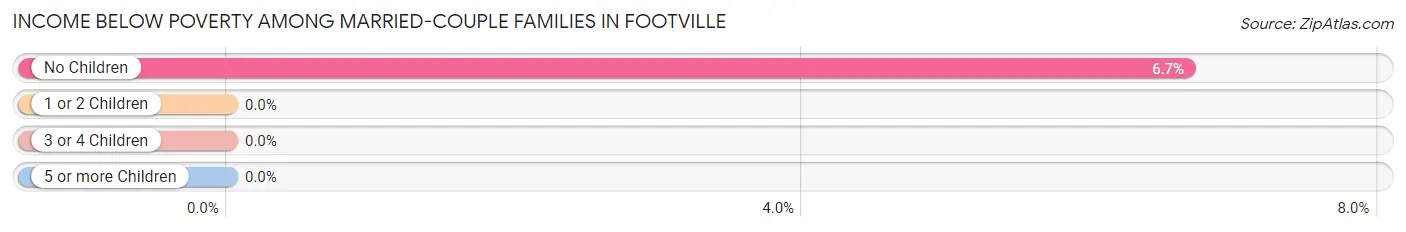
| Children | Above Poverty | Below Poverty |
| No Children | 112 (93.3%) | 8 (6.7%) |
| 1 or 2 Children | 52 (100.0%) | 0 (0.0%) |
| 3 or 4 Children | 9 (100.0%) | 0 (0.0%) |
| 5 or more Children | 0 (0.0%) | 0 (0.0%) |
| Total | 173 (95.6%) | 8 (4.4%) |
Income Below Poverty Among Single-Parent Households in Footville
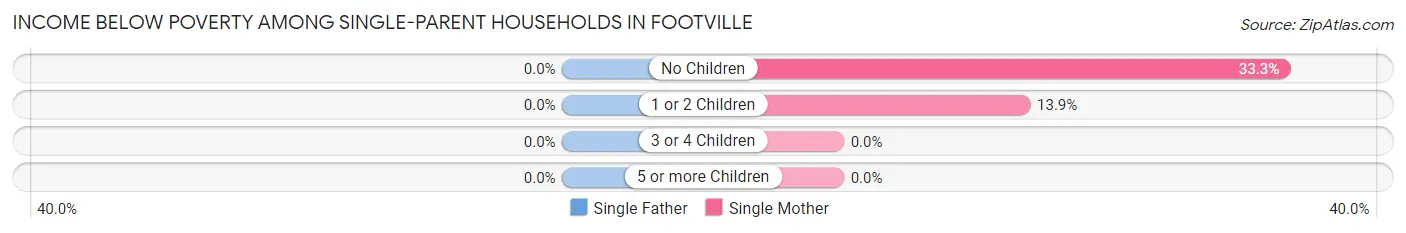
| Children | Single Father | Single Mother |
| No Children | 0 (0.0%) | 2 (33.3%) |
| 1 or 2 Children | 0 (0.0%) | 5 (13.9%) |
| 3 or 4 Children | 0 (0.0%) | 0 (0.0%) |
| 5 or more Children | 0 (0.0%) | 0 (0.0%) |
| Total | 0 (0.0%) | 7 (16.7%) |
Income Below Poverty Among Married-Couple vs Single-Parent Households in Footville
The poverty data for Footville shows that 8 of the married-couple family households (4.4%) and 7 of the single-parent households (12.1%) are living below the poverty level. Within the married-couple family households, those with no children have the highest poverty rate, with 8 households (6.7%) falling below the poverty line. Among the single-parent households, those with no children have the highest poverty rate, with 2 household (25.0%) living below poverty.
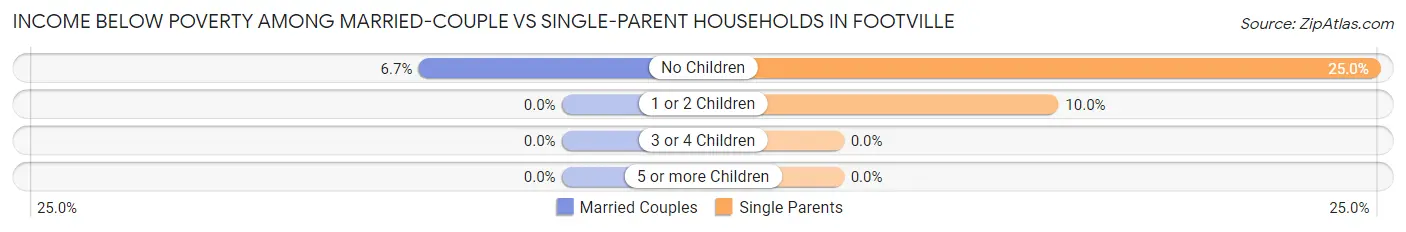
| Children | Married-Couple Families | Single-Parent Households |
| No Children | 8 (6.7%) | 2 (25.0%) |
| 1 or 2 Children | 0 (0.0%) | 5 (10.0%) |
| 3 or 4 Children | 0 (0.0%) | 0 (0.0%) |
| 5 or more Children | 0 (0.0%) | 0 (0.0%) |
| Total | 8 (4.4%) | 7 (12.1%) |
Race in Footville
The most populous races in Footville are White / Caucasian (896 | 95.4%), Hispanic or Latino (41 | 4.4%), and Two or more Races (38 | 4.1%).
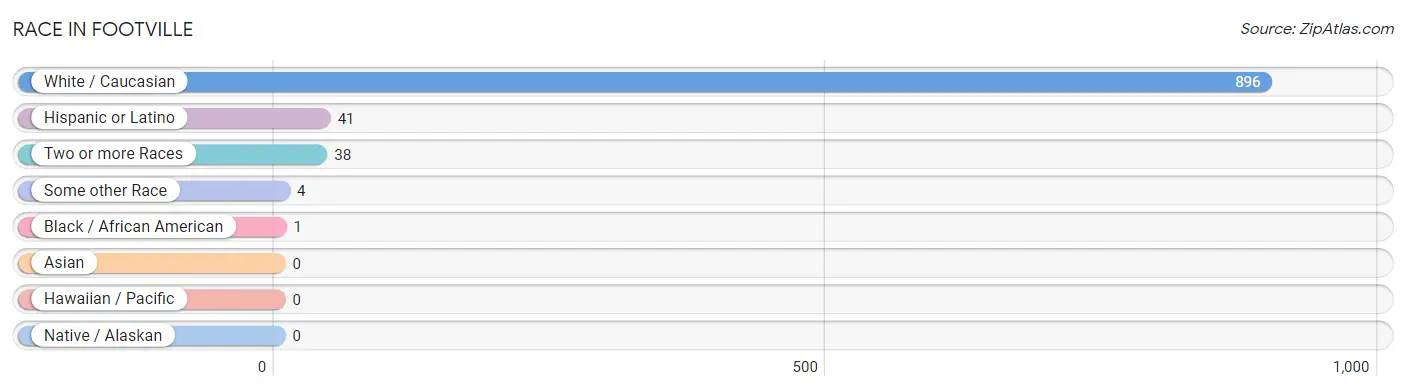
| Race | # Population | % Population |
| Asian | 0 | 0.0% |
| Black / African American | 1 | 0.1% |
| Hawaiian / Pacific | 0 | 0.0% |
| Hispanic or Latino | 41 | 4.4% |
| Native / Alaskan | 0 | 0.0% |
| White / Caucasian | 896 | 95.4% |
| Two or more Races | 38 | 4.1% |
| Some other Race | 4 | 0.4% |
| Total | 939 | 100.0% |
Ancestry in Footville
The most populous ancestries reported in Footville are German (379 | 40.4%), Irish (180 | 19.2%), Norwegian (111 | 11.8%), Swiss (77 | 8.2%), and European (53 | 5.6%), together accounting for 85.2% of all Footville residents.
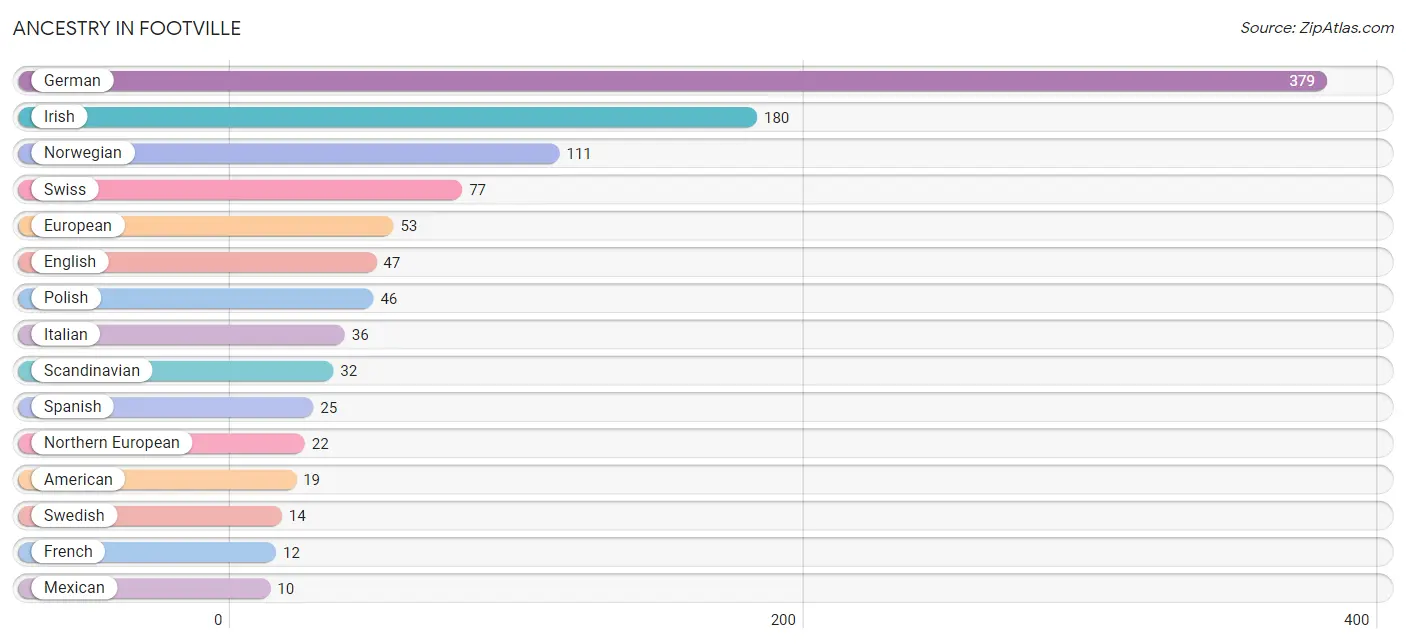
| Ancestry | # Population | % Population |
| American | 19 | 2.0% |
| Czech | 6 | 0.6% |
| Czechoslovakian | 6 | 0.6% |
| Danish | 6 | 0.6% |
| Dutch | 8 | 0.9% |
| English | 47 | 5.0% |
| European | 53 | 5.6% |
| French | 12 | 1.3% |
| French Canadian | 7 | 0.7% |
| German | 379 | 40.4% |
| Irish | 180 | 19.2% |
| Italian | 36 | 3.8% |
| Mexican | 10 | 1.1% |
| Northern European | 22 | 2.3% |
| Norwegian | 111 | 11.8% |
| Pennsylvania German | 1 | 0.1% |
| Polish | 46 | 4.9% |
| Puerto Rican | 6 | 0.6% |
| Scandinavian | 32 | 3.4% |
| Scotch-Irish | 2 | 0.2% |
| Scottish | 9 | 1.0% |
| Spanish | 25 | 2.7% |
| Swedish | 14 | 1.5% |
| Swiss | 77 | 8.2% |
| Welsh | 4 | 0.4% | View All 25 Rows |
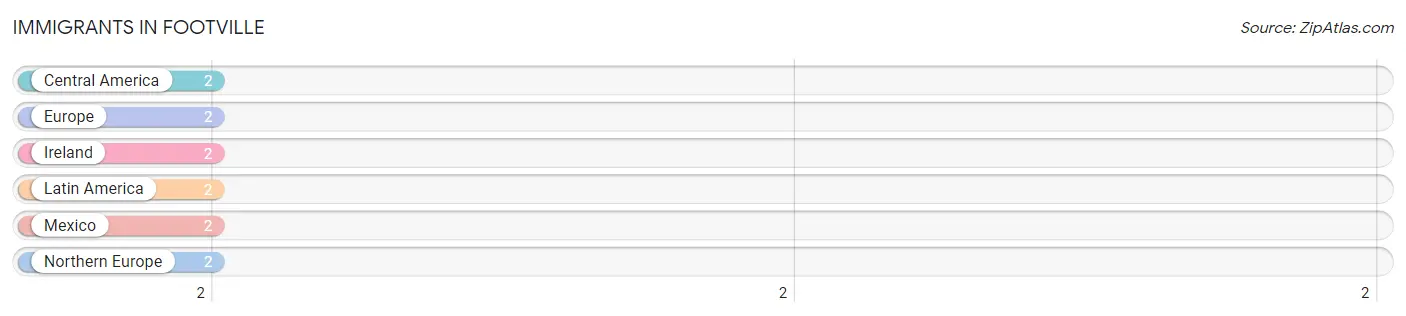
Immigrants in Footville
The most numerous immigrant groups reported in Footville came from Central America (2 | 0.2%), Europe (2 | 0.2%), Ireland (2 | 0.2%), Latin America (2 | 0.2%), and Mexico (2 | 0.2%), together accounting for 1.0% of all Footville residents.
| Immigration Origin | # Population | % Population |
| Central America | 2 | 0.2% |
| Europe | 2 | 0.2% |
| Ireland | 2 | 0.2% |
| Latin America | 2 | 0.2% |
| Mexico | 2 | 0.2% |
| Northern Europe | 2 | 0.2% | View All 6 Rows |
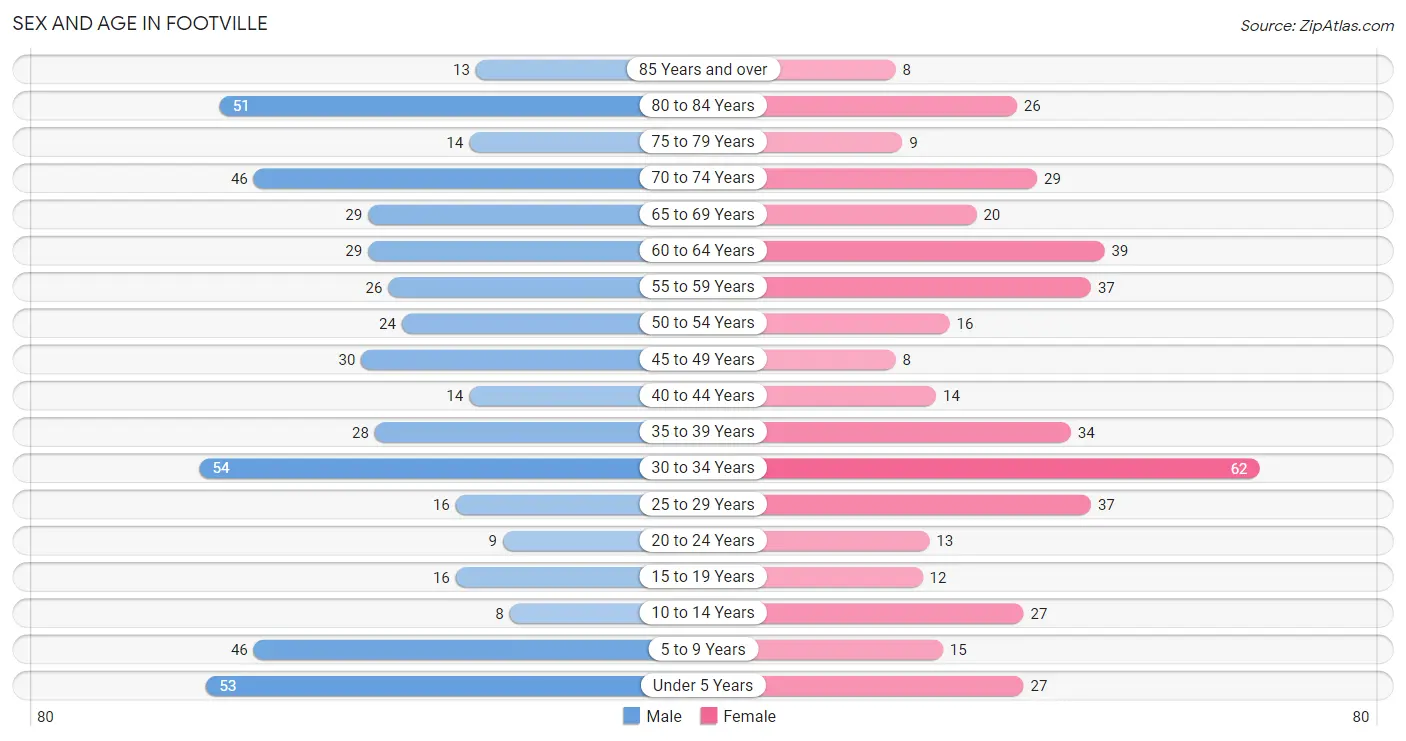
Sex and Age in Footville
Sex and Age in Footville
The most populous age groups in Footville are 30 to 34 Years (54 | 10.7%) for men and 30 to 34 Years (62 | 14.3%) for women.
| Age Bracket | Male | Female |
| Under 5 Years | 53 (10.5%) | 27 (6.2%) |
| 5 to 9 Years | 46 (9.1%) | 15 (3.5%) |
| 10 to 14 Years | 8 (1.6%) | 27 (6.2%) |
| 15 to 19 Years | 16 (3.2%) | 12 (2.8%) |
| 20 to 24 Years | 9 (1.8%) | 13 (3.0%) |
| 25 to 29 Years | 16 (3.2%) | 37 (8.6%) |
| 30 to 34 Years | 54 (10.7%) | 62 (14.3%) |
| 35 to 39 Years | 28 (5.5%) | 34 (7.9%) |
| 40 to 44 Years | 14 (2.8%) | 14 (3.2%) |
| 45 to 49 Years | 30 (5.9%) | 8 (1.8%) |
| 50 to 54 Years | 24 (4.7%) | 16 (3.7%) |
| 55 to 59 Years | 26 (5.1%) | 37 (8.6%) |
| 60 to 64 Years | 29 (5.7%) | 39 (9.0%) |
| 65 to 69 Years | 29 (5.7%) | 20 (4.6%) |
| 70 to 74 Years | 46 (9.1%) | 29 (6.7%) |
| 75 to 79 Years | 14 (2.8%) | 9 (2.1%) |
| 80 to 84 Years | 51 (10.1%) | 26 (6.0%) |
| 85 Years and over | 13 (2.6%) | 8 (1.8%) |
| Total | 506 (100.0%) | 433 (100.0%) |
Families and Households in Footville
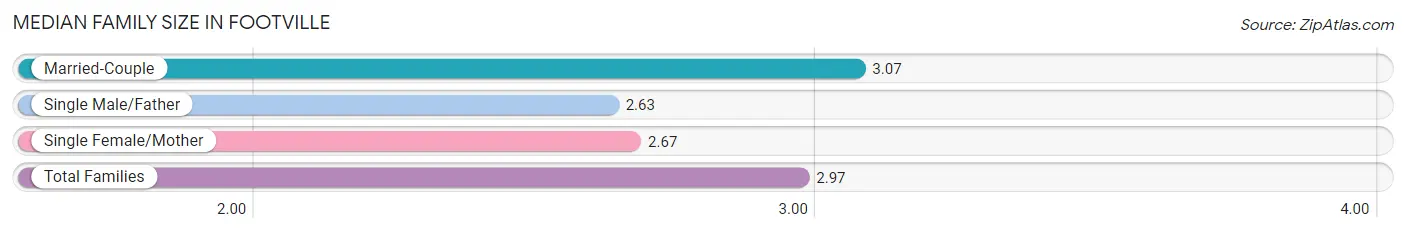
Median Family Size in Footville
The median family size in Footville is 2.97 persons per family, with married-couple families (181 | 75.7%) accounting for the largest median family size of 3.07 persons per family. On the other hand, single male/father families (16 | 6.7%) represent the smallest median family size with 2.63 persons per family.
| Family Type | # Families | Family Size |
| Married-Couple | 181 (75.7%) | 3.07 |
| Single Male/Father | 16 (6.7%) | 2.63 |
| Single Female/Mother | 42 (17.6%) | 2.67 |
| Total Families | 239 (100.0%) | 2.97 |
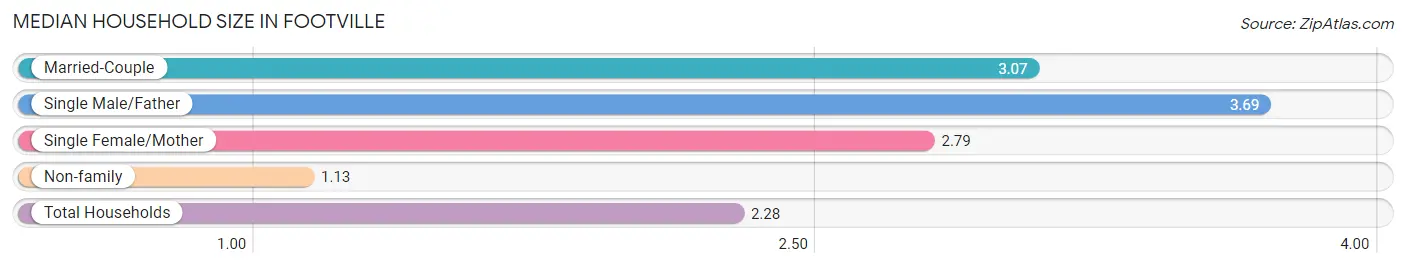
Median Household Size in Footville
The median household size in Footville is 2.28 persons per household, with single male/father households (16 | 4.0%) accounting for the largest median household size of 3.69 persons per household. non-family households (160 | 40.1%) represent the smallest median household size with 1.13 persons per household.
| Household Type | # Households | Household Size |
| Married-Couple | 181 (45.4%) | 3.07 |
| Single Male/Father | 16 (4.0%) | 3.69 |
| Single Female/Mother | 42 (10.5%) | 2.79 |
| Non-family | 160 (40.1%) | 1.13 |
| Total Households | 399 (100.0%) | 2.28 |
Household Size by Marriage Status in Footville
Out of a total of 399 households in Footville, 239 (59.9%) are family households, while 160 (40.1%) are nonfamily households. The most numerous type of family households are 2-person households, comprising 136, and the most common type of nonfamily households are 1-person households, comprising 142.
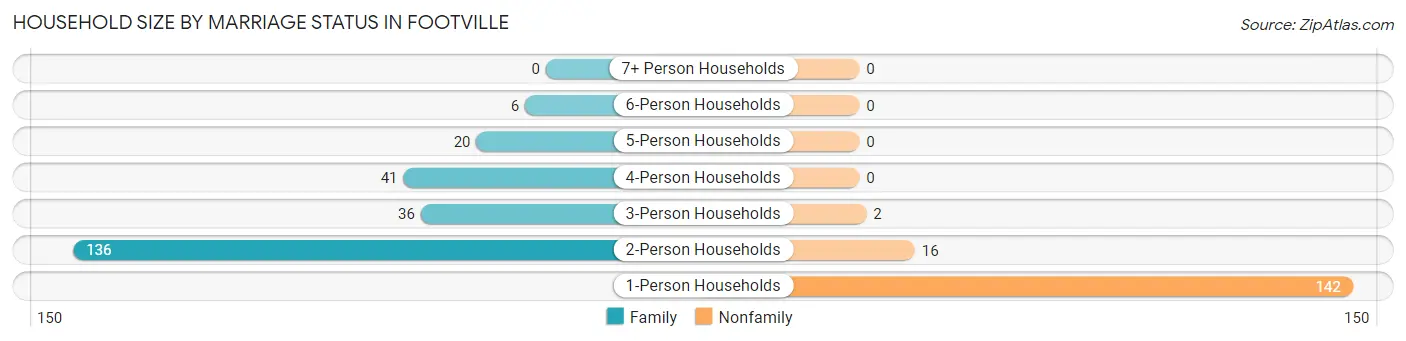
| Household Size | Family Households | Nonfamily Households |
| 1-Person Households | - | 142 (35.6%) |
| 2-Person Households | 136 (34.1%) | 16 (4.0%) |
| 3-Person Households | 36 (9.0%) | 2 (0.5%) |
| 4-Person Households | 41 (10.3%) | 0 (0.0%) |
| 5-Person Households | 20 (5.0%) | 0 (0.0%) |
| 6-Person Households | 6 (1.5%) | 0 (0.0%) |
| 7+ Person Households | 0 (0.0%) | 0 (0.0%) |
| Total | 239 (59.9%) | 160 (40.1%) |
Female Fertility in Footville
Fertility by Age in Footville
Average fertility rate in Footville is 146.0 births per 1,000 women. Women in the age bracket of 20 to 34 years have the highest fertility rate with 241.0 births per 1,000 women. Women in the age bracket of 20 to 34 years acount for 100.0% of all women with births.
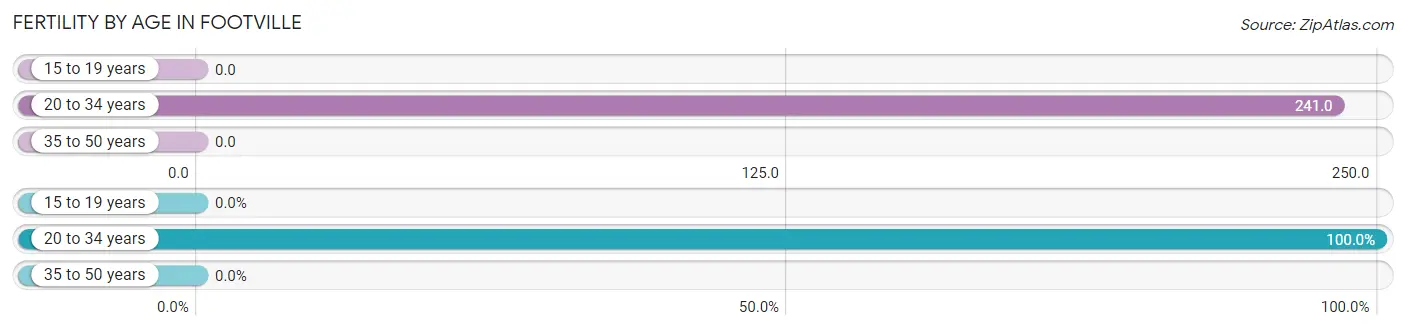
| Age Bracket | Women with Births | Births / 1,000 Women |
| 15 to 19 years | 0 (0.0%) | 0.0 |
| 20 to 34 years | 27 (100.0%) | 241.0 |
| 35 to 50 years | 0 (0.0%) | 0.0 |
| Total | 27 (100.0%) | 146.0 |
Fertility by Age by Marriage Status in Footville
88.9% of women with births (27) in Footville are married. The highest percentage of unmarried women with births falls into 20 to 34 years age bracket with 11.1% of them unmarried at the time of birth, while the lowest percentage of unmarried women with births belong to 20 to 34 years age bracket with 11.1% of them unmarried.
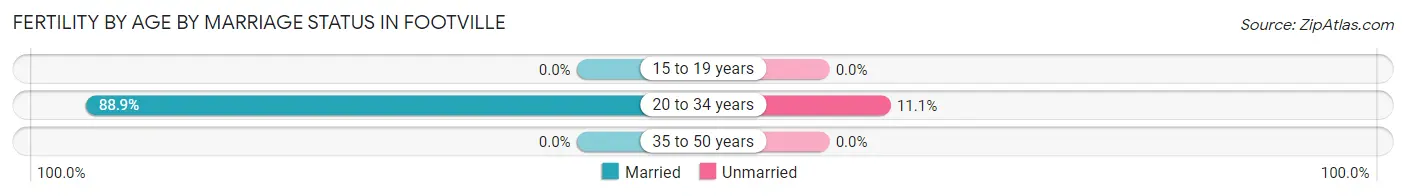
| Age Bracket | Married | Unmarried |
| 15 to 19 years | 0 (0.0%) | 0 (0.0%) |
| 20 to 34 years | 24 (88.9%) | 3 (11.1%) |
| 35 to 50 years | 0 (0.0%) | 0 (0.0%) |
| Total | 24 (88.9%) | 3 (11.1%) |
Fertility by Education in Footville
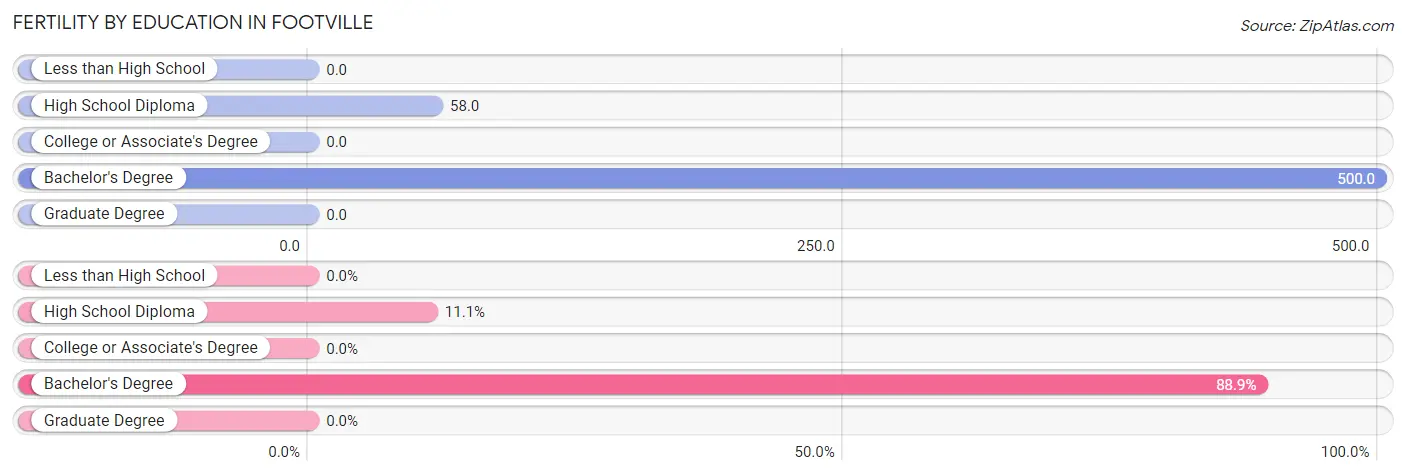
| Educational Attainment | Women with Births | Births / 1,000 Women |
| Less than High School | 0 (0.0%) | 0.0 |
| High School Diploma | 3 (11.1%) | 58.0 |
| College or Associate's Degree | 0 (0.0%) | 0.0 |
| Bachelor's Degree | 24 (88.9%) | 500.0 |
| Graduate Degree | 0 (0.0%) | 0.0 |
| Total | 27 (100.0%) | 146.0 |
Fertility by Education by Marriage Status in Footville
11.1% of women with births in Footville are unmarried. Women with the educational attainment of bachelor's degree are most likely to be married with 100.0% of them married at childbirth, while women with the educational attainment of high school diploma are least likely to be married with 100.0% of them unmarried at childbirth.
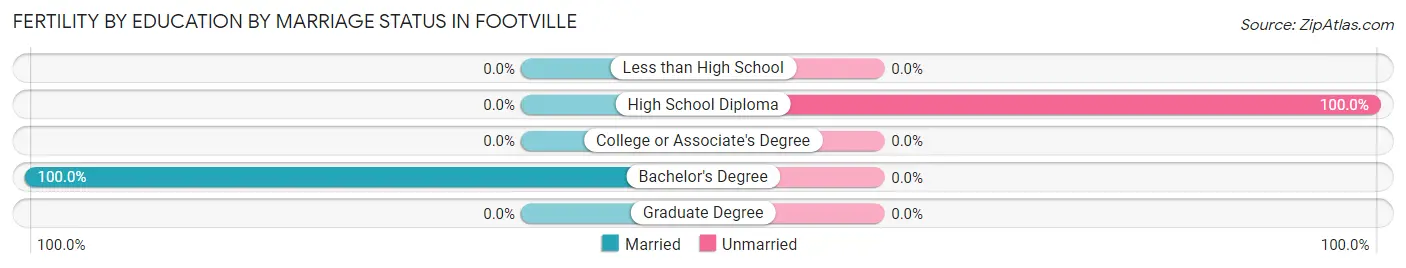
| Educational Attainment | Married | Unmarried |
| Less than High School | 0 (0.0%) | 0 (0.0%) |
| High School Diploma | 0 (0.0%) | 3 (100.0%) |
| College or Associate's Degree | 0 (0.0%) | 0 (0.0%) |
| Bachelor's Degree | 24 (100.0%) | 0 (0.0%) |
| Graduate Degree | 0 (0.0%) | 0 (0.0%) |
| Total | 24 (88.9%) | 3 (11.1%) |
Employment Characteristics in Footville
Employment by Class of Employer in Footville
Among the 439 employed individuals in Footville, private company employees (317 | 72.2%), not-for-profit organizations (34 | 7.7%), and local government employees (28 | 6.4%) make up the most common classes of employment.
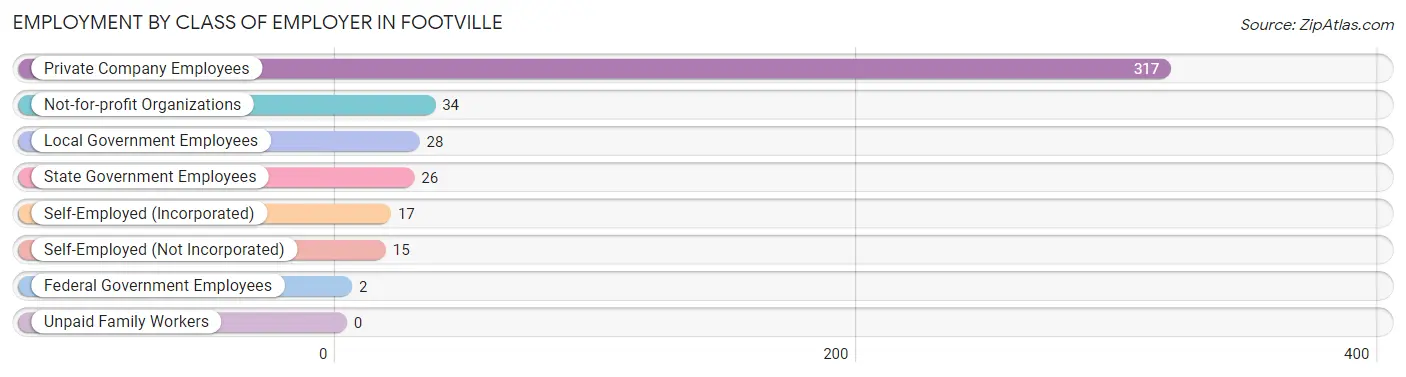
| Employer Class | # Employees | % Employees |
| Private Company Employees | 317 | 72.2% |
| Self-Employed (Incorporated) | 17 | 3.9% |
| Self-Employed (Not Incorporated) | 15 | 3.4% |
| Not-for-profit Organizations | 34 | 7.7% |
| Local Government Employees | 28 | 6.4% |
| State Government Employees | 26 | 5.9% |
| Federal Government Employees | 2 | 0.5% |
| Unpaid Family Workers | 0 | 0.0% |
| Total | 439 | 100.0% |
Employment Status by Age in Footville
According to the labor force statistics for Footville, out of the total population over 16 years of age (756), 62.4% or 472 individuals are in the labor force, with 3.0% or 14 of them unemployed. The age group with the highest labor force participation rate is 20 to 24 years, with 100.0% or 22 individuals in the labor force. Within the labor force, the 45 to 54 years age range has the highest percentage of unemployed individuals, with 16.9% or 12 of them being unemployed.
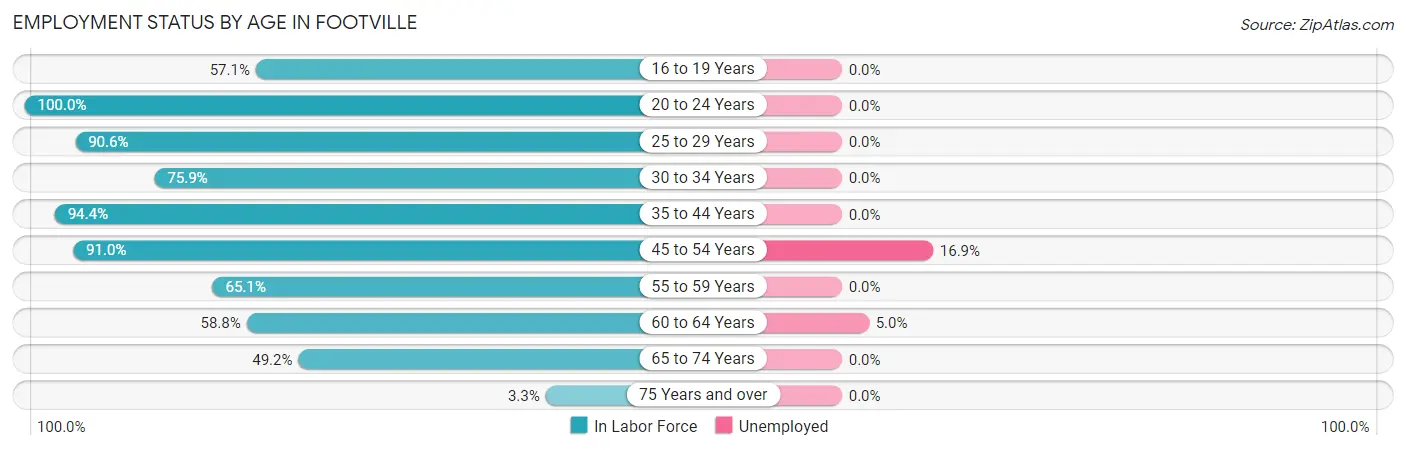
| Age Bracket | In Labor Force | Unemployed |
| 16 to 19 Years | 12 (57.1%) | 0 (0.0%) |
| 20 to 24 Years | 22 (100.0%) | 0 (0.0%) |
| 25 to 29 Years | 48 (90.6%) | 0 (0.0%) |
| 30 to 34 Years | 88 (75.9%) | 0 (0.0%) |
| 35 to 44 Years | 85 (94.4%) | 0 (0.0%) |
| 45 to 54 Years | 71 (91.0%) | 12 (16.9%) |
| 55 to 59 Years | 41 (65.1%) | 0 (0.0%) |
| 60 to 64 Years | 40 (58.8%) | 2 (5.0%) |
| 65 to 74 Years | 61 (49.2%) | 0 (0.0%) |
| 75 Years and over | 4 (3.3%) | 0 (0.0%) |
| Total | 472 (62.4%) | 14 (3.0%) |
Employment Status by Educational Attainment in Footville
According to labor force statistics for Footville, 79.7% of individuals (373) out of the total population between 25 and 64 years of age (468) are in the labor force, with 3.8% or 14 of them being unemployed. The group with the highest labor force participation rate are those with the educational attainment of college / associate degree, with 85.9% or 176 individuals in the labor force. Within the labor force, individuals with less than high school education have the highest percentage of unemployment, with 13.3% or 2 of them being unemployed.
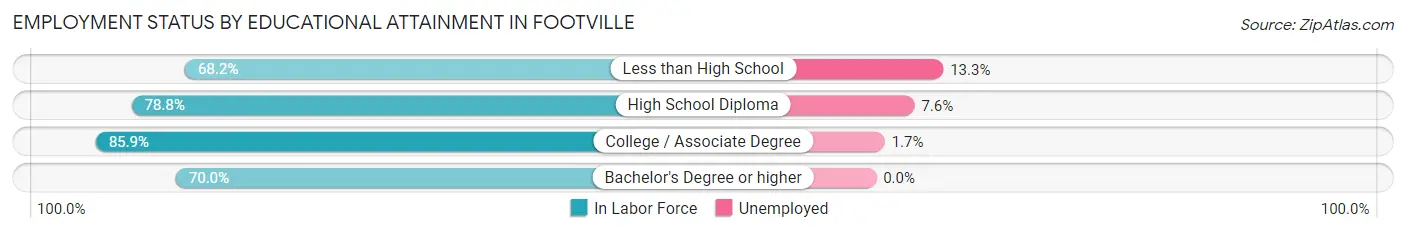
| Educational Attainment | In Labor Force | Unemployed |
| Less than High School | 15 (68.2%) | 3 (13.3%) |
| High School Diploma | 119 (78.8%) | 11 (7.6%) |
| College / Associate Degree | 176 (85.9%) | 3 (1.7%) |
| Bachelor's Degree or higher | 63 (70.0%) | 0 (0.0%) |
| Total | 373 (79.7%) | 18 (3.8%) |
Employment Occupations by Sex in Footville
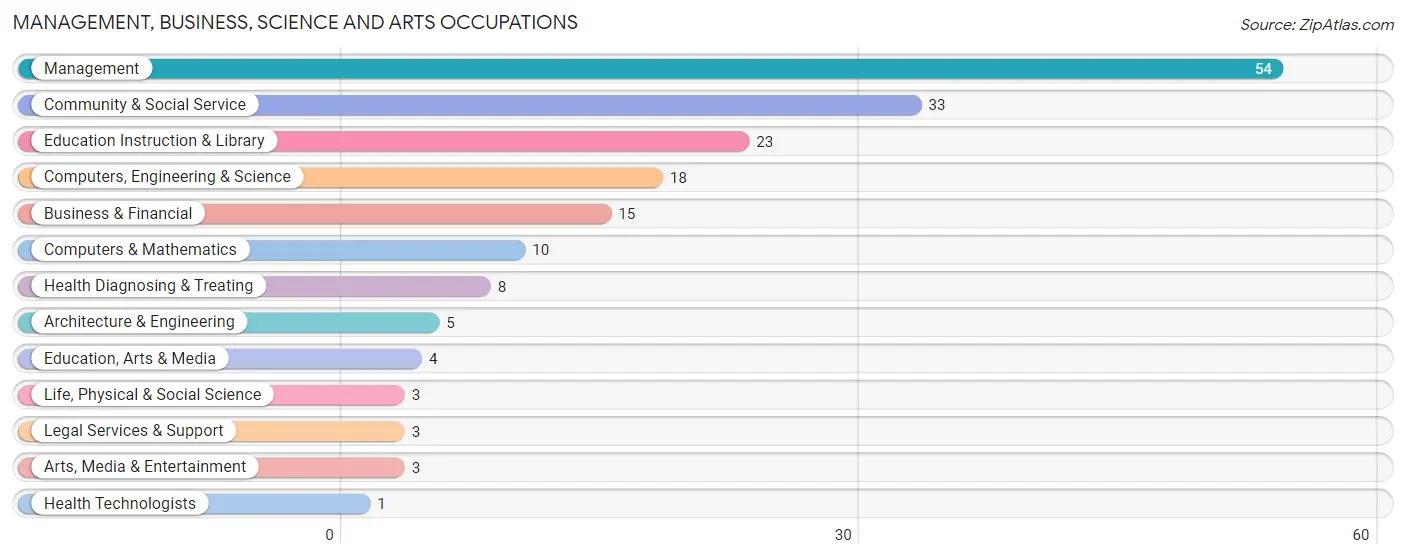
Management, Business, Science and Arts Occupations
The most common Management, Business, Science and Arts occupations in Footville are Management (54 | 11.8%), Community & Social Service (33 | 7.2%), Education Instruction & Library (23 | 5.0%), Computers, Engineering & Science (18 | 4.0%), and Business & Financial (15 | 3.3%).
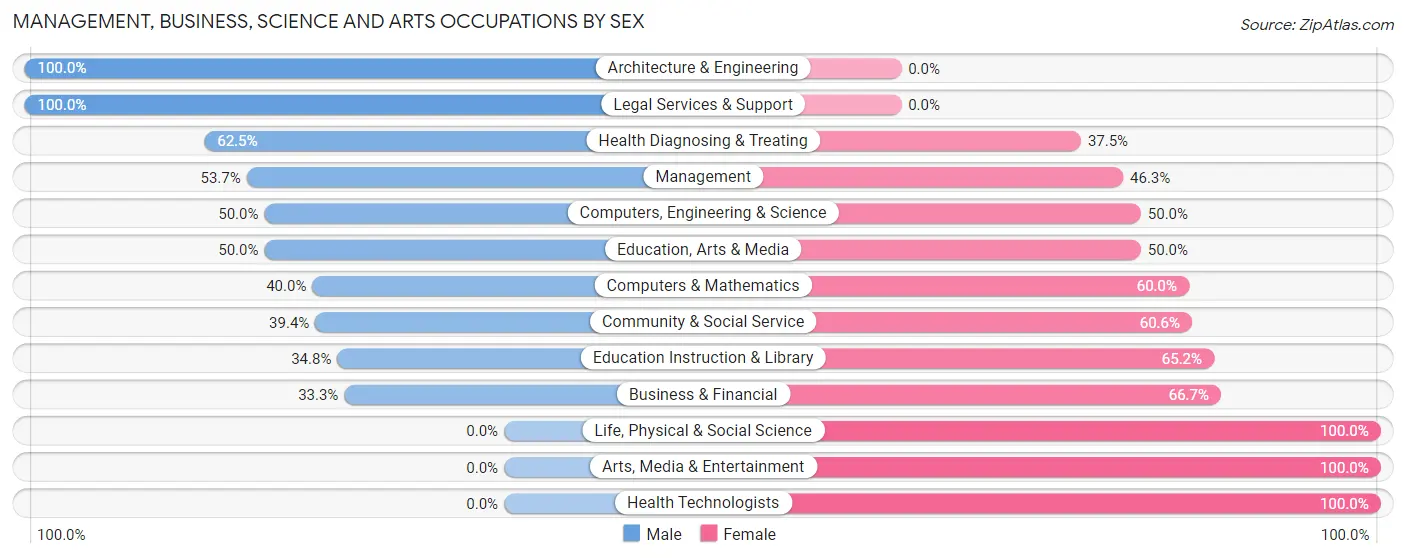
Management, Business, Science and Arts Occupations by Sex
Within the Management, Business, Science and Arts occupations in Footville, the most male-oriented occupations are Architecture & Engineering (100.0%), Legal Services & Support (100.0%), and Health Diagnosing & Treating (62.5%), while the most female-oriented occupations are Life, Physical & Social Science (100.0%), Arts, Media & Entertainment (100.0%), and Health Technologists (100.0%).
| Occupation | Male | Female |
| Management | 29 (53.7%) | 25 (46.3%) |
| Business & Financial | 5 (33.3%) | 10 (66.7%) |
| Computers, Engineering & Science | 9 (50.0%) | 9 (50.0%) |
| Computers & Mathematics | 4 (40.0%) | 6 (60.0%) |
| Architecture & Engineering | 5 (100.0%) | 0 (0.0%) |
| Life, Physical & Social Science | 0 (0.0%) | 3 (100.0%) |
| Community & Social Service | 13 (39.4%) | 20 (60.6%) |
| Education, Arts & Media | 2 (50.0%) | 2 (50.0%) |
| Legal Services & Support | 3 (100.0%) | 0 (0.0%) |
| Education Instruction & Library | 8 (34.8%) | 15 (65.2%) |
| Arts, Media & Entertainment | 0 (0.0%) | 3 (100.0%) |
| Health Diagnosing & Treating | 5 (62.5%) | 3 (37.5%) |
| Health Technologists | 0 (0.0%) | 1 (100.0%) |
| Total (Category) | 61 (47.7%) | 67 (52.3%) |
| Total (Overall) | 244 (53.5%) | 212 (46.5%) |
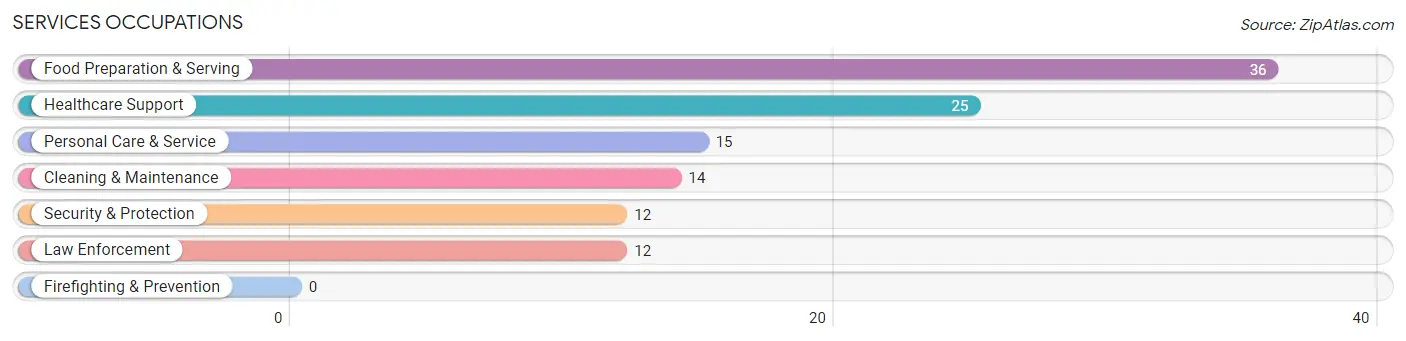
Services Occupations
The most common Services occupations in Footville are Food Preparation & Serving (36 | 7.9%), Healthcare Support (25 | 5.5%), Personal Care & Service (15 | 3.3%), Cleaning & Maintenance (14 | 3.1%), and Security & Protection (12 | 2.6%).
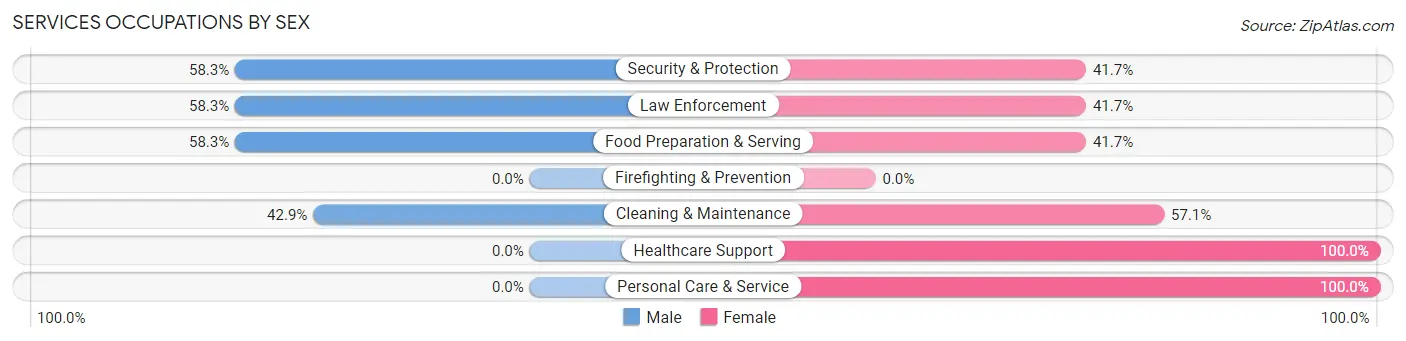
Services Occupations by Sex
Within the Services occupations in Footville, the most male-oriented occupations are Security & Protection (58.3%), Law Enforcement (58.3%), and Food Preparation & Serving (58.3%), while the most female-oriented occupations are Healthcare Support (100.0%), Personal Care & Service (100.0%), and Cleaning & Maintenance (57.1%).
| Occupation | Male | Female |
| Healthcare Support | 0 (0.0%) | 25 (100.0%) |
| Security & Protection | 7 (58.3%) | 5 (41.7%) |
| Firefighting & Prevention | 0 (0.0%) | 0 (0.0%) |
| Law Enforcement | 7 (58.3%) | 5 (41.7%) |
| Food Preparation & Serving | 21 (58.3%) | 15 (41.7%) |
| Cleaning & Maintenance | 6 (42.9%) | 8 (57.1%) |
| Personal Care & Service | 0 (0.0%) | 15 (100.0%) |
| Total (Category) | 34 (33.3%) | 68 (66.7%) |
| Total (Overall) | 244 (53.5%) | 212 (46.5%) |
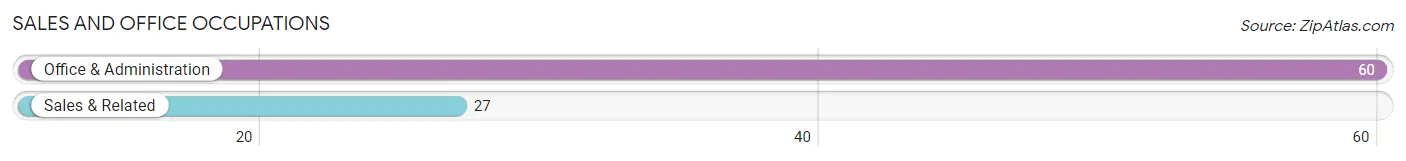
Sales and Office Occupations
The most common Sales and Office occupations in Footville are Office & Administration (60 | 13.2%), and Sales & Related (27 | 5.9%).
Sales and Office Occupations by Sex
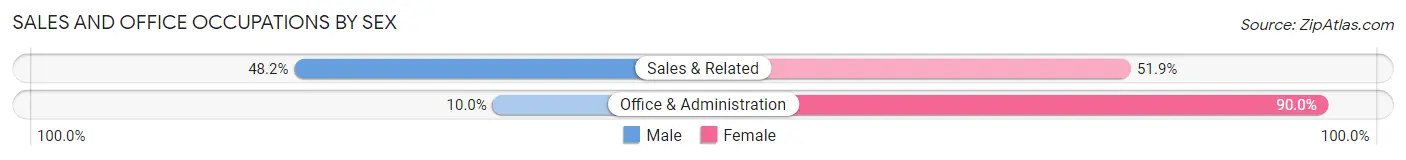
| Occupation | Male | Female |
| Sales & Related | 13 (48.1%) | 14 (51.8%) |
| Office & Administration | 6 (10.0%) | 54 (90.0%) |
| Total (Category) | 19 (21.8%) | 68 (78.2%) |
| Total (Overall) | 244 (53.5%) | 212 (46.5%) |
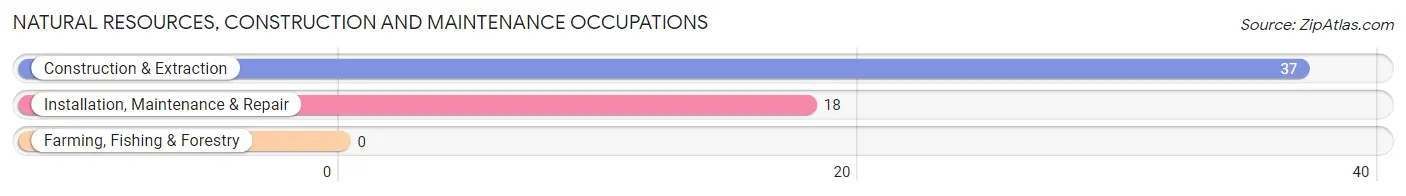
Natural Resources, Construction and Maintenance Occupations
The most common Natural Resources, Construction and Maintenance occupations in Footville are Construction & Extraction (37 | 8.1%), and Installation, Maintenance & Repair (18 | 4.0%).
Natural Resources, Construction and Maintenance Occupations by Sex
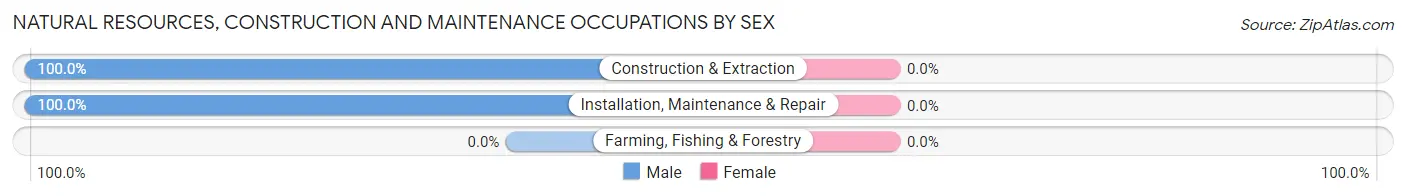
| Occupation | Male | Female |
| Farming, Fishing & Forestry | 0 (0.0%) | 0 (0.0%) |
| Construction & Extraction | 37 (100.0%) | 0 (0.0%) |
| Installation, Maintenance & Repair | 18 (100.0%) | 0 (0.0%) |
| Total (Category) | 55 (100.0%) | 0 (0.0%) |
| Total (Overall) | 244 (53.5%) | 212 (46.5%) |
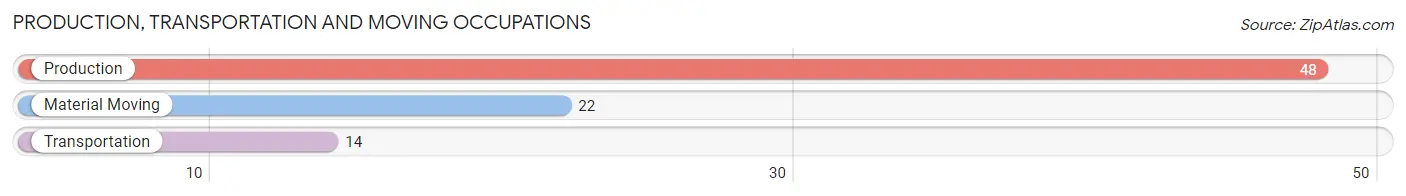
Production, Transportation and Moving Occupations
The most common Production, Transportation and Moving occupations in Footville are Production (48 | 10.5%), Material Moving (22 | 4.8%), and Transportation (14 | 3.1%).
Production, Transportation and Moving Occupations by Sex
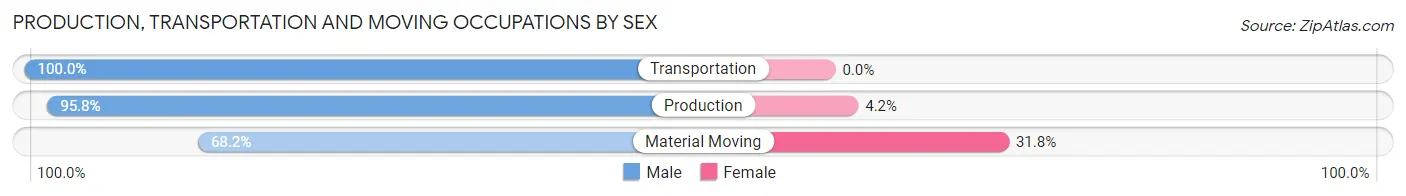
| Occupation | Male | Female |
| Production | 46 (95.8%) | 2 (4.2%) |
| Transportation | 14 (100.0%) | 0 (0.0%) |
| Material Moving | 15 (68.2%) | 7 (31.8%) |
| Total (Category) | 75 (89.3%) | 9 (10.7%) |
| Total (Overall) | 244 (53.5%) | 212 (46.5%) |
Employment Industries by Sex in Footville
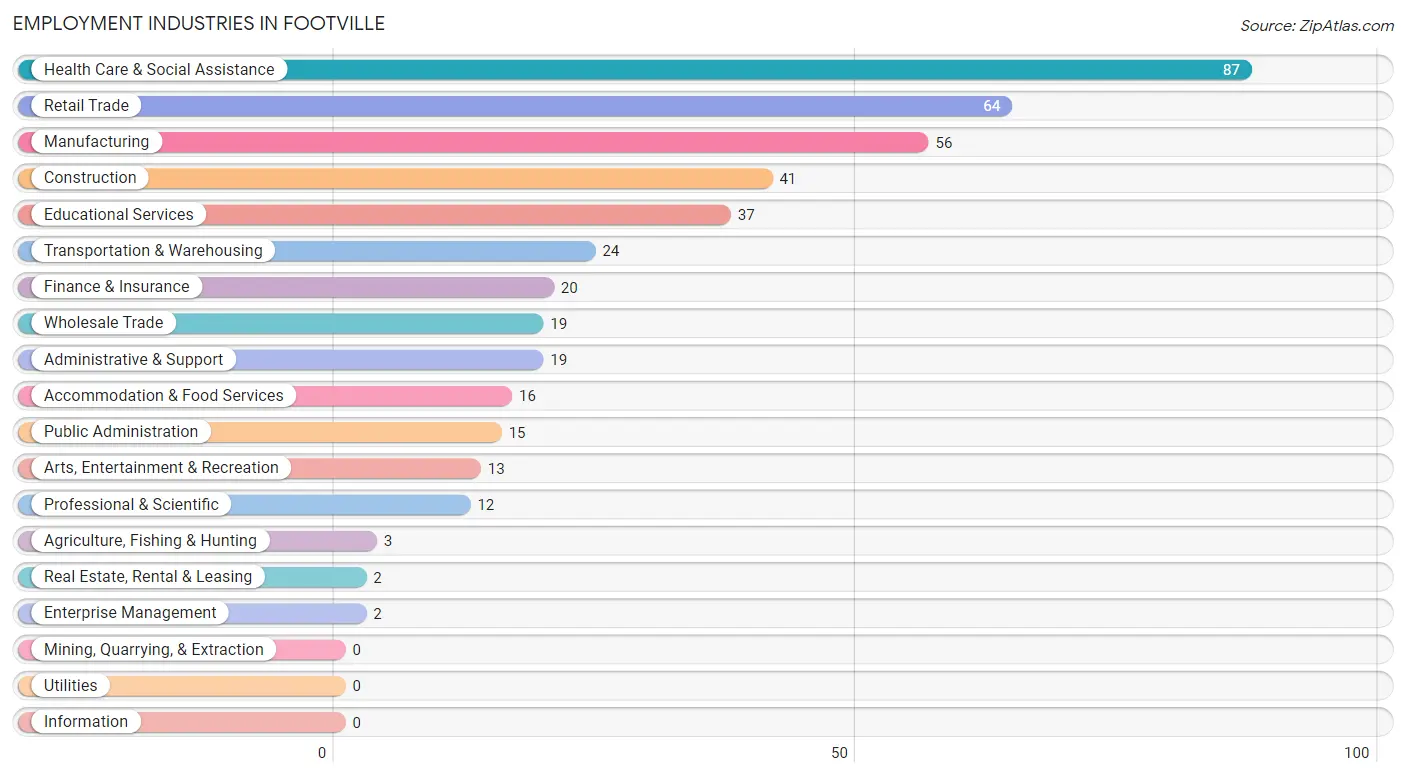
Employment Industries in Footville
The major employment industries in Footville include Health Care & Social Assistance (87 | 19.1%), Retail Trade (64 | 14.0%), Manufacturing (56 | 12.3%), Construction (41 | 9.0%), and Educational Services (37 | 8.1%).
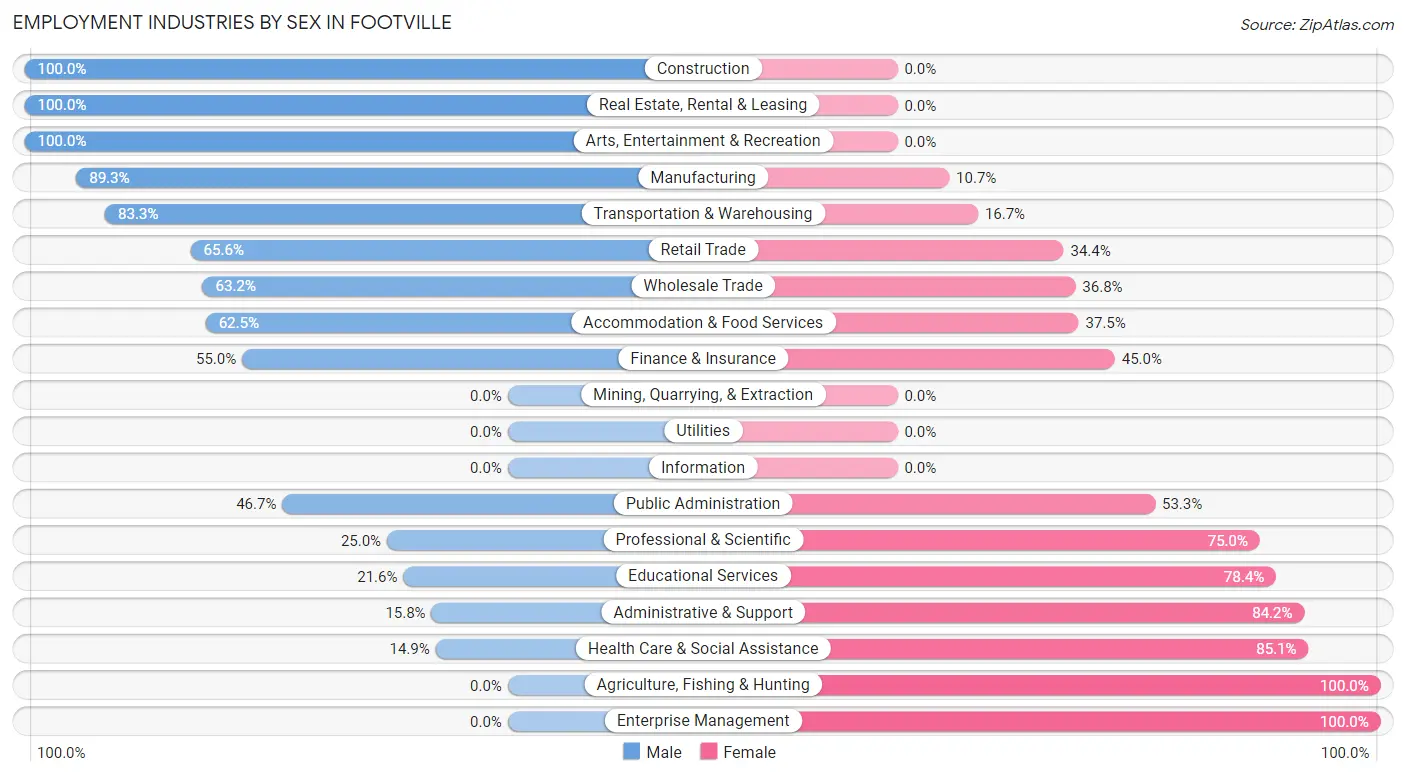
Employment Industries by Sex in Footville
The Footville industries that see more men than women are Construction (100.0%), Real Estate, Rental & Leasing (100.0%), and Arts, Entertainment & Recreation (100.0%), whereas the industries that tend to have a higher number of women are Agriculture, Fishing & Hunting (100.0%), Enterprise Management (100.0%), and Health Care & Social Assistance (85.1%).
| Industry | Male | Female |
| Agriculture, Fishing & Hunting | 0 (0.0%) | 3 (100.0%) |
| Mining, Quarrying, & Extraction | 0 (0.0%) | 0 (0.0%) |
| Construction | 41 (100.0%) | 0 (0.0%) |
| Manufacturing | 50 (89.3%) | 6 (10.7%) |
| Wholesale Trade | 12 (63.2%) | 7 (36.8%) |
| Retail Trade | 42 (65.6%) | 22 (34.4%) |
| Transportation & Warehousing | 20 (83.3%) | 4 (16.7%) |
| Utilities | 0 (0.0%) | 0 (0.0%) |
| Information | 0 (0.0%) | 0 (0.0%) |
| Finance & Insurance | 11 (55.0%) | 9 (45.0%) |
| Real Estate, Rental & Leasing | 2 (100.0%) | 0 (0.0%) |
| Professional & Scientific | 3 (25.0%) | 9 (75.0%) |
| Enterprise Management | 0 (0.0%) | 2 (100.0%) |
| Administrative & Support | 3 (15.8%) | 16 (84.2%) |
| Educational Services | 8 (21.6%) | 29 (78.4%) |
| Health Care & Social Assistance | 13 (14.9%) | 74 (85.1%) |
| Arts, Entertainment & Recreation | 13 (100.0%) | 0 (0.0%) |
| Accommodation & Food Services | 10 (62.5%) | 6 (37.5%) |
| Public Administration | 7 (46.7%) | 8 (53.3%) |
| Total | 244 (53.5%) | 212 (46.5%) |
Education in Footville
School Enrollment in Footville
The most common levels of schooling among the 130 students in Footville are elementary school (40 | 30.8%), high school (25 | 19.2%), and middle school (22 | 16.9%).
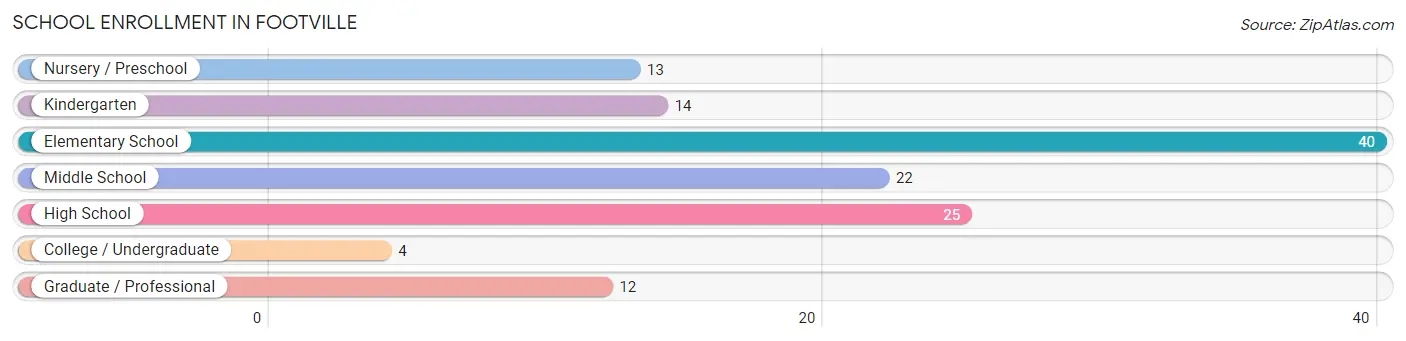
| School Level | # Students | % Students |
| Nursery / Preschool | 13 | 10.0% |
| Kindergarten | 14 | 10.8% |
| Elementary School | 40 | 30.8% |
| Middle School | 22 | 16.9% |
| High School | 25 | 19.2% |
| College / Undergraduate | 4 | 3.1% |
| Graduate / Professional | 12 | 9.2% |
| Total | 130 | 100.0% |
School Enrollment by Age by Funding Source in Footville
Out of a total of 130 students who are enrolled in schools in Footville, 2 (1.5%) attend a private institution, while the remaining 128 (98.5%) are enrolled in public schools. The age group of 15 to 17 year olds has the highest likelihood of being enrolled in private schools, with 2 (11.1% in the age bracket) enrolled. Conversely, the age group of 3 to 4 year olds has the lowest likelihood of being enrolled in a private school, with 10 (100.0% in the age bracket) attending a public institution.
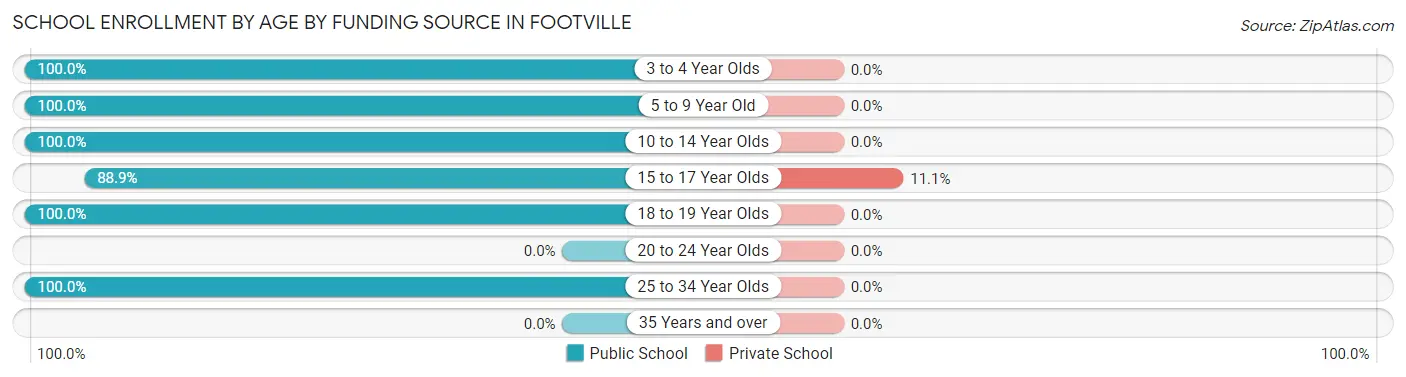
| Age Bracket | Public School | Private School |
| 3 to 4 Year Olds | 10 (100.0%) | 0 (0.0%) |
| 5 to 9 Year Old | 52 (100.0%) | 0 (0.0%) |
| 10 to 14 Year Olds | 29 (100.0%) | 0 (0.0%) |
| 15 to 17 Year Olds | 16 (88.9%) | 2 (11.1%) |
| 18 to 19 Year Olds | 5 (100.0%) | 0 (0.0%) |
| 20 to 24 Year Olds | 0 (0.0%) | 0 (0.0%) |
| 25 to 34 Year Olds | 16 (100.0%) | 0 (0.0%) |
| 35 Years and over | 0 (0.0%) | 0 (0.0%) |
| Total | 128 (98.5%) | 2 (1.5%) |
Educational Attainment by Field of Study in Footville
Business (39 | 37.9%), education (12 | 11.7%), arts & humanities (10 | 9.7%), science & technology (8 | 7.8%), and computers & mathematics (7 | 6.8%) are the most common fields of study among 103 individuals in Footville who have obtained a bachelor's degree or higher.
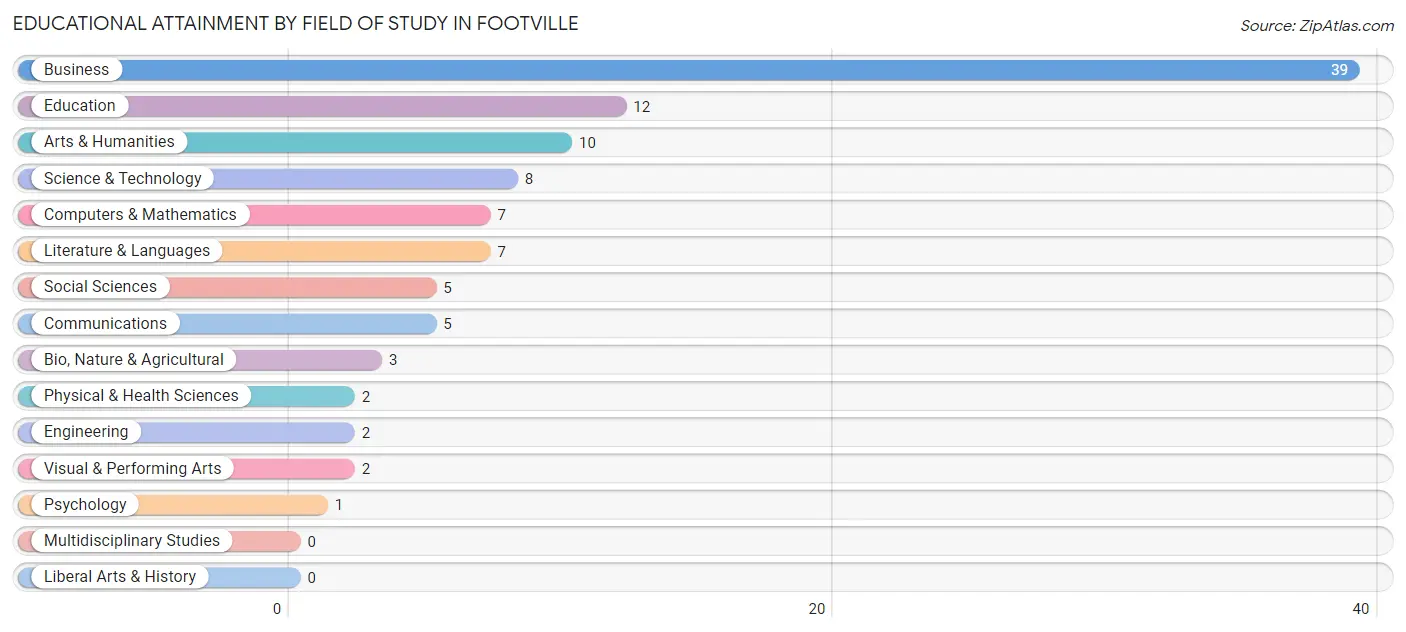
| Field of Study | # Graduates | % Graduates |
| Computers & Mathematics | 7 | 6.8% |
| Bio, Nature & Agricultural | 3 | 2.9% |
| Physical & Health Sciences | 2 | 1.9% |
| Psychology | 1 | 1.0% |
| Social Sciences | 5 | 4.9% |
| Engineering | 2 | 1.9% |
| Multidisciplinary Studies | 0 | 0.0% |
| Science & Technology | 8 | 7.8% |
| Business | 39 | 37.9% |
| Education | 12 | 11.7% |
| Literature & Languages | 7 | 6.8% |
| Liberal Arts & History | 0 | 0.0% |
| Visual & Performing Arts | 2 | 1.9% |
| Communications | 5 | 4.9% |
| Arts & Humanities | 10 | 9.7% |
| Total | 103 | 100.0% |
Transportation & Commute in Footville
Vehicle Availability by Sex in Footville
The most prevalent vehicle ownership categories in Footville are males with 2 vehicles (122, accounting for 50.8%) and females with 2 vehicles (91, making up 61.6%).
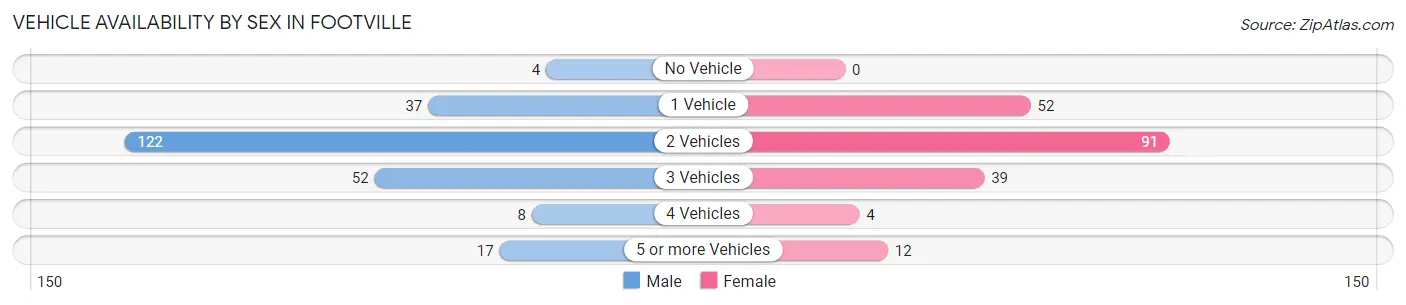
| Vehicles Available | Male | Female |
| No Vehicle | 4 (1.7%) | 0 (0.0%) |
| 1 Vehicle | 37 (15.4%) | 52 (26.3%) |
| 2 Vehicles | 122 (50.8%) | 91 (46.0%) |
| 3 Vehicles | 52 (21.7%) | 39 (19.7%) |
| 4 Vehicles | 8 (3.3%) | 4 (2.0%) |
| 5 or more Vehicles | 17 (7.1%) | 12 (6.1%) |
| Total | 240 (100.0%) | 198 (100.0%) |
Commute Time in Footville
The most frequently occuring commute durations in Footville are 20 to 24 minutes (134 commuters, 32.3%), 15 to 19 minutes (64 commuters, 15.4%), and 45 to 59 minutes (49 commuters, 11.8%).
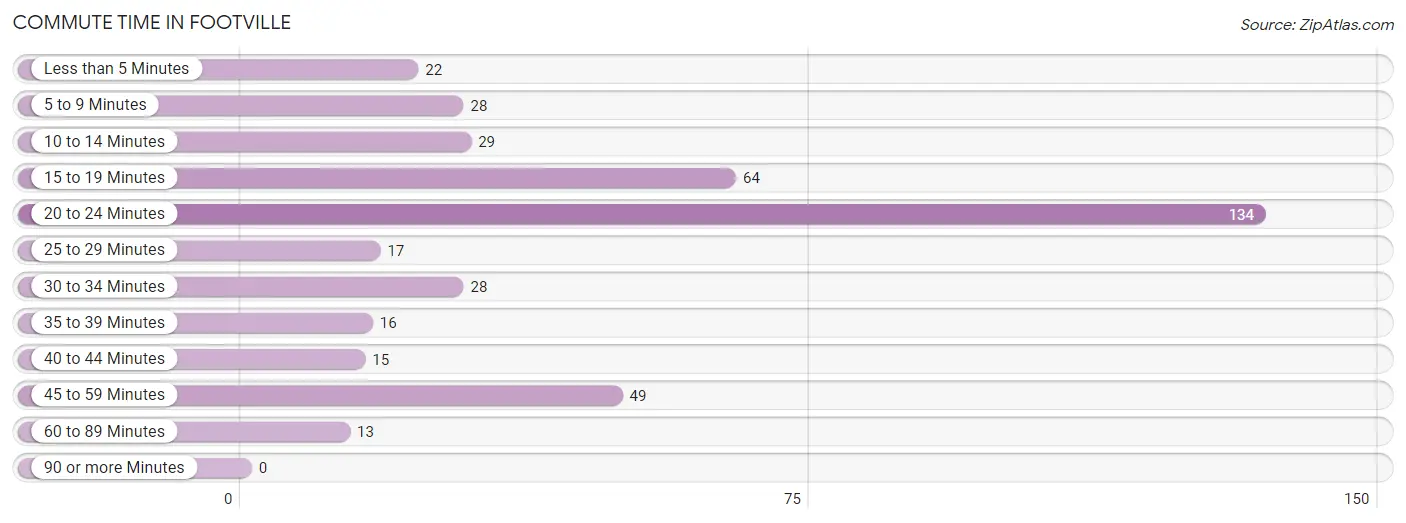
| Commute Time | # Commuters | % Commuters |
| Less than 5 Minutes | 22 | 5.3% |
| 5 to 9 Minutes | 28 | 6.8% |
| 10 to 14 Minutes | 29 | 7.0% |
| 15 to 19 Minutes | 64 | 15.4% |
| 20 to 24 Minutes | 134 | 32.3% |
| 25 to 29 Minutes | 17 | 4.1% |
| 30 to 34 Minutes | 28 | 6.8% |
| 35 to 39 Minutes | 16 | 3.9% |
| 40 to 44 Minutes | 15 | 3.6% |
| 45 to 59 Minutes | 49 | 11.8% |
| 60 to 89 Minutes | 13 | 3.1% |
| 90 or more Minutes | 0 | 0.0% |
Commute Time by Sex in Footville
The most common commute times in Footville are 20 to 24 minutes (92 commuters, 38.7%) for males and 20 to 24 minutes (42 commuters, 23.7%) for females.
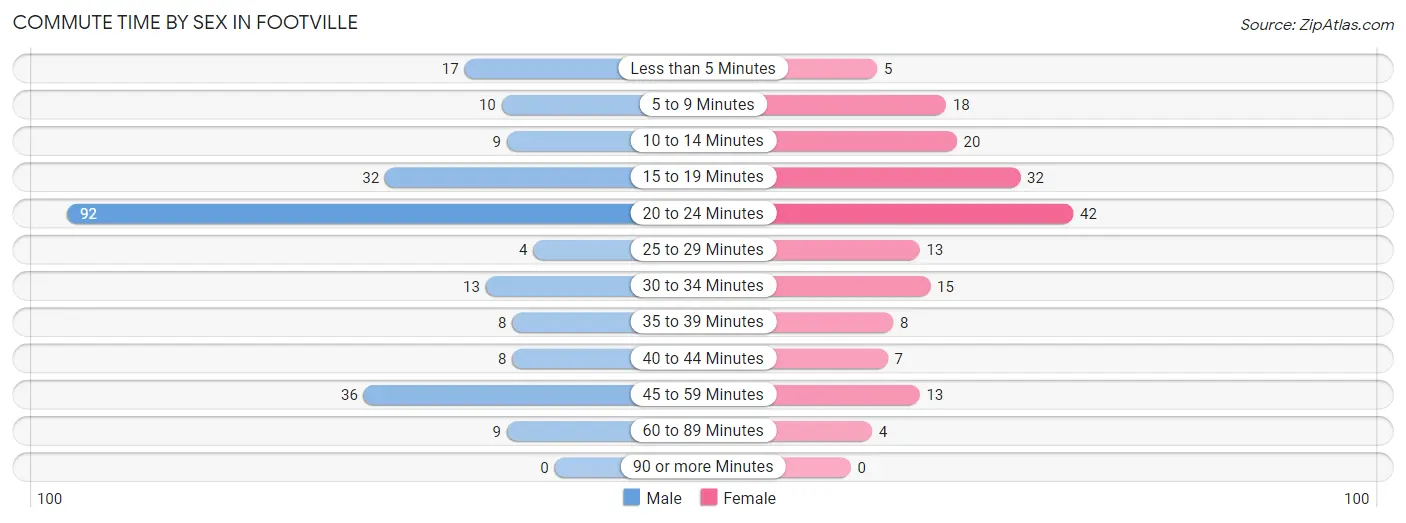
| Commute Time | Male | Female |
| Less than 5 Minutes | 17 (7.1%) | 5 (2.8%) |
| 5 to 9 Minutes | 10 (4.2%) | 18 (10.2%) |
| 10 to 14 Minutes | 9 (3.8%) | 20 (11.3%) |
| 15 to 19 Minutes | 32 (13.5%) | 32 (18.1%) |
| 20 to 24 Minutes | 92 (38.7%) | 42 (23.7%) |
| 25 to 29 Minutes | 4 (1.7%) | 13 (7.3%) |
| 30 to 34 Minutes | 13 (5.5%) | 15 (8.5%) |
| 35 to 39 Minutes | 8 (3.4%) | 8 (4.5%) |
| 40 to 44 Minutes | 8 (3.4%) | 7 (4.0%) |
| 45 to 59 Minutes | 36 (15.1%) | 13 (7.3%) |
| 60 to 89 Minutes | 9 (3.8%) | 4 (2.3%) |
| 90 or more Minutes | 0 (0.0%) | 0 (0.0%) |
Time of Departure to Work by Sex in Footville
The most frequent times of departure to work in Footville are 12:00 PM to 3:59 PM (47, 19.8%) for males and 7:00 AM to 7:29 AM (51, 28.8%) for females.
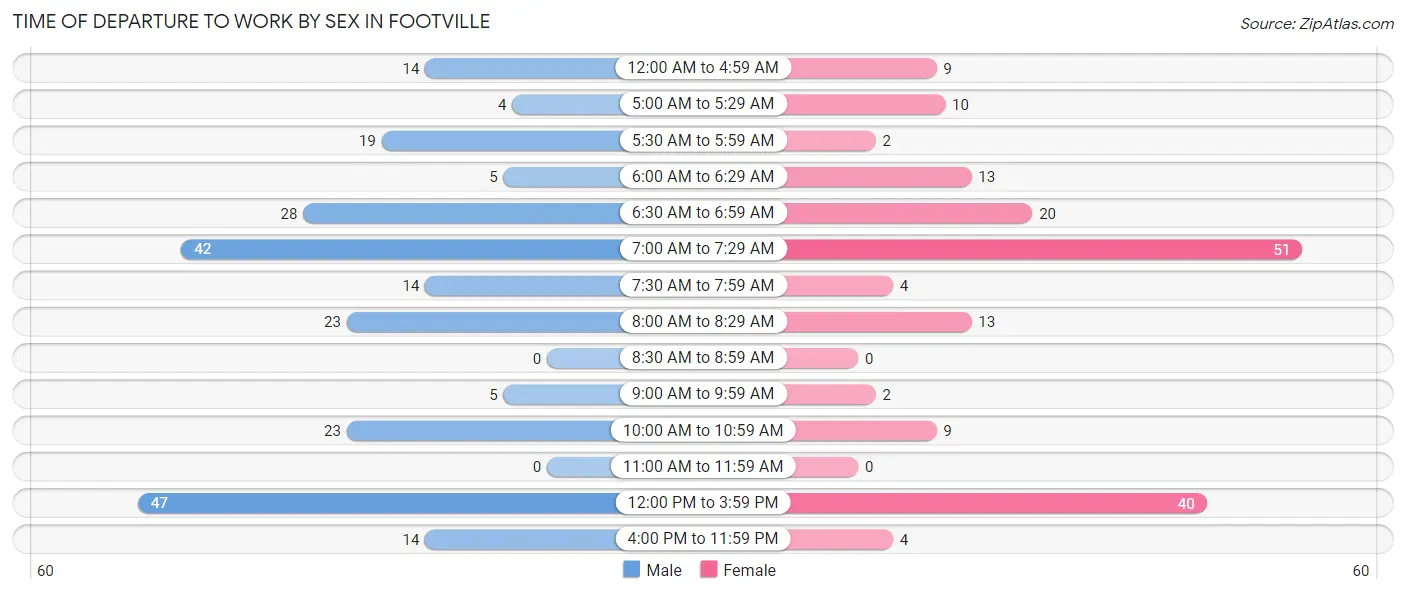
| Time of Departure | Male | Female |
| 12:00 AM to 4:59 AM | 14 (5.9%) | 9 (5.1%) |
| 5:00 AM to 5:29 AM | 4 (1.7%) | 10 (5.7%) |
| 5:30 AM to 5:59 AM | 19 (8.0%) | 2 (1.1%) |
| 6:00 AM to 6:29 AM | 5 (2.1%) | 13 (7.3%) |
| 6:30 AM to 6:59 AM | 28 (11.8%) | 20 (11.3%) |
| 7:00 AM to 7:29 AM | 42 (17.6%) | 51 (28.8%) |
| 7:30 AM to 7:59 AM | 14 (5.9%) | 4 (2.3%) |
| 8:00 AM to 8:29 AM | 23 (9.7%) | 13 (7.3%) |
| 8:30 AM to 8:59 AM | 0 (0.0%) | 0 (0.0%) |
| 9:00 AM to 9:59 AM | 5 (2.1%) | 2 (1.1%) |
| 10:00 AM to 10:59 AM | 23 (9.7%) | 9 (5.1%) |
| 11:00 AM to 11:59 AM | 0 (0.0%) | 0 (0.0%) |
| 12:00 PM to 3:59 PM | 47 (19.8%) | 40 (22.6%) |
| 4:00 PM to 11:59 PM | 14 (5.9%) | 4 (2.3%) |
| Total | 238 (100.0%) | 177 (100.0%) |
Housing Occupancy in Footville
Occupancy by Ownership in Footville
Of the total 399 dwellings in Footville, owner-occupied units account for 303 (75.9%), while renter-occupied units make up 96 (24.1%).
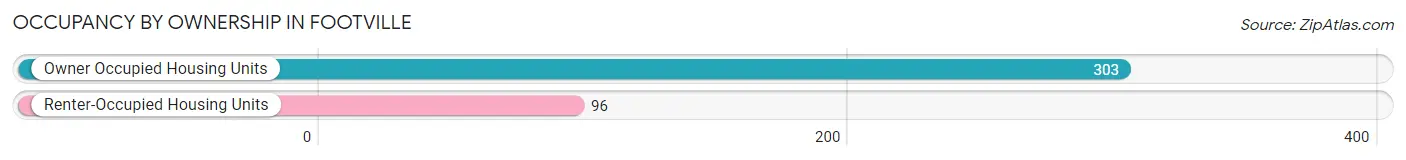
| Occupancy | # Housing Units | % Housing Units |
| Owner Occupied Housing Units | 303 | 75.9% |
| Renter-Occupied Housing Units | 96 | 24.1% |
| Total Occupied Housing Units | 399 | 100.0% |
Occupancy by Household Size in Footville
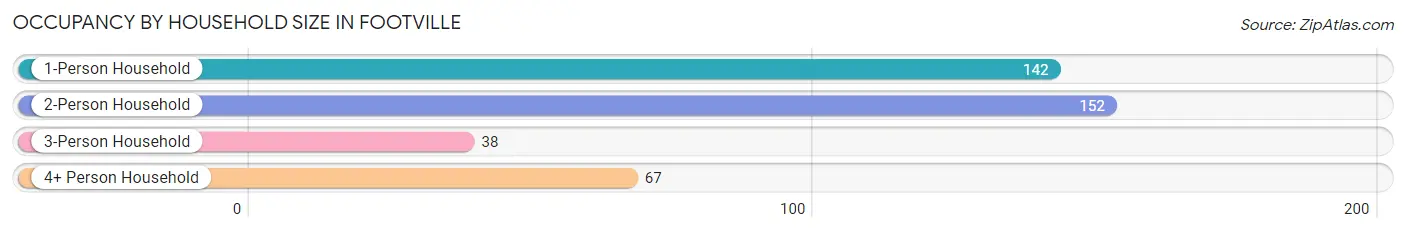
| Household Size | # Housing Units | % Housing Units |
| 1-Person Household | 142 | 35.6% |
| 2-Person Household | 152 | 38.1% |
| 3-Person Household | 38 | 9.5% |
| 4+ Person Household | 67 | 16.8% |
| Total Housing Units | 399 | 100.0% |
Occupancy by Ownership by Household Size in Footville
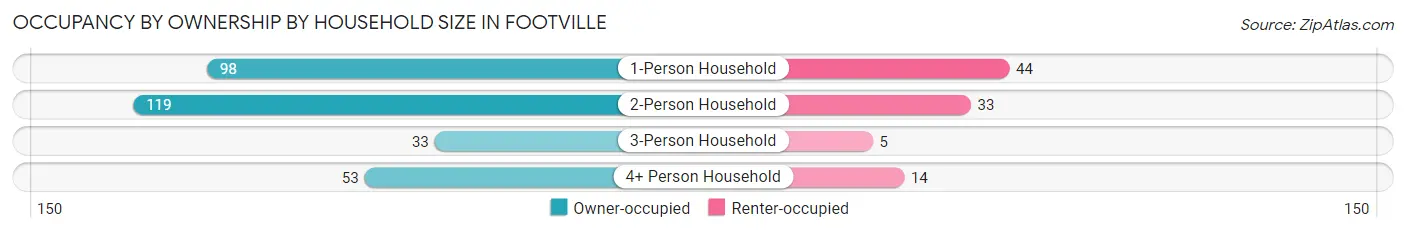
| Household Size | Owner-occupied | Renter-occupied |
| 1-Person Household | 98 (69.0%) | 44 (31.0%) |
| 2-Person Household | 119 (78.3%) | 33 (21.7%) |
| 3-Person Household | 33 (86.8%) | 5 (13.2%) |
| 4+ Person Household | 53 (79.1%) | 14 (20.9%) |
| Total Housing Units | 303 (75.9%) | 96 (24.1%) |
Occupancy by Educational Attainment in Footville
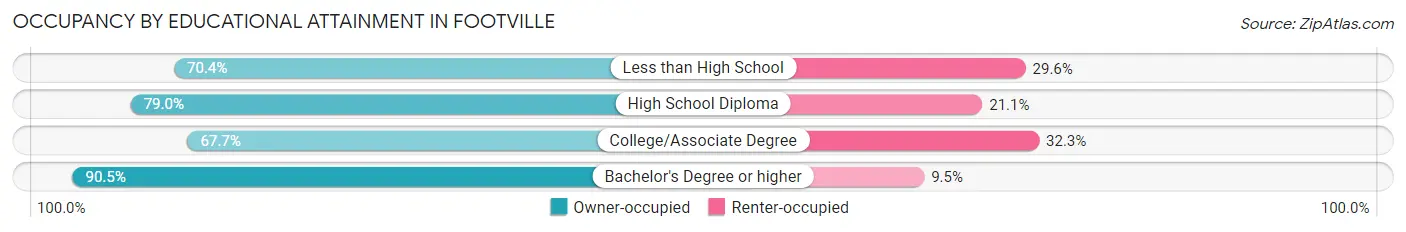
| Household Size | Owner-occupied | Renter-occupied |
| Less than High School | 38 (70.4%) | 16 (29.6%) |
| High School Diploma | 120 (78.9%) | 32 (21.0%) |
| College/Associate Degree | 88 (67.7%) | 42 (32.3%) |
| Bachelor's Degree or higher | 57 (90.5%) | 6 (9.5%) |
Occupancy by Age of Householder in Footville
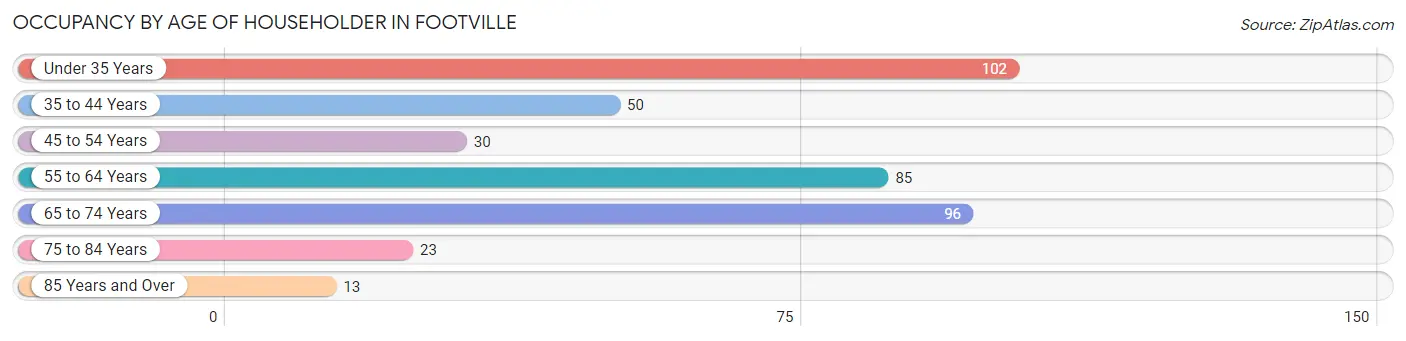
| Age Bracket | # Households | % Households |
| Under 35 Years | 102 | 25.6% |
| 35 to 44 Years | 50 | 12.5% |
| 45 to 54 Years | 30 | 7.5% |
| 55 to 64 Years | 85 | 21.3% |
| 65 to 74 Years | 96 | 24.1% |
| 75 to 84 Years | 23 | 5.8% |
| 85 Years and Over | 13 | 3.3% |
| Total | 399 | 100.0% |
Housing Finances in Footville
Median Income by Occupancy in Footville
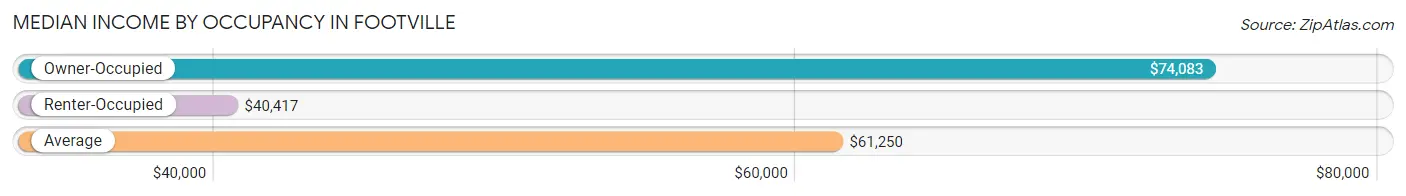
| Occupancy Type | # Households | Median Income |
| Owner-Occupied | 303 (75.9%) | $74,083 |
| Renter-Occupied | 96 (24.1%) | $40,417 |
| Average | 399 (100.0%) | $61,250 |
Occupancy by Householder Income Bracket in Footville
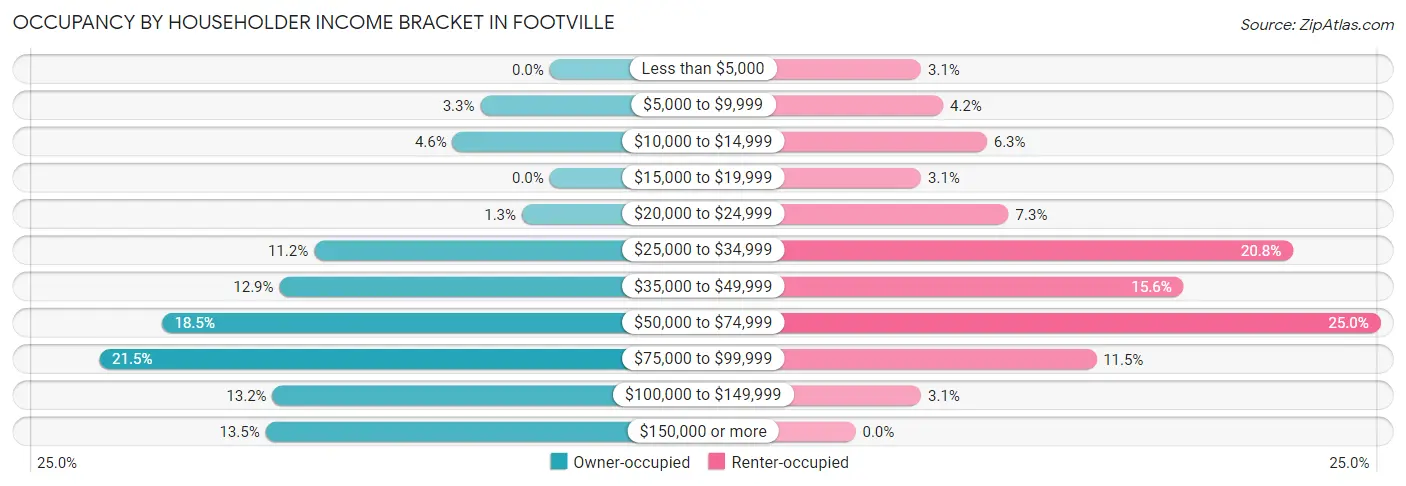
| Income Bracket | Owner-occupied | Renter-occupied |
| Less than $5,000 | 0 (0.0%) | 3 (3.1%) |
| $5,000 to $9,999 | 10 (3.3%) | 4 (4.2%) |
| $10,000 to $14,999 | 14 (4.6%) | 6 (6.2%) |
| $15,000 to $19,999 | 0 (0.0%) | 3 (3.1%) |
| $20,000 to $24,999 | 4 (1.3%) | 7 (7.3%) |
| $25,000 to $34,999 | 34 (11.2%) | 20 (20.8%) |
| $35,000 to $49,999 | 39 (12.9%) | 15 (15.6%) |
| $50,000 to $74,999 | 56 (18.5%) | 24 (25.0%) |
| $75,000 to $99,999 | 65 (21.4%) | 11 (11.5%) |
| $100,000 to $149,999 | 40 (13.2%) | 3 (3.1%) |
| $150,000 or more | 41 (13.5%) | 0 (0.0%) |
| Total | 303 (100.0%) | 96 (100.0%) |
Monthly Housing Cost Tiers in Footville
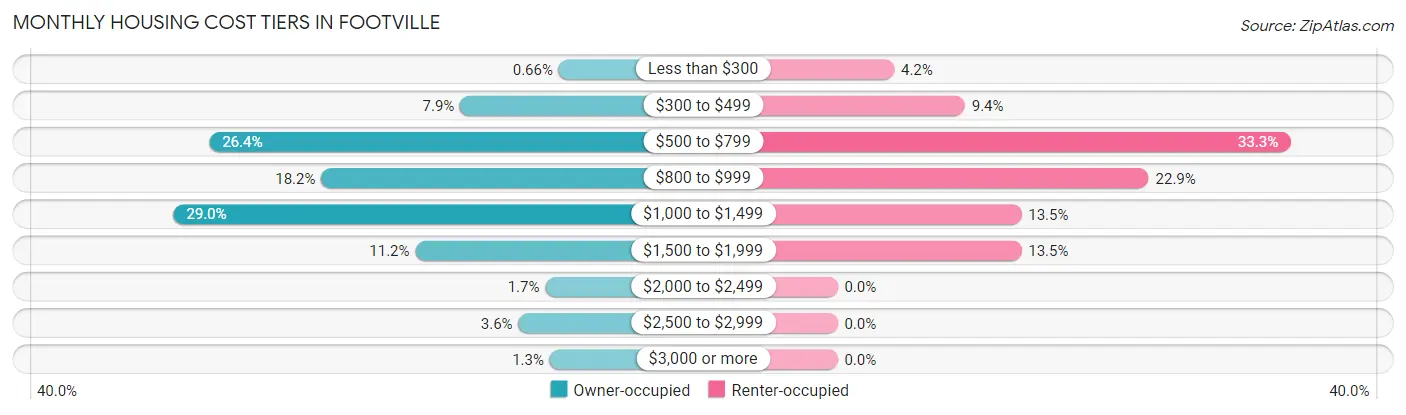
| Monthly Cost | Owner-occupied | Renter-occupied |
| Less than $300 | 2 (0.7%) | 4 (4.2%) |
| $300 to $499 | 24 (7.9%) | 9 (9.4%) |
| $500 to $799 | 80 (26.4%) | 32 (33.3%) |
| $800 to $999 | 55 (18.1%) | 22 (22.9%) |
| $1,000 to $1,499 | 88 (29.0%) | 13 (13.5%) |
| $1,500 to $1,999 | 34 (11.2%) | 13 (13.5%) |
| $2,000 to $2,499 | 5 (1.7%) | 0 (0.0%) |
| $2,500 to $2,999 | 11 (3.6%) | 0 (0.0%) |
| $3,000 or more | 4 (1.3%) | 0 (0.0%) |
| Total | 303 (100.0%) | 96 (100.0%) |
Physical Housing Characteristics in Footville
Housing Structures in Footville
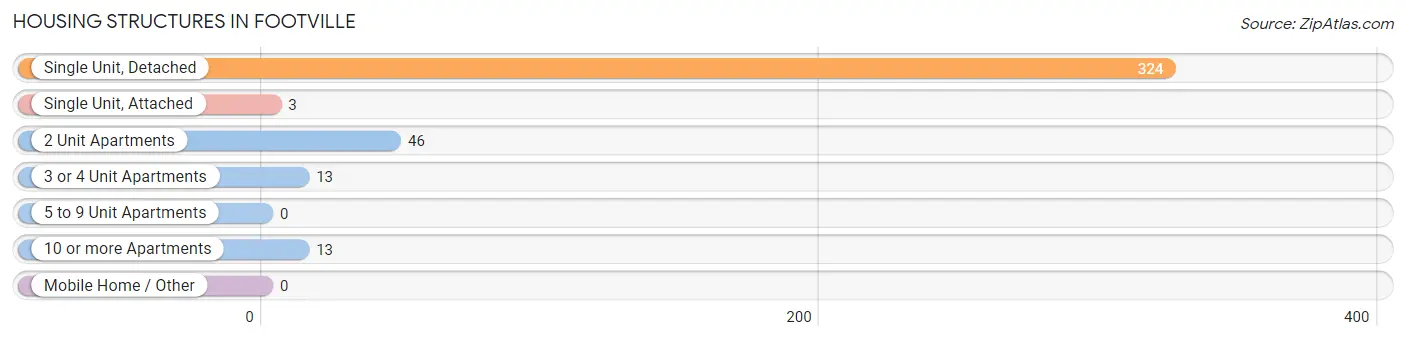
| Structure Type | # Housing Units | % Housing Units |
| Single Unit, Detached | 324 | 81.2% |
| Single Unit, Attached | 3 | 0.7% |
| 2 Unit Apartments | 46 | 11.5% |
| 3 or 4 Unit Apartments | 13 | 3.3% |
| 5 to 9 Unit Apartments | 0 | 0.0% |
| 10 or more Apartments | 13 | 3.3% |
| Mobile Home / Other | 0 | 0.0% |
| Total | 399 | 100.0% |
Housing Structures by Occupancy in Footville
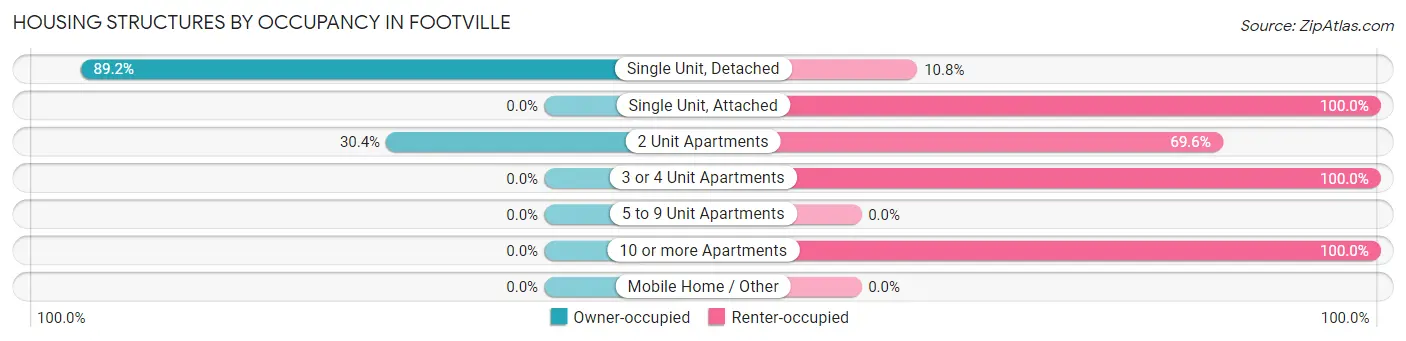
| Structure Type | Owner-occupied | Renter-occupied |
| Single Unit, Detached | 289 (89.2%) | 35 (10.8%) |
| Single Unit, Attached | 0 (0.0%) | 3 (100.0%) |
| 2 Unit Apartments | 14 (30.4%) | 32 (69.6%) |
| 3 or 4 Unit Apartments | 0 (0.0%) | 13 (100.0%) |
| 5 to 9 Unit Apartments | 0 (0.0%) | 0 (0.0%) |
| 10 or more Apartments | 0 (0.0%) | 13 (100.0%) |
| Mobile Home / Other | 0 (0.0%) | 0 (0.0%) |
| Total | 303 (75.9%) | 96 (24.1%) |
Housing Structures by Number of Rooms in Footville
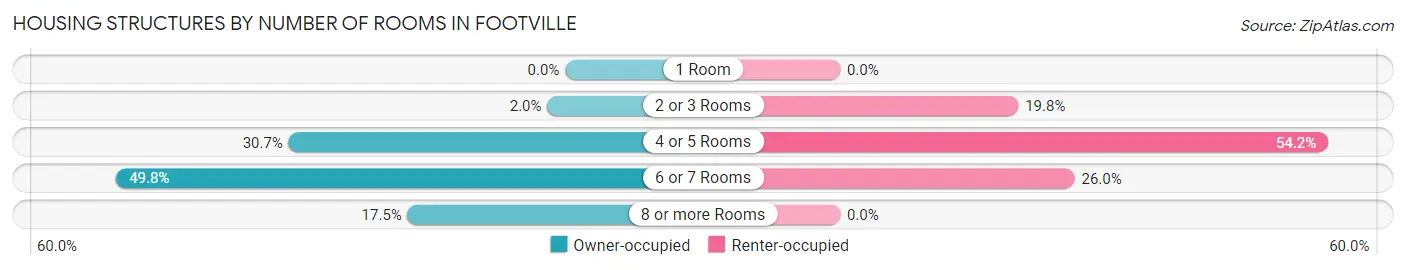
| Number of Rooms | Owner-occupied | Renter-occupied |
| 1 Room | 0 (0.0%) | 0 (0.0%) |
| 2 or 3 Rooms | 6 (2.0%) | 19 (19.8%) |
| 4 or 5 Rooms | 93 (30.7%) | 52 (54.2%) |
| 6 or 7 Rooms | 151 (49.8%) | 25 (26.0%) |
| 8 or more Rooms | 53 (17.5%) | 0 (0.0%) |
| Total | 303 (100.0%) | 96 (100.0%) |
Housing Structure by Heating Type in Footville
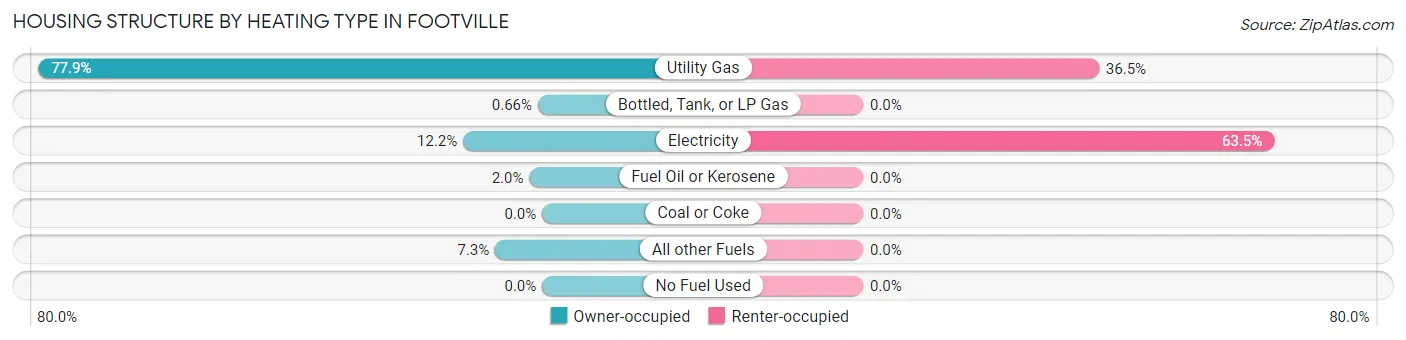
| Heating Type | Owner-occupied | Renter-occupied |
| Utility Gas | 236 (77.9%) | 35 (36.5%) |
| Bottled, Tank, or LP Gas | 2 (0.7%) | 0 (0.0%) |
| Electricity | 37 (12.2%) | 61 (63.5%) |
| Fuel Oil or Kerosene | 6 (2.0%) | 0 (0.0%) |
| Coal or Coke | 0 (0.0%) | 0 (0.0%) |
| All other Fuels | 22 (7.3%) | 0 (0.0%) |
| No Fuel Used | 0 (0.0%) | 0 (0.0%) |
| Total | 303 (100.0%) | 96 (100.0%) |
Household Vehicle Usage in Footville

| Vehicles per Household | Owner-occupied | Renter-occupied |
| No Vehicle | 6 (2.0%) | 6 (6.2%) |
| 1 Vehicle | 78 (25.7%) | 50 (52.1%) |
| 2 Vehicles | 157 (51.8%) | 34 (35.4%) |
| 3 or more Vehicles | 62 (20.5%) | 6 (6.2%) |
| Total | 303 (100.0%) | 96 (100.0%) |
Real Estate & Mortgages in Footville
Real Estate and Mortgage Overview in Footville
| Characteristic | Without Mortgage | With Mortgage |
| Housing Units | 134 | 169 |
| Median Property Value | $125,000 | $146,200 |
| Median Household Income | $52,875 | $23 |
| Monthly Housing Costs | $666 | $4 |
| Real Estate Taxes | $2,806 | $5 |
Property Value by Mortgage Status in Footville
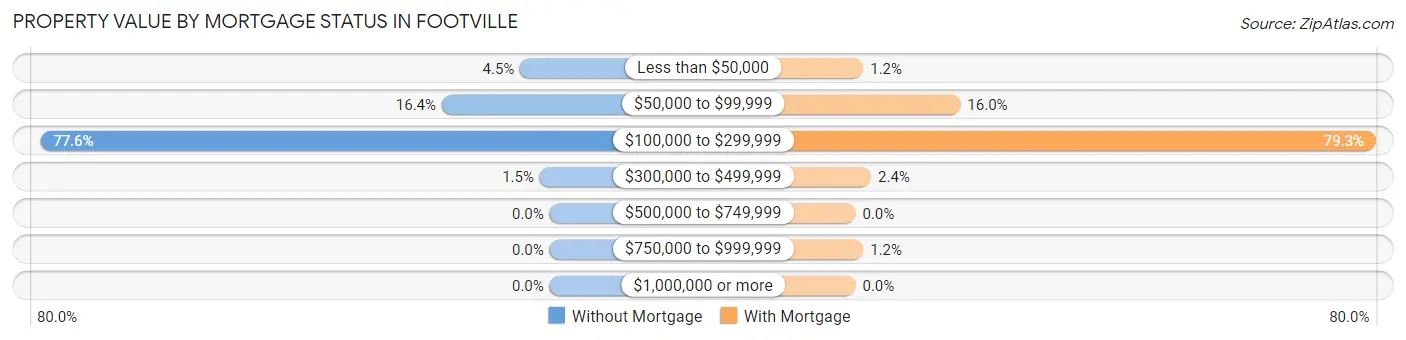
| Property Value | Without Mortgage | With Mortgage |
| Less than $50,000 | 6 (4.5%) | 2 (1.2%) |
| $50,000 to $99,999 | 22 (16.4%) | 27 (16.0%) |
| $100,000 to $299,999 | 104 (77.6%) | 134 (79.3%) |
| $300,000 to $499,999 | 2 (1.5%) | 4 (2.4%) |
| $500,000 to $749,999 | 0 (0.0%) | 0 (0.0%) |
| $750,000 to $999,999 | 0 (0.0%) | 2 (1.2%) |
| $1,000,000 or more | 0 (0.0%) | 0 (0.0%) |
| Total | 134 (100.0%) | 169 (100.0%) |
Household Income by Mortgage Status in Footville
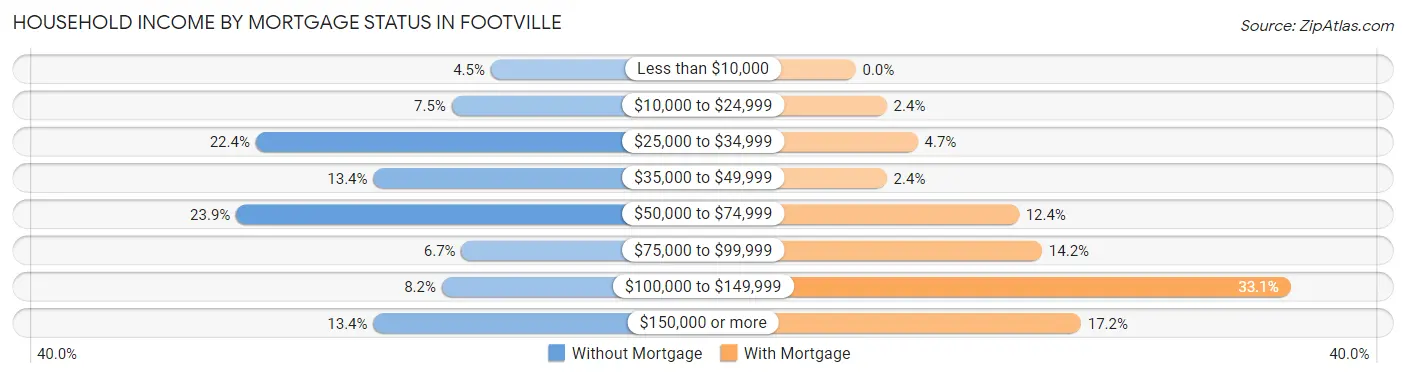
| Household Income | Without Mortgage | With Mortgage |
| Less than $10,000 | 6 (4.5%) | 0 (0.0%) |
| $10,000 to $24,999 | 10 (7.5%) | 4 (2.4%) |
| $25,000 to $34,999 | 30 (22.4%) | 8 (4.7%) |
| $35,000 to $49,999 | 18 (13.4%) | 4 (2.4%) |
| $50,000 to $74,999 | 32 (23.9%) | 21 (12.4%) |
| $75,000 to $99,999 | 9 (6.7%) | 24 (14.2%) |
| $100,000 to $149,999 | 11 (8.2%) | 56 (33.1%) |
| $150,000 or more | 18 (13.4%) | 29 (17.2%) |
| Total | 134 (100.0%) | 169 (100.0%) |
Property Value to Household Income Ratio in Footville
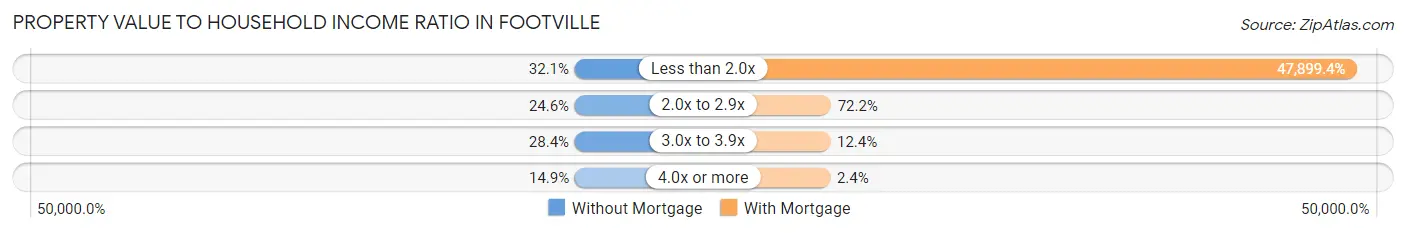
| Value-to-Income Ratio | Without Mortgage | With Mortgage |
| Less than 2.0x | 43 (32.1%) | 80,950 (47,899.4%) |
| 2.0x to 2.9x | 33 (24.6%) | 122 (72.2%) |
| 3.0x to 3.9x | 38 (28.4%) | 21 (12.4%) |
| 4.0x or more | 20 (14.9%) | 4 (2.4%) |
| Total | 134 (100.0%) | 169 (100.0%) |
Real Estate Taxes by Mortgage Status in Footville
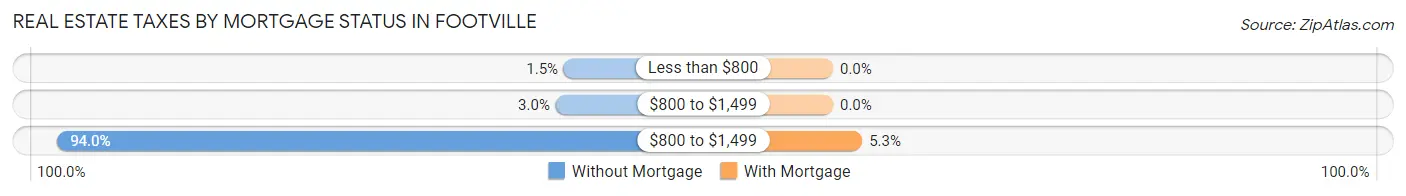
| Property Taxes | Without Mortgage | With Mortgage |
| Less than $800 | 2 (1.5%) | 0 (0.0%) |
| $800 to $1,499 | 4 (3.0%) | 0 (0.0%) |
| $800 to $1,499 | 126 (94.0%) | 9 (5.3%) |
| Total | 134 (100.0%) | 169 (100.0%) |
Health & Disability in Footville
Health Insurance Coverage by Age in Footville
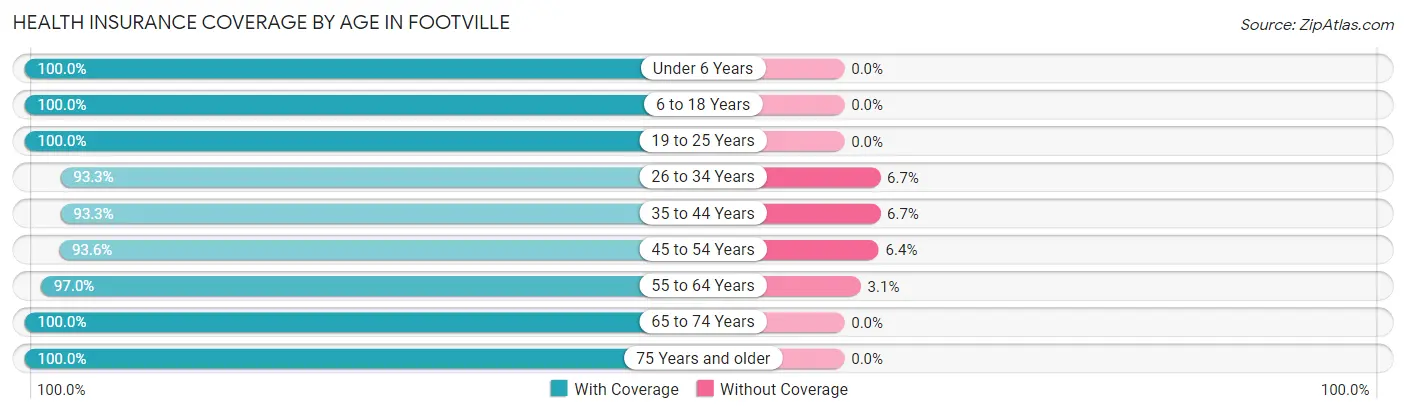
| Age Bracket | With Coverage | Without Coverage |
| Under 6 Years | 94 (100.0%) | 0 (0.0%) |
| 6 to 18 Years | 105 (100.0%) | 0 (0.0%) |
| 19 to 25 Years | 44 (100.0%) | 0 (0.0%) |
| 26 to 34 Years | 140 (93.3%) | 10 (6.7%) |
| 35 to 44 Years | 84 (93.3%) | 6 (6.7%) |
| 45 to 54 Years | 73 (93.6%) | 5 (6.4%) |
| 55 to 64 Years | 127 (97.0%) | 4 (3.0%) |
| 65 to 74 Years | 124 (100.0%) | 0 (0.0%) |
| 75 Years and older | 97 (100.0%) | 0 (0.0%) |
| Total | 888 (97.3%) | 25 (2.7%) |
Health Insurance Coverage by Citizenship Status in Footville
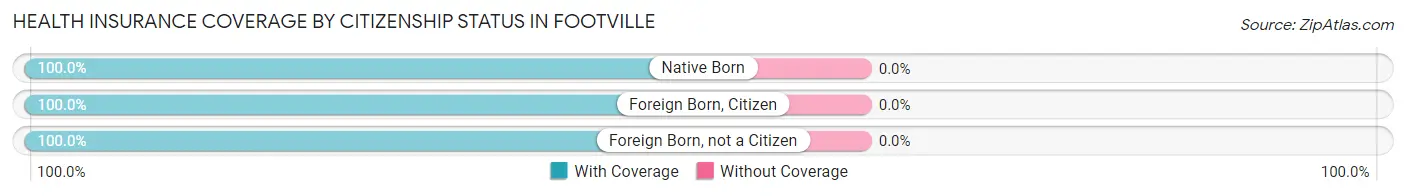
| Citizenship Status | With Coverage | Without Coverage |
| Native Born | 94 (100.0%) | 0 (0.0%) |
| Foreign Born, Citizen | 105 (100.0%) | 0 (0.0%) |
| Foreign Born, not a Citizen | 44 (100.0%) | 0 (0.0%) |
Health Insurance Coverage by Household Income in Footville
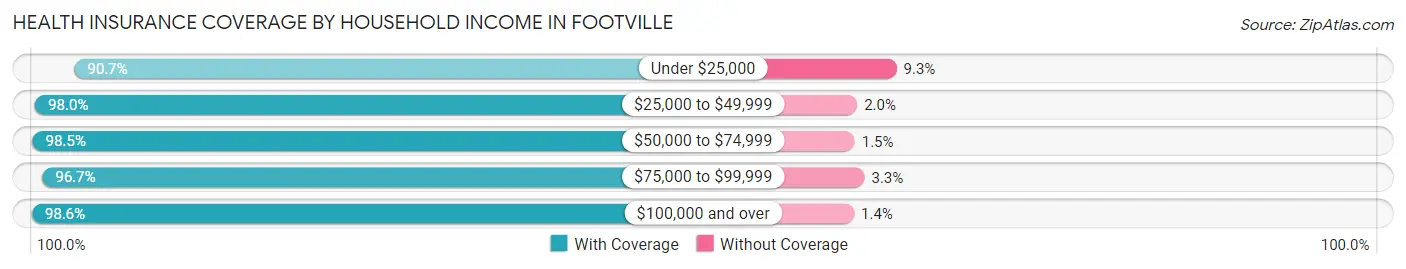
| Household Income | With Coverage | Without Coverage |
| Under $25,000 | 68 (90.7%) | 7 (9.3%) |
| $25,000 to $49,999 | 200 (98.0%) | 4 (2.0%) |
| $50,000 to $74,999 | 197 (98.5%) | 3 (1.5%) |
| $75,000 to $99,999 | 204 (96.7%) | 7 (3.3%) |
| $100,000 and over | 216 (98.6%) | 3 (1.4%) |
Public vs Private Health Insurance Coverage by Age in Footville
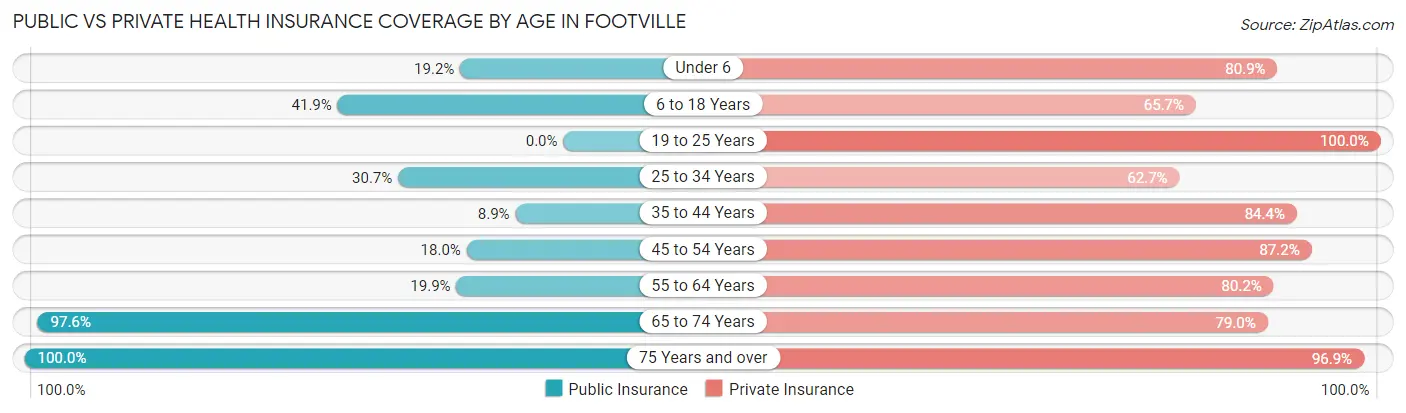
| Age Bracket | Public Insurance | Private Insurance |
| Under 6 | 18 (19.2%) | 76 (80.8%) |
| 6 to 18 Years | 44 (41.9%) | 69 (65.7%) |
| 19 to 25 Years | 0 (0.0%) | 44 (100.0%) |
| 25 to 34 Years | 46 (30.7%) | 94 (62.7%) |
| 35 to 44 Years | 8 (8.9%) | 76 (84.4%) |
| 45 to 54 Years | 14 (17.9%) | 68 (87.2%) |
| 55 to 64 Years | 26 (19.9%) | 105 (80.1%) |
| 65 to 74 Years | 121 (97.6%) | 98 (79.0%) |
| 75 Years and over | 97 (100.0%) | 94 (96.9%) |
| Total | 374 (41.0%) | 724 (79.3%) |
Disability Status by Sex by Age in Footville
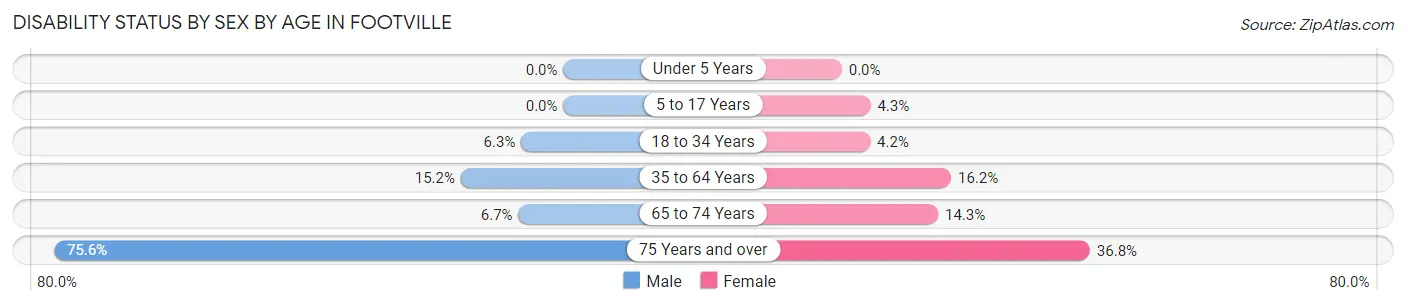
| Age Bracket | Male | Female |
| Under 5 Years | 0 (0.0%) | 0 (0.0%) |
| 5 to 17 Years | 0 (0.0%) | 2 (4.3%) |
| 18 to 34 Years | 5 (6.2%) | 5 (4.2%) |
| 35 to 64 Years | 23 (15.2%) | 24 (16.2%) |
| 65 to 74 Years | 5 (6.7%) | 7 (14.3%) |
| 75 Years and over | 59 (75.6%) | 7 (36.8%) |
Disability Class by Sex by Age in Footville
Disability Class: Hearing Difficulty
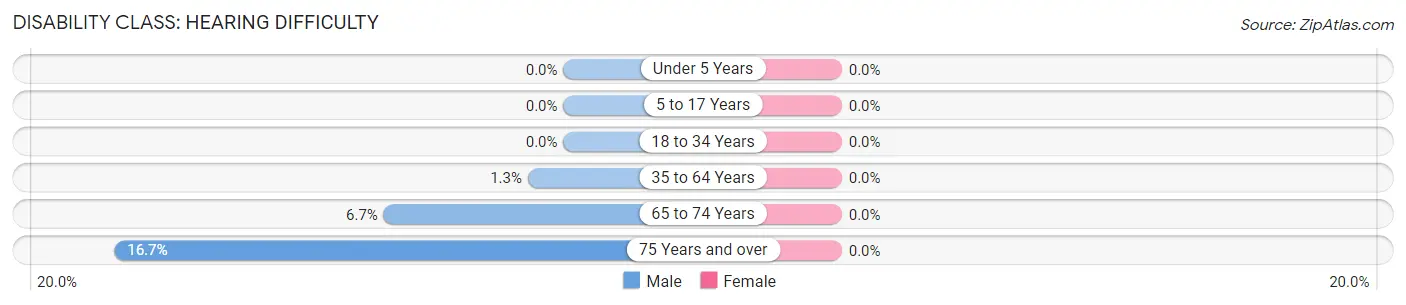
| Age Bracket | Male | Female |
| Under 5 Years | 0 (0.0%) | 0 (0.0%) |
| 5 to 17 Years | 0 (0.0%) | 0 (0.0%) |
| 18 to 34 Years | 0 (0.0%) | 0 (0.0%) |
| 35 to 64 Years | 2 (1.3%) | 0 (0.0%) |
| 65 to 74 Years | 5 (6.7%) | 0 (0.0%) |
| 75 Years and over | 13 (16.7%) | 0 (0.0%) |
Disability Class: Vision Difficulty
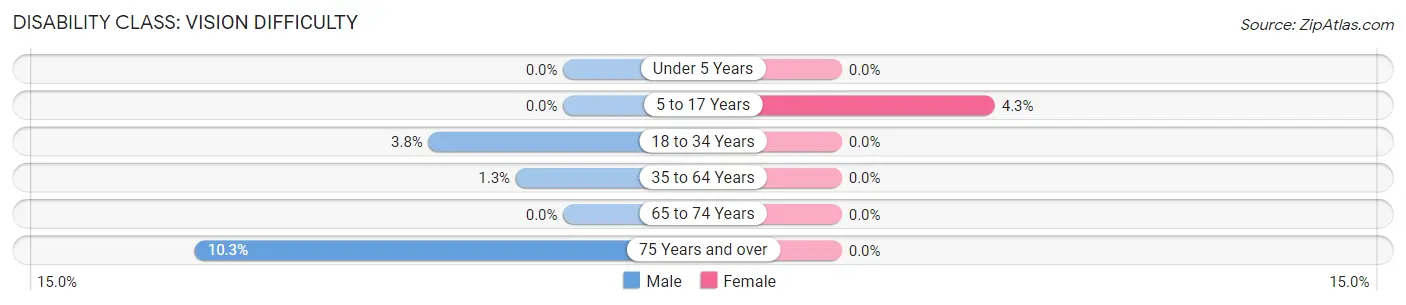
| Age Bracket | Male | Female |
| Under 5 Years | 0 (0.0%) | 0 (0.0%) |
| 5 to 17 Years | 0 (0.0%) | 2 (4.3%) |
| 18 to 34 Years | 3 (3.7%) | 0 (0.0%) |
| 35 to 64 Years | 2 (1.3%) | 0 (0.0%) |
| 65 to 74 Years | 0 (0.0%) | 0 (0.0%) |
| 75 Years and over | 8 (10.3%) | 0 (0.0%) |
Disability Class: Cognitive Difficulty
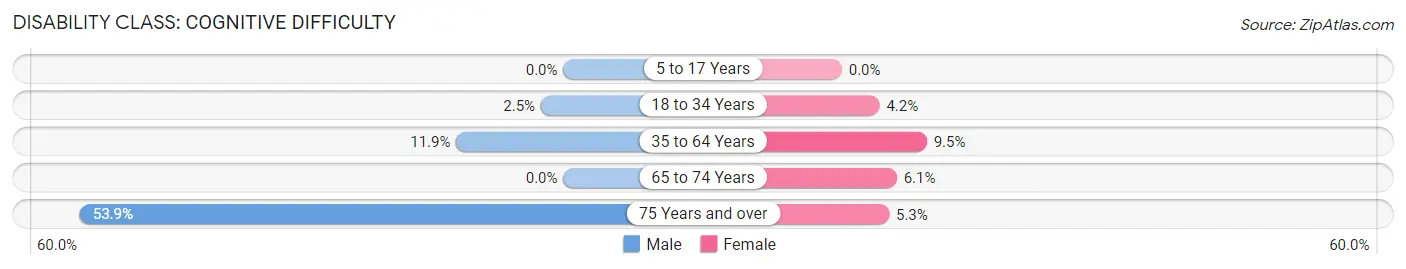
| Age Bracket | Male | Female |
| 5 to 17 Years | 0 (0.0%) | 0 (0.0%) |
| 18 to 34 Years | 2 (2.5%) | 5 (4.2%) |
| 35 to 64 Years | 18 (11.9%) | 14 (9.5%) |
| 65 to 74 Years | 0 (0.0%) | 3 (6.1%) |
| 75 Years and over | 42 (53.8%) | 1 (5.3%) |
Disability Class: Ambulatory Difficulty
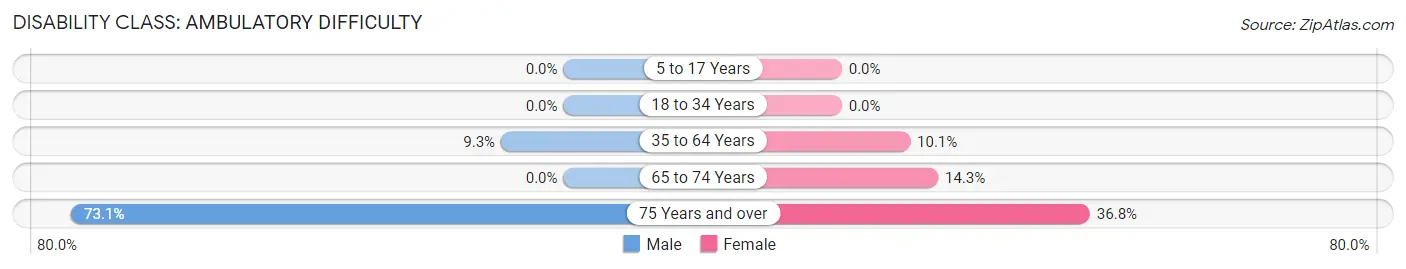
| Age Bracket | Male | Female |
| 5 to 17 Years | 0 (0.0%) | 0 (0.0%) |
| 18 to 34 Years | 0 (0.0%) | 0 (0.0%) |
| 35 to 64 Years | 14 (9.3%) | 15 (10.1%) |
| 65 to 74 Years | 0 (0.0%) | 7 (14.3%) |
| 75 Years and over | 57 (73.1%) | 7 (36.8%) |
Disability Class: Self-Care Difficulty
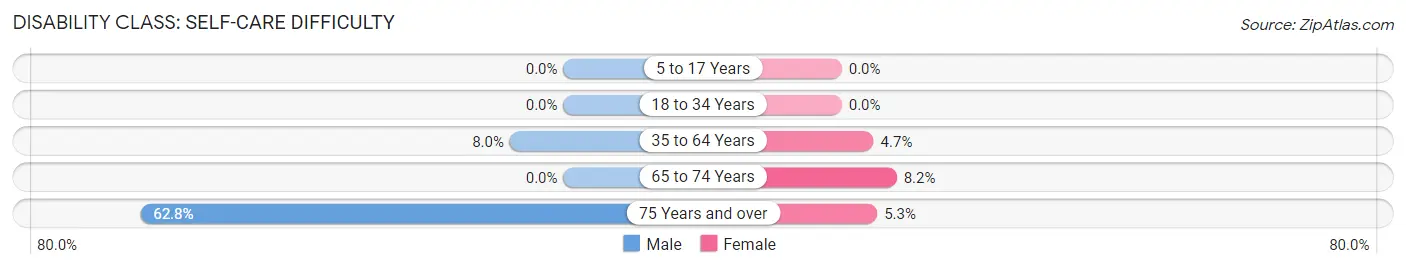
| Age Bracket | Male | Female |
| 5 to 17 Years | 0 (0.0%) | 0 (0.0%) |
| 18 to 34 Years | 0 (0.0%) | 0 (0.0%) |
| 35 to 64 Years | 12 (8.0%) | 7 (4.7%) |
| 65 to 74 Years | 0 (0.0%) | 4 (8.2%) |
| 75 Years and over | 49 (62.8%) | 1 (5.3%) |
Technology Access in Footville
Computing Device Access in Footville
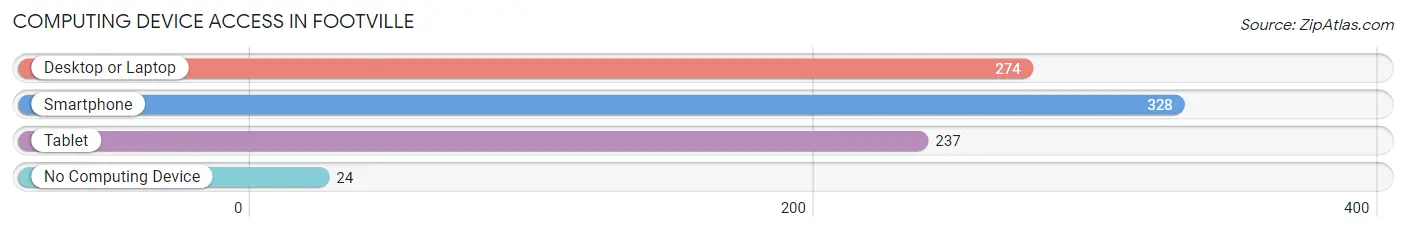
| Device Type | # Households | % Households |
| Desktop or Laptop | 274 | 68.7% |
| Smartphone | 328 | 82.2% |
| Tablet | 237 | 59.4% |
| No Computing Device | 24 | 6.0% |
| Total | 399 | 100.0% |
Internet Access in Footville
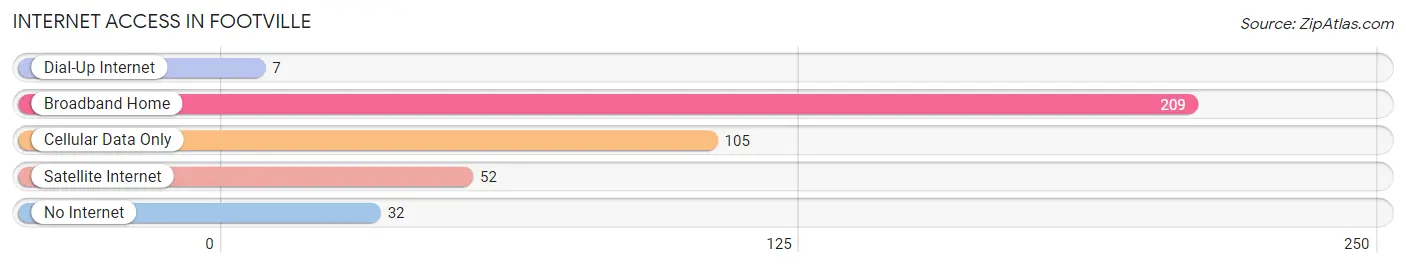
| Internet Type | # Households | % Households |
| Dial-Up Internet | 7 | 1.8% |
| Broadband Home | 209 | 52.4% |
| Cellular Data Only | 105 | 26.3% |
| Satellite Internet | 52 | 13.0% |
| No Internet | 32 | 8.0% |
| Total | 399 | 100.0% |
Footville Summary
History
Footville, Wisconsin is a small village located in Rock County, Wisconsin. It is situated on the banks of the Sugar River, and is part of the Janesville Metropolitan Statistical Area. The village was first settled in 1836 by a group of settlers from New York. The village was named after the Foot family, who were among the first settlers.
The village was incorporated in 1856, and the first mayor was elected in 1857. The village grew slowly over the years, and by the turn of the 20th century, it had a population of around 500 people.
The village was home to a number of businesses, including a flour mill, a sawmill, a cheese factory, and a blacksmith shop. The village also had a post office, a school, and a church.
In the early 1900s, the village was connected to the rest of the state by the Chicago & Northwestern Railroad. This allowed for the transportation of goods and people to and from the village.
The village continued to grow throughout the 20th century, and by the year 2000, the population had grown to 1,092 people.
Geography
Footville is located in Rock County, Wisconsin, and is situated on the banks of the Sugar River. The village is located about 25 miles south of Madison, and about 40 miles northwest of Milwaukee.
The village is located in a rural area, and is surrounded by farmland. The terrain is mostly flat, with some rolling hills. The village is located at an elevation of 890 feet above sea level.
The climate in Footville is classified as humid continental, with cold winters and hot, humid summers. The average annual temperature is around 45 degrees Fahrenheit, and the average annual precipitation is around 33 inches.
Economy
The economy of Footville is largely based on agriculture. The village is surrounded by farmland, and many of the residents are involved in farming. The village also has a number of small businesses, including a grocery store, a hardware store, and a few restaurants.
The village is also home to a number of manufacturing companies, including a plastics manufacturer and a metal fabrication company.
Demographics
As of the 2010 census, the population of Footville was 1,092 people. The racial makeup of the village was 97.3% White, 0.7% African American, 0.2% Native American, 0.2% Asian, 0.2% from other races, and 1.6% from two or more races. Hispanic or Latino of any race were 1.2% of the population.
The median household income in Footville was $45,938, and the median family income was $51,250. The per capita income was $20,945. About 8.3% of families and 10.2% of the population were below the poverty line, including 14.3% of those under age 18 and 5.2% of those age 65 or over.
Common Questions
What is Per Capita Income in Footville?
Per Capita income in Footville is $35,031.
What is the Median Family Income in Footville?
Median Family Income in Footville is $74,917.
What is the Median Household income in Footville?
Median Household Income in Footville is $61,250.
What is Income or Wage Gap in Footville?
Income or Wage Gap in Footville is 42.6%.
Women in Footville earn 57.4 cents for every dollar earned by a man.
What is Inequality or Gini Index in Footville?
Inequality or Gini Index in Footville is 0.42.
What is the Total Population of Footville?
Total Population of Footville is 939.
What is the Total Male Population of Footville?
Total Male Population of Footville is 506.
What is the Total Female Population of Footville?
Total Female Population of Footville is 433.
What is the Ratio of Males per 100 Females in Footville?
There are 116.86 Males per 100 Females in Footville.
What is the Ratio of Females per 100 Males in Footville?
There are 85.57 Females per 100 Males in Footville.
What is the Median Population Age in Footville?
Median Population Age in Footville is 42.2 Years.
What is the Average Family Size in Footville
Average Family Size in Footville is 3.0 People.
What is the Average Household Size in Footville
Average Household Size in Footville is 2.3 People.
How Large is the Labor Force in Footville?
There are 472 People in the Labor Forcein in Footville.
What is the Percentage of People in the Labor Force in Footville?
62.4% of People are in the Labor Force in Footville.
What is the Unemployment Rate in Footville?
Unemployment Rate in Footville is 3.0%.