Stone Lake, WI Map & Demographics
Stone Lake Map
Stone Lake Overview
$56,035
PER CAPITA INCOME
$111,875
AVG FAMILY INCOME
37.6%
WAGE / INCOME GAP [ % ]
62.4¢/ $1
WAGE / INCOME GAP [ $ ]
0.44
INEQUALITY / GINI INDEX
83
TOTAL POPULATION
33
MALE POPULATION
50
FEMALE POPULATION
66.00
MALES / 100 FEMALES
151.52
FEMALES / 100 MALES
61.3
MEDIAN AGE
2.0
AVG FAMILY SIZE
1.7
AVG HOUSEHOLD SIZE
42
LABOR FORCE [ PEOPLE ]
50.6%
PERCENT IN LABOR FORCE
Stone Lake Zip Codes
Stone Lake Area Codes
Income in Stone Lake
Income Overview in Stone Lake
| Characteristic | Number | Measure |
| Per Capita Income | 83 | $56,035 |
| Median Family Income | 27 | $111,875 |
| Mean Family Income | 27 | $121,981 |
| Median Household Income | 48 | $0 |
| Mean Household Income | 48 | $92,121 |
| Income Deficit | 27 | $0 |
| Wage / Income Gap (%) | 83 | 37.56% |
| Wage / Income Gap ($) | 83 | 62.44¢ per $1 |
| Gini / Inequality Index | 83 | 0.44 |
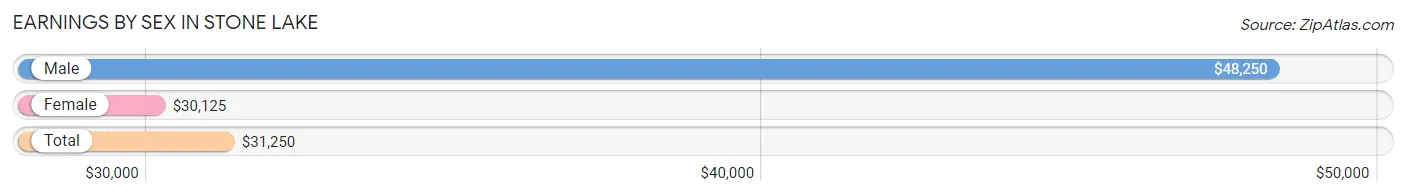
Earnings by Sex in Stone Lake
Average Earnings in Stone Lake are $31,250, $48,250 for men and $30,125 for women, a difference of 37.6%.
| Sex | Number | Average Earnings |
| Male | 21 (45.7%) | $48,250 |
| Female | 25 (54.3%) | $30,125 |
| Total | 46 (100.0%) | $31,250 |
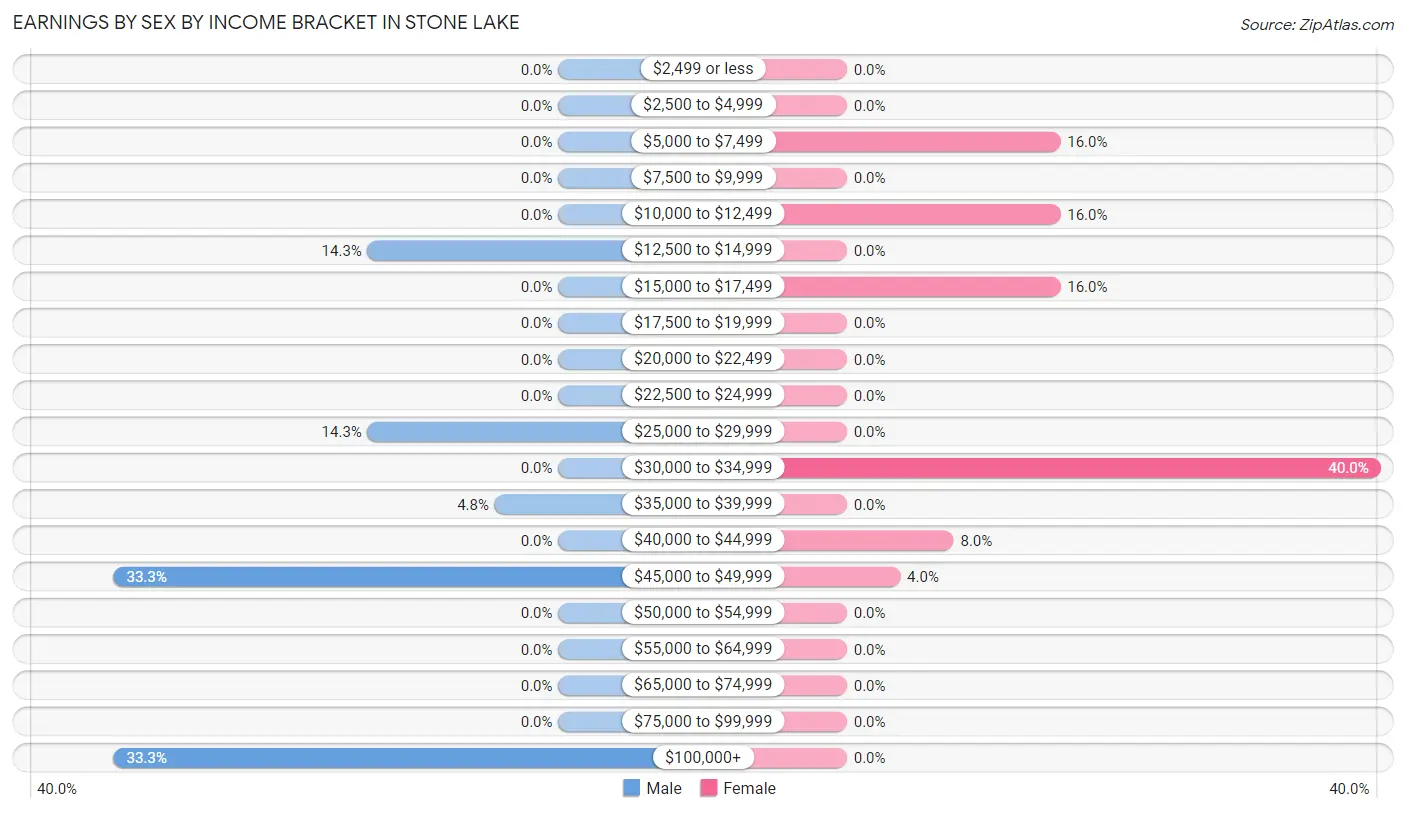
Earnings by Sex by Income Bracket in Stone Lake
The most common earnings brackets in Stone Lake are $45,000 to $49,999 for men (7 | 33.3%) and $30,000 to $34,999 for women (10 | 40.0%).
| Income | Male | Female |
| $2,499 or less | 0 (0.0%) | 0 (0.0%) |
| $2,500 to $4,999 | 0 (0.0%) | 0 (0.0%) |
| $5,000 to $7,499 | 0 (0.0%) | 4 (16.0%) |
| $7,500 to $9,999 | 0 (0.0%) | 0 (0.0%) |
| $10,000 to $12,499 | 0 (0.0%) | 4 (16.0%) |
| $12,500 to $14,999 | 3 (14.3%) | 0 (0.0%) |
| $15,000 to $17,499 | 0 (0.0%) | 4 (16.0%) |
| $17,500 to $19,999 | 0 (0.0%) | 0 (0.0%) |
| $20,000 to $22,499 | 0 (0.0%) | 0 (0.0%) |
| $22,500 to $24,999 | 0 (0.0%) | 0 (0.0%) |
| $25,000 to $29,999 | 3 (14.3%) | 0 (0.0%) |
| $30,000 to $34,999 | 0 (0.0%) | 10 (40.0%) |
| $35,000 to $39,999 | 1 (4.8%) | 0 (0.0%) |
| $40,000 to $44,999 | 0 (0.0%) | 2 (8.0%) |
| $45,000 to $49,999 | 7 (33.3%) | 1 (4.0%) |
| $50,000 to $54,999 | 0 (0.0%) | 0 (0.0%) |
| $55,000 to $64,999 | 0 (0.0%) | 0 (0.0%) |
| $65,000 to $74,999 | 0 (0.0%) | 0 (0.0%) |
| $75,000 to $99,999 | 0 (0.0%) | 0 (0.0%) |
| $100,000+ | 7 (33.3%) | 0 (0.0%) |
| Total | 21 (100.0%) | 25 (100.0%) |
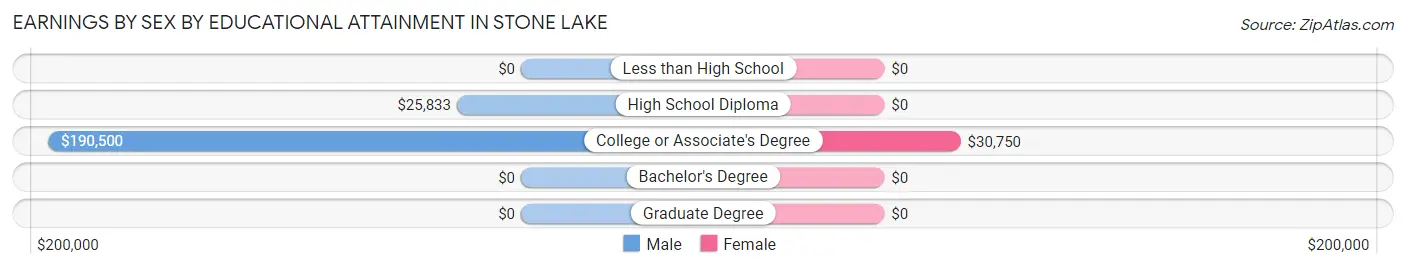
Earnings by Sex by Educational Attainment in Stone Lake
| Educational Attainment | Male Income | Female Income |
| Less than High School | - | - |
| High School Diploma | $25,833 | $0 |
| College or Associate's Degree | $190,500 | $30,750 |
| Bachelor's Degree | - | - |
| Graduate Degree | - | - |
| Total | - | - |
Family Income in Stone Lake
Family Income Brackets in Stone Lake
According to the Stone Lake family income data, there are 10 families falling into the $100,000 to $149,999 income range, which is the most common income bracket and makes up 37.0% of all families.
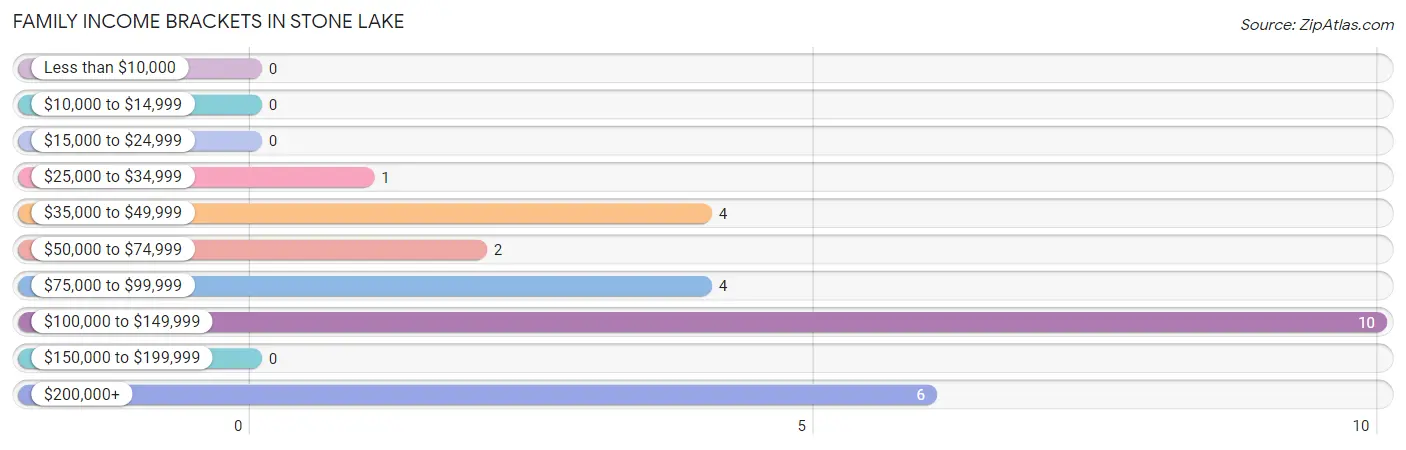
| Income Bracket | # Families | % Families |
| Less than $10,000 | 0 | 0.0% |
| $10,000 to $14,999 | 0 | 0.0% |
| $15,000 to $24,999 | 0 | 0.0% |
| $25,000 to $34,999 | 1 | 3.7% |
| $35,000 to $49,999 | 4 | 14.8% |
| $50,000 to $74,999 | 2 | 7.4% |
| $75,000 to $99,999 | 4 | 14.8% |
| $100,000 to $149,999 | 10 | 37.0% |
| $150,000 to $199,999 | 0 | 0.0% |
| $200,000+ | 6 | 22.2% |
Family Income by Famaliy Size in Stone Lake
2-person families (24 | 88.9%) account for the highest median family income in Stone Lake with $108,750 per family, while 2-person families (24 | 88.9%) have the highest median income of $54,375 per family member.
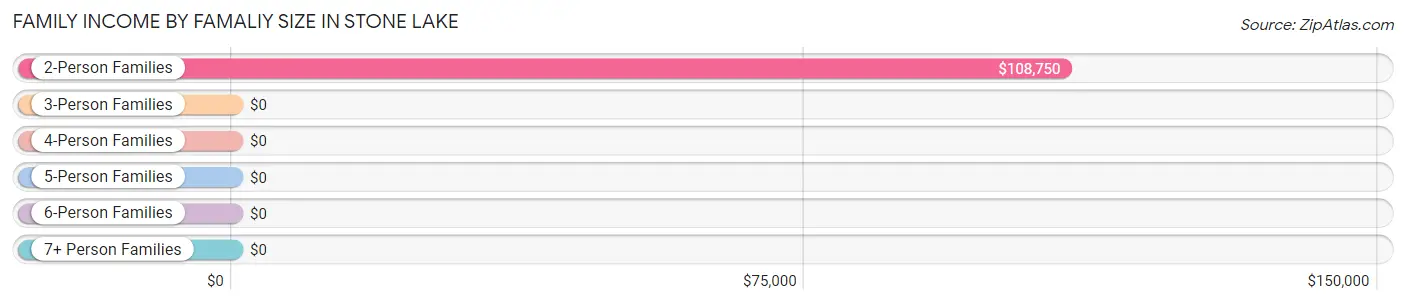
| Income Bracket | # Families | Median Income |
| 2-Person Families | 24 (88.9%) | $108,750 |
| 3-Person Families | 3 (11.1%) | $0 |
| 4-Person Families | 0 (0.0%) | $0 |
| 5-Person Families | 0 (0.0%) | $0 |
| 6-Person Families | 0 (0.0%) | $0 |
| 7+ Person Families | 0 (0.0%) | $0 |
| Total | 27 (100.0%) | $111,875 |
Family Income by Number of Earners in Stone Lake
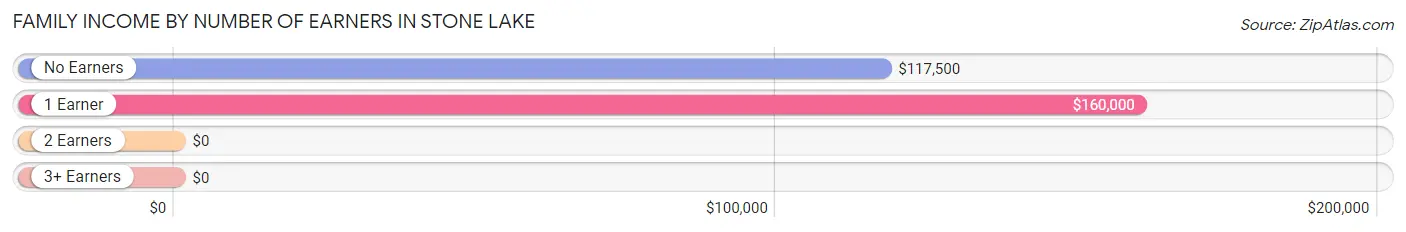
| Number of Earners | # Families | Median Income |
| No Earners | 12 (44.4%) | $117,500 |
| 1 Earner | 6 (22.2%) | $160,000 |
| 2 Earners | 9 (33.3%) | $0 |
| 3+ Earners | 0 (0.0%) | $0 |
| Total | 27 (100.0%) | $111,875 |
Household Income in Stone Lake
Household Income Brackets in Stone Lake
With 15 households falling in the category, the $25,000 to $34,999 income range is the most frequent in Stone Lake, accounting for 31.2% of all households.
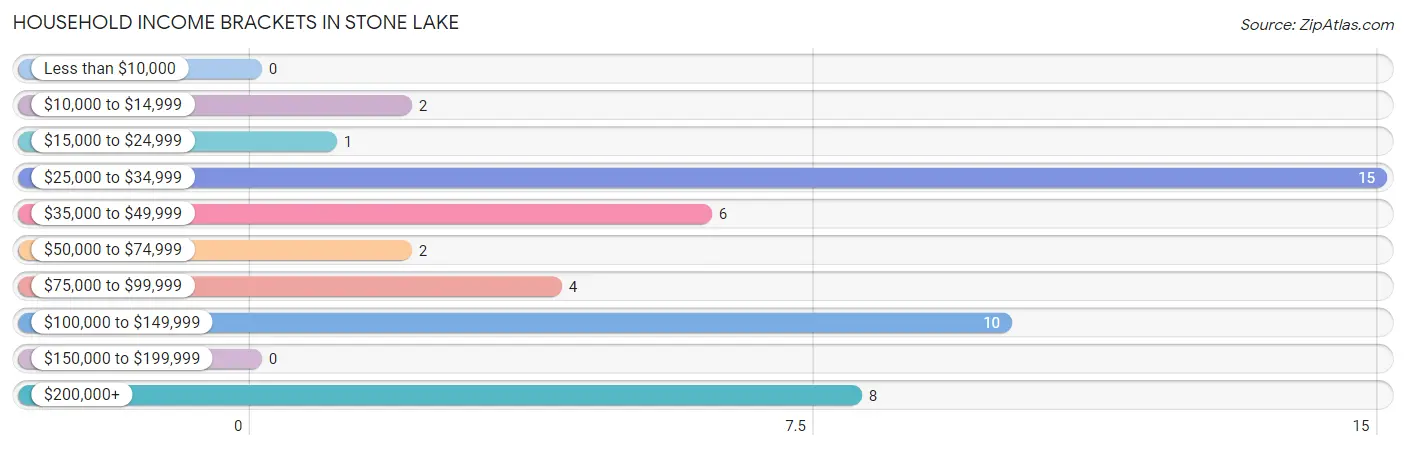
| Income Bracket | # Households | % Households |
| Less than $10,000 | 0 | 0.0% |
| $10,000 to $14,999 | 2 | 4.2% |
| $15,000 to $24,999 | 1 | 2.1% |
| $25,000 to $34,999 | 15 | 31.3% |
| $35,000 to $49,999 | 6 | 12.5% |
| $50,000 to $74,999 | 2 | 4.2% |
| $75,000 to $99,999 | 4 | 8.3% |
| $100,000 to $149,999 | 10 | 20.8% |
| $150,000 to $199,999 | 0 | 0.0% |
| $200,000+ | 8 | 16.7% |
Household Income by Householder Age in Stone Lake
The median household income in Stone Lake is $0, with the highest median household income of $111,875 found in the 65+ years age bracket for the primary householder. A total of 23 households (47.9%) fall into this category.
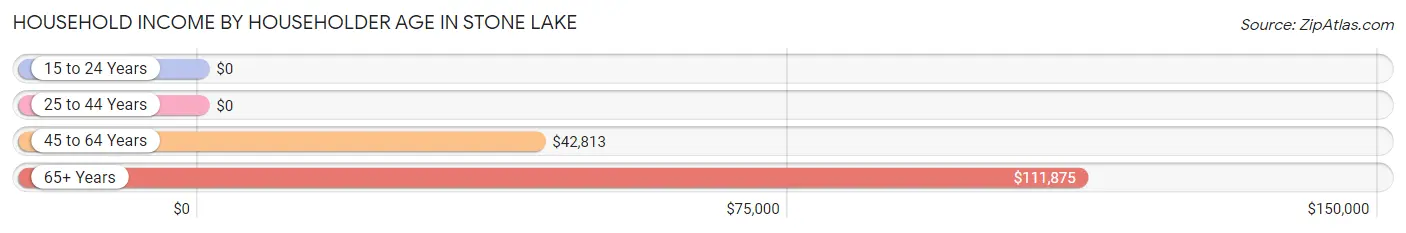
| Income Bracket | # Households | Median Income |
| 15 to 24 Years | 0 (0.0%) | $0 |
| 25 to 44 Years | 4 (8.3%) | $0 |
| 45 to 64 Years | 21 (43.8%) | $42,813 |
| 65+ Years | 23 (47.9%) | $111,875 |
| Total | 48 (100.0%) | $0 |
Poverty in Stone Lake
Income Below Poverty by Sex and Age in Stone Lake
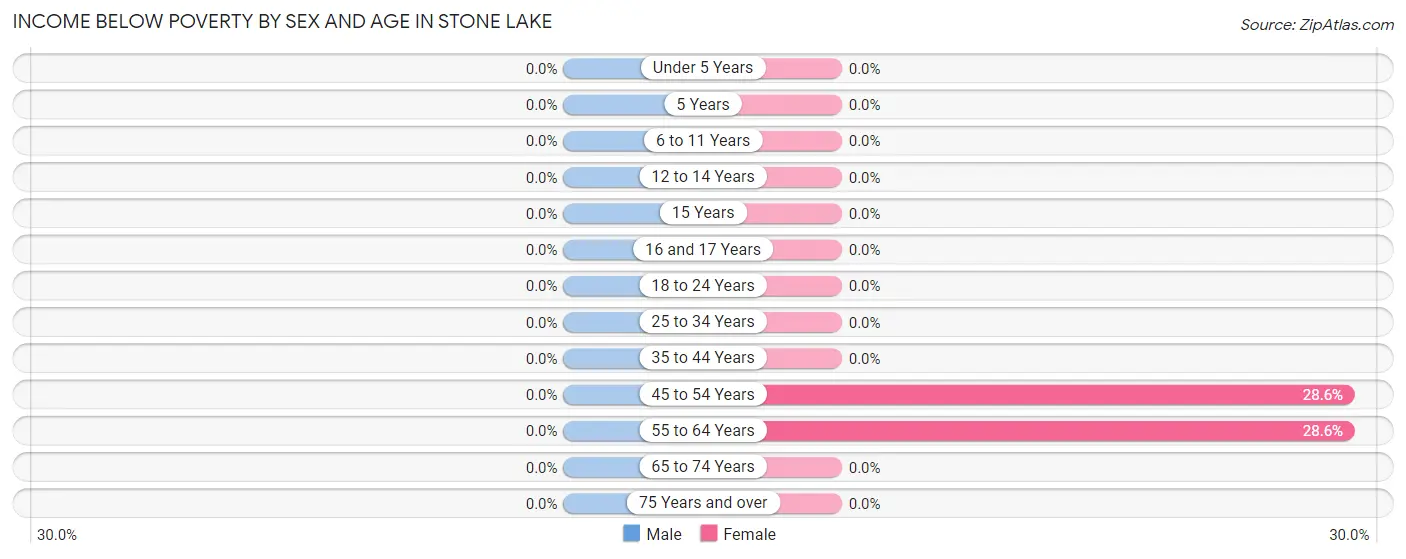
| Age Bracket | Male | Female |
| Under 5 Years | 0 (0.0%) | 0 (0.0%) |
| 5 Years | 0 (0.0%) | 0 (0.0%) |
| 6 to 11 Years | 0 (0.0%) | 0 (0.0%) |
| 12 to 14 Years | 0 (0.0%) | 0 (0.0%) |
| 15 Years | 0 (0.0%) | 0 (0.0%) |
| 16 and 17 Years | 0 (0.0%) | 0 (0.0%) |
| 18 to 24 Years | 0 (0.0%) | 0 (0.0%) |
| 25 to 34 Years | 0 (0.0%) | 0 (0.0%) |
| 35 to 44 Years | 0 (0.0%) | 0 (0.0%) |
| 45 to 54 Years | 0 (0.0%) | 4 (28.6%) |
| 55 to 64 Years | 0 (0.0%) | 4 (28.6%) |
| 65 to 74 Years | 0 (0.0%) | 0 (0.0%) |
| 75 Years and over | 0 (0.0%) | 0 (0.0%) |
| Total | 0 (0.0%) | 8 (16.0%) |
Income Above Poverty by Sex and Age in Stone Lake
According to the poverty statistics in Stone Lake, males aged 18 to 24 years and females aged 25 to 34 years are the age groups that are most secure financially, with 100.0% of males and 100.0% of females in these age groups living above the poverty line.
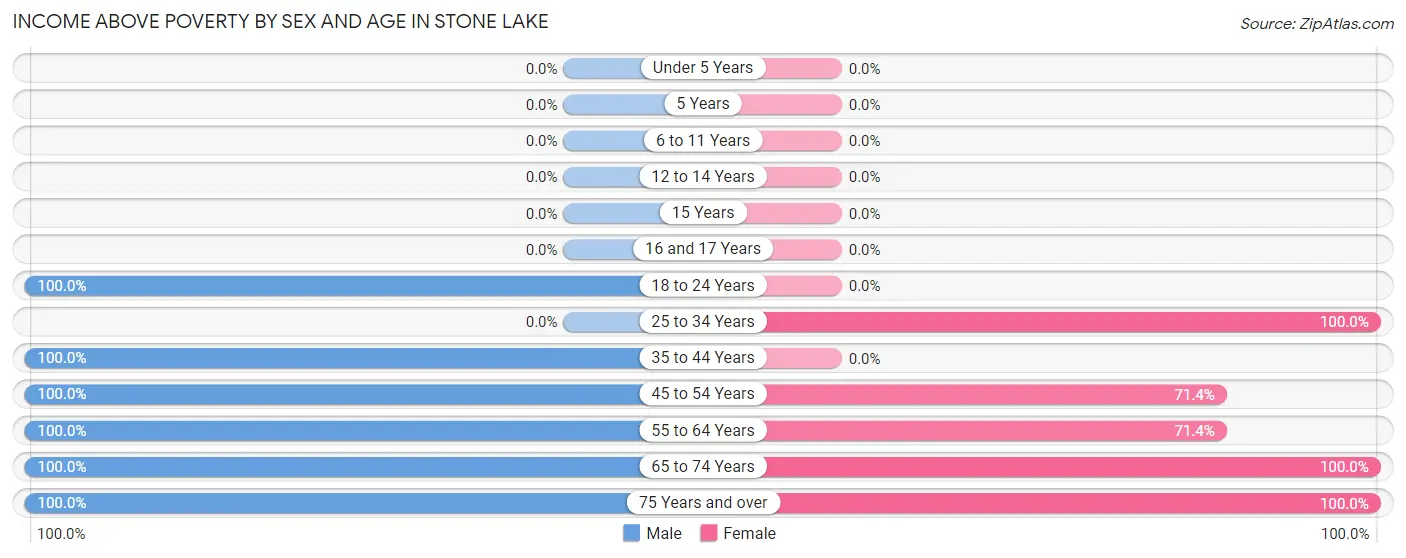
| Age Bracket | Male | Female |
| Under 5 Years | 0 (0.0%) | 0 (0.0%) |
| 5 Years | 0 (0.0%) | 0 (0.0%) |
| 6 to 11 Years | 0 (0.0%) | 0 (0.0%) |
| 12 to 14 Years | 0 (0.0%) | 0 (0.0%) |
| 15 Years | 0 (0.0%) | 0 (0.0%) |
| 16 and 17 Years | 0 (0.0%) | 0 (0.0%) |
| 18 to 24 Years | 5 (100.0%) | 0 (0.0%) |
| 25 to 34 Years | 0 (0.0%) | 4 (100.0%) |
| 35 to 44 Years | 1 (100.0%) | 0 (0.0%) |
| 45 to 54 Years | 5 (100.0%) | 10 (71.4%) |
| 55 to 64 Years | 8 (100.0%) | 10 (71.4%) |
| 65 to 74 Years | 8 (100.0%) | 15 (100.0%) |
| 75 Years and over | 6 (100.0%) | 3 (100.0%) |
| Total | 33 (100.0%) | 42 (84.0%) |
Income Below Poverty Among Married-Couple Families in Stone Lake
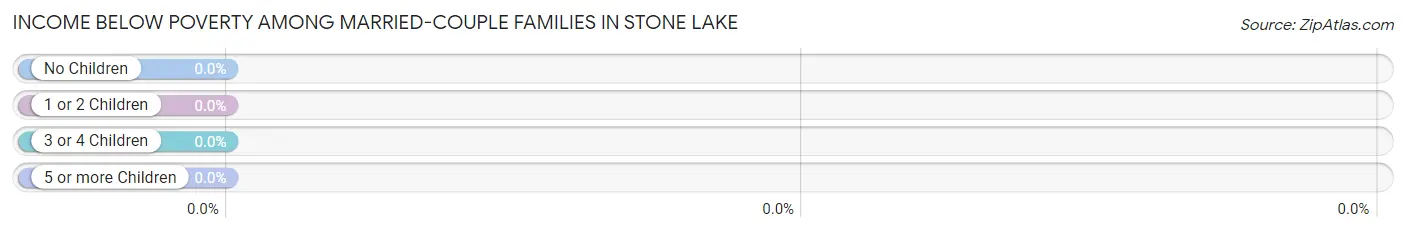
| Children | Above Poverty | Below Poverty |
| No Children | 26 (100.0%) | 0 (0.0%) |
| 1 or 2 Children | 0 (0.0%) | 0 (0.0%) |
| 3 or 4 Children | 0 (0.0%) | 0 (0.0%) |
| 5 or more Children | 0 (0.0%) | 0 (0.0%) |
| Total | 26 (100.0%) | 0 (0.0%) |
Income Below Poverty Among Single-Parent Households in Stone Lake
| Children | Single Father | Single Mother |
| No Children | 0 (0.0%) | 0 (0.0%) |
| 1 or 2 Children | 0 (0.0%) | 0 (0.0%) |
| 3 or 4 Children | 0 (0.0%) | 0 (0.0%) |
| 5 or more Children | 0 (0.0%) | 0 (0.0%) |
| Total | 0 (0.0%) | 0 (0.0%) |
Income Below Poverty Among Married-Couple vs Single-Parent Households in Stone Lake
| Children | Married-Couple Families | Single-Parent Households |
| No Children | 0 (0.0%) | 0 (0.0%) |
| 1 or 2 Children | 0 (0.0%) | 0 (0.0%) |
| 3 or 4 Children | 0 (0.0%) | 0 (0.0%) |
| 5 or more Children | 0 (0.0%) | 0 (0.0%) |
| Total | 0 (0.0%) | 0 (0.0%) |
Race in Stone Lake
The most populous races in Stone Lake are White / Caucasian (80 | 96.4%), and Black / African American (3 | 3.6%).
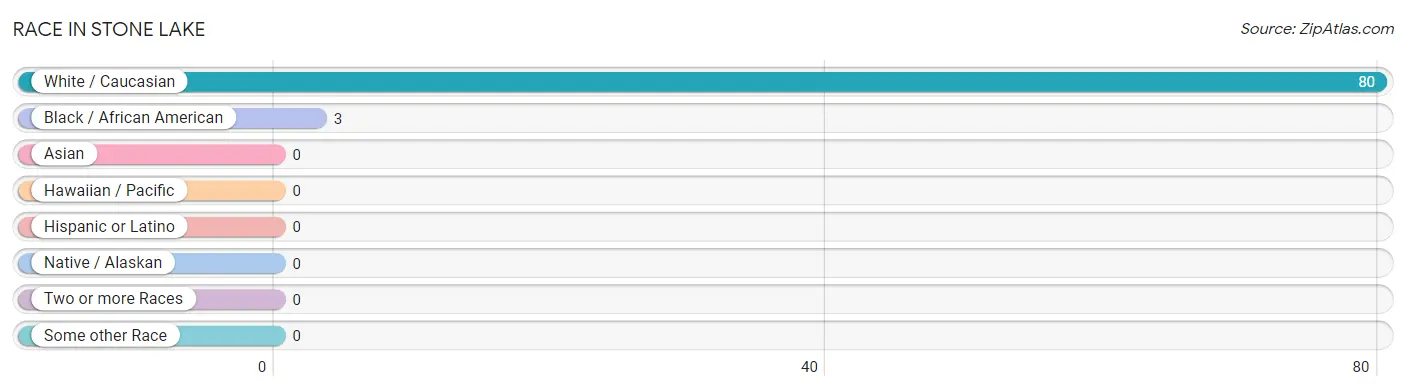
| Race | # Population | % Population |
| Asian | 0 | 0.0% |
| Black / African American | 3 | 3.6% |
| Hawaiian / Pacific | 0 | 0.0% |
| Hispanic or Latino | 0 | 0.0% |
| Native / Alaskan | 0 | 0.0% |
| White / Caucasian | 80 | 96.4% |
| Two or more Races | 0 | 0.0% |
| Some other Race | 0 | 0.0% |
| Total | 83 | 100.0% |
Ancestry in Stone Lake
The most populous ancestries reported in Stone Lake are German (33 | 39.8%), English (14 | 16.9%), American (11 | 13.3%), European (9 | 10.8%), and French (8 | 9.6%), together accounting for 90.4% of all Stone Lake residents.
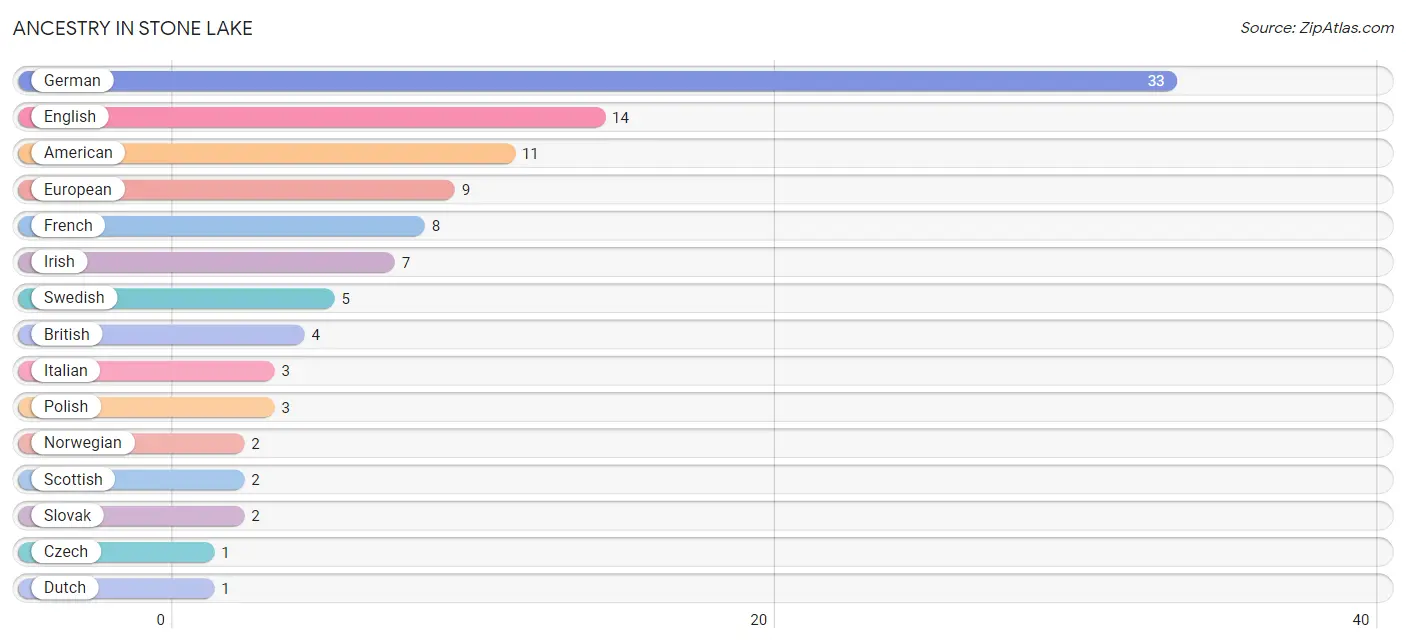
| Ancestry | # Population | % Population |
| American | 11 | 13.3% |
| British | 4 | 4.8% |
| Czech | 1 | 1.2% |
| Dutch | 1 | 1.2% |
| English | 14 | 16.9% |
| European | 9 | 10.8% |
| French | 8 | 9.6% |
| German | 33 | 39.8% |
| Irish | 7 | 8.4% |
| Italian | 3 | 3.6% |
| Norwegian | 2 | 2.4% |
| Polish | 3 | 3.6% |
| Scottish | 2 | 2.4% |
| Slovak | 2 | 2.4% |
| Swedish | 5 | 6.0% |
| Swiss | 1 | 1.2% | View All 16 Rows |
Immigrants in Stone Lake

| Immigration Origin | # Population | % Population | View All 0 Rows |
Sex and Age in Stone Lake
Sex and Age in Stone Lake
The most populous age groups in Stone Lake are 60 to 64 Years (8 | 24.2%) for men and 70 to 74 Years (13 | 26.0%) for women.
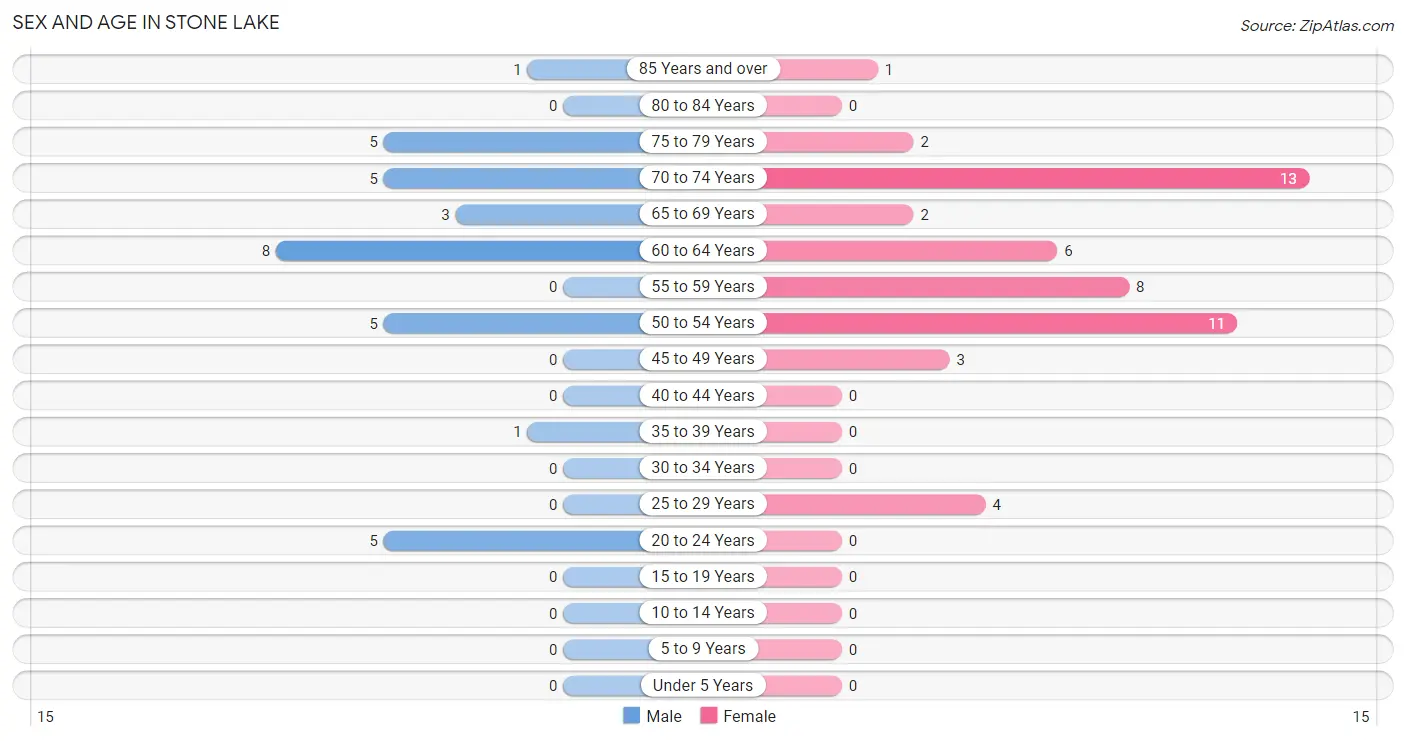
| Age Bracket | Male | Female |
| Under 5 Years | 0 (0.0%) | 0 (0.0%) |
| 5 to 9 Years | 0 (0.0%) | 0 (0.0%) |
| 10 to 14 Years | 0 (0.0%) | 0 (0.0%) |
| 15 to 19 Years | 0 (0.0%) | 0 (0.0%) |
| 20 to 24 Years | 5 (15.1%) | 0 (0.0%) |
| 25 to 29 Years | 0 (0.0%) | 4 (8.0%) |
| 30 to 34 Years | 0 (0.0%) | 0 (0.0%) |
| 35 to 39 Years | 1 (3.0%) | 0 (0.0%) |
| 40 to 44 Years | 0 (0.0%) | 0 (0.0%) |
| 45 to 49 Years | 0 (0.0%) | 3 (6.0%) |
| 50 to 54 Years | 5 (15.1%) | 11 (22.0%) |
| 55 to 59 Years | 0 (0.0%) | 8 (16.0%) |
| 60 to 64 Years | 8 (24.2%) | 6 (12.0%) |
| 65 to 69 Years | 3 (9.1%) | 2 (4.0%) |
| 70 to 74 Years | 5 (15.1%) | 13 (26.0%) |
| 75 to 79 Years | 5 (15.1%) | 2 (4.0%) |
| 80 to 84 Years | 0 (0.0%) | 0 (0.0%) |
| 85 Years and over | 1 (3.0%) | 1 (2.0%) |
| Total | 33 (100.0%) | 50 (100.0%) |
Families and Households in Stone Lake
Median Family Size in Stone Lake
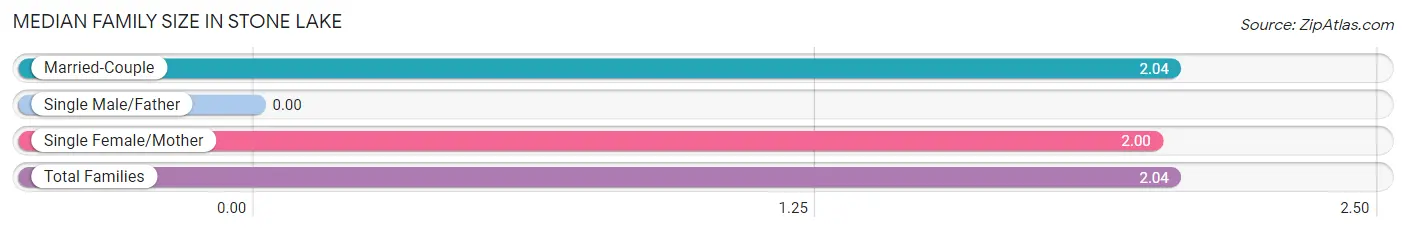
| Family Type | # Families | Family Size |
| Married-Couple | 26 (96.3%) | 2.04 |
| Single Male/Father | 0 (0.0%) | - |
| Single Female/Mother | 1 (3.7%) | 2.00 |
| Total Families | 27 (100.0%) | 2.04 |
Median Household Size in Stone Lake
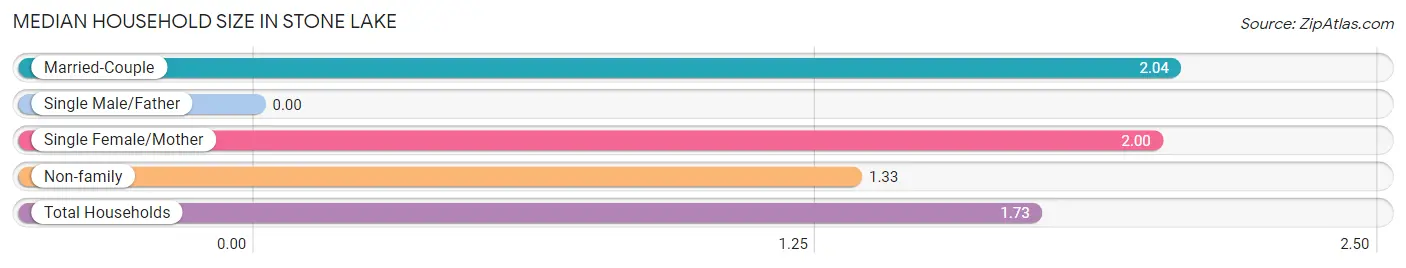
| Household Type | # Households | Household Size |
| Married-Couple | 26 (54.2%) | 2.04 |
| Single Male/Father | 0 (0.0%) | - |
| Single Female/Mother | 1 (2.1%) | 2.00 |
| Non-family | 21 (43.8%) | 1.33 |
| Total Households | 48 (100.0%) | 1.73 |
Household Size by Marriage Status in Stone Lake
Out of a total of 48 households in Stone Lake, 27 (56.2%) are family households, while 21 (43.8%) are nonfamily households. The most numerous type of family households are 2-person households, comprising 24, and the most common type of nonfamily households are 1-person households, comprising 16.

| Household Size | Family Households | Nonfamily Households |
| 1-Person Households | - | 16 (33.3%) |
| 2-Person Households | 24 (50.0%) | 5 (10.4%) |
| 3-Person Households | 3 (6.2%) | 0 (0.0%) |
| 4-Person Households | 0 (0.0%) | 0 (0.0%) |
| 5-Person Households | 0 (0.0%) | 0 (0.0%) |
| 6-Person Households | 0 (0.0%) | 0 (0.0%) |
| 7+ Person Households | 0 (0.0%) | 0 (0.0%) |
| Total | 27 (56.2%) | 21 (43.8%) |
Female Fertility in Stone Lake
Fertility by Age in Stone Lake
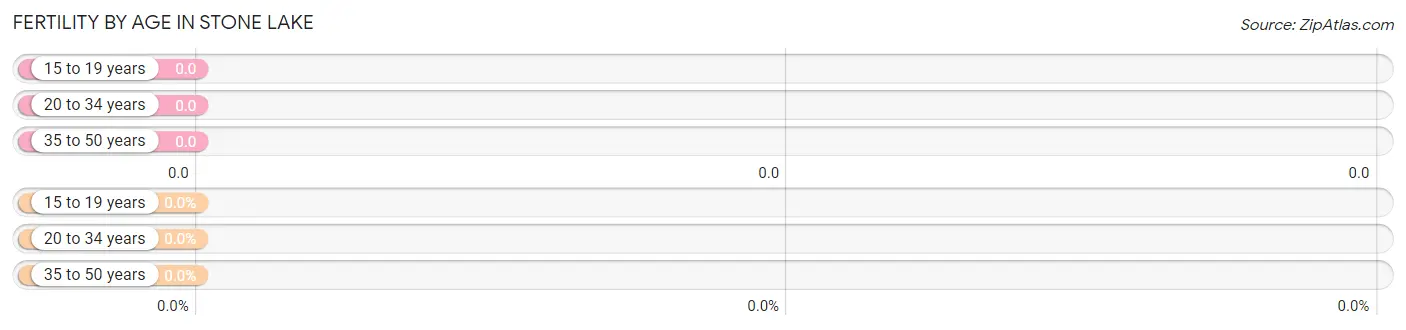
| Age Bracket | Women with Births | Births / 1,000 Women |
| 15 to 19 years | 0 (0.0%) | 0.0 |
| 20 to 34 years | 0 (0.0%) | 0.0 |
| 35 to 50 years | 0 (0.0%) | 0.0 |
| Total | 0 (0.0%) | 0.0 |
Fertility by Age by Marriage Status in Stone Lake
| Age Bracket | Married | Unmarried |
| 15 to 19 years | 0 (0.0%) | 0 (0.0%) |
| 20 to 34 years | 0 (0.0%) | 0 (0.0%) |
| 35 to 50 years | 0 (0.0%) | 0 (0.0%) |
| Total | 0 (0.0%) | 0 (0.0%) |
Fertility by Education in Stone Lake
| Educational Attainment | Women with Births | Births / 1,000 Women |
| Less than High School | 0 (0.0%) | 0.0 |
| High School Diploma | 0 (0.0%) | 0.0 |
| College or Associate's Degree | 0 (0.0%) | 0.0 |
| Bachelor's Degree | 0 (0.0%) | 0.0 |
| Graduate Degree | 0 (0.0%) | 0.0 |
| Total | 0 (0.0%) | 0.0 |
Fertility by Education by Marriage Status in Stone Lake
| Educational Attainment | Married | Unmarried |
| Less than High School | 0 (0.0%) | 0 (0.0%) |
| High School Diploma | 0 (0.0%) | 0 (0.0%) |
| College or Associate's Degree | 0 (0.0%) | 0 (0.0%) |
| Bachelor's Degree | 0 (0.0%) | 0 (0.0%) |
| Graduate Degree | 0 (0.0%) | 0 (0.0%) |
| Total | 0 (0.0%) | 0 (0.0%) |
Employment Characteristics in Stone Lake
Employment by Class of Employer in Stone Lake
Among the 42 employed individuals in Stone Lake, private company employees (28 | 66.7%), self-employed (incorporated) (7 | 16.7%), and self-employed (not incorporated) (4 | 9.5%) make up the most common classes of employment.
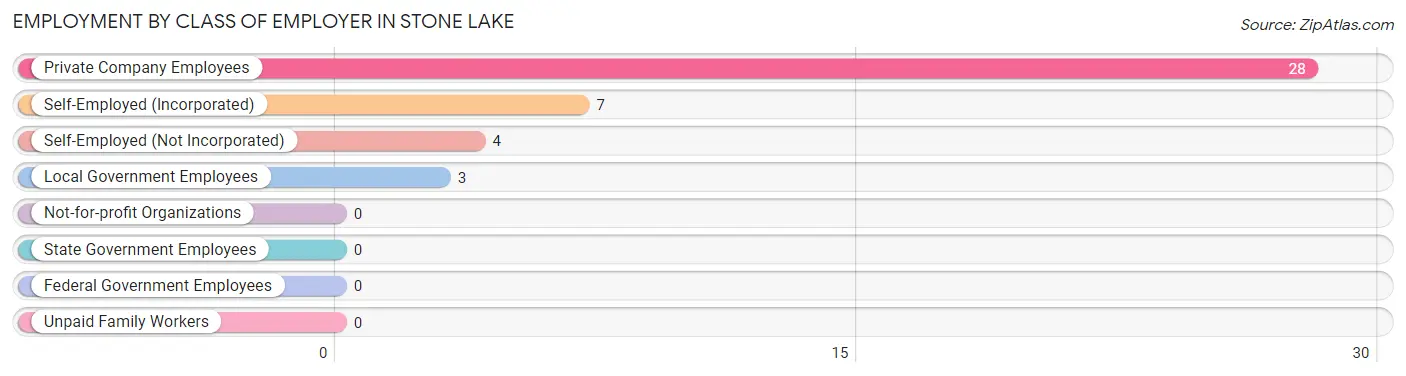
| Employer Class | # Employees | % Employees |
| Private Company Employees | 28 | 66.7% |
| Self-Employed (Incorporated) | 7 | 16.7% |
| Self-Employed (Not Incorporated) | 4 | 9.5% |
| Not-for-profit Organizations | 0 | 0.0% |
| Local Government Employees | 3 | 7.1% |
| State Government Employees | 0 | 0.0% |
| Federal Government Employees | 0 | 0.0% |
| Unpaid Family Workers | 0 | 0.0% |
| Total | 42 | 100.0% |
Employment Status by Age in Stone Lake
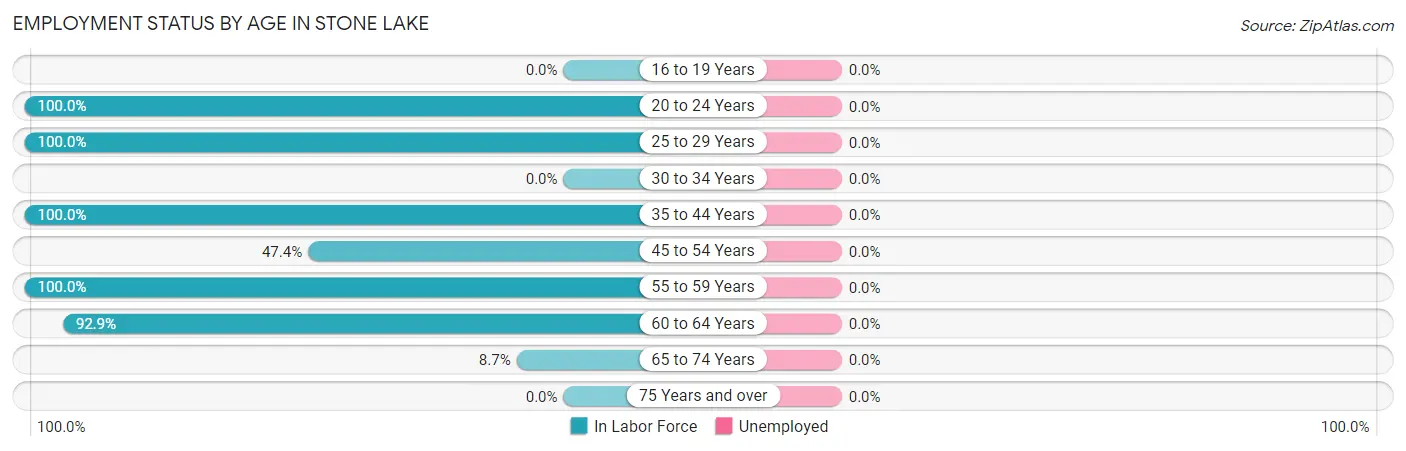
| Age Bracket | In Labor Force | Unemployed |
| 16 to 19 Years | 0 (0.0%) | 0 (0.0%) |
| 20 to 24 Years | 5 (100.0%) | 0 (0.0%) |
| 25 to 29 Years | 4 (100.0%) | 0 (0.0%) |
| 30 to 34 Years | 0 (0.0%) | 0 (0.0%) |
| 35 to 44 Years | 1 (100.0%) | 0 (0.0%) |
| 45 to 54 Years | 9 (47.4%) | 0 (0.0%) |
| 55 to 59 Years | 8 (100.0%) | 0 (0.0%) |
| 60 to 64 Years | 13 (92.9%) | 0 (0.0%) |
| 65 to 74 Years | 2 (8.7%) | 0 (0.0%) |
| 75 Years and over | 0 (0.0%) | 0 (0.0%) |
| Total | 42 (50.6%) | 0 (0.0%) |
Employment Status by Educational Attainment in Stone Lake
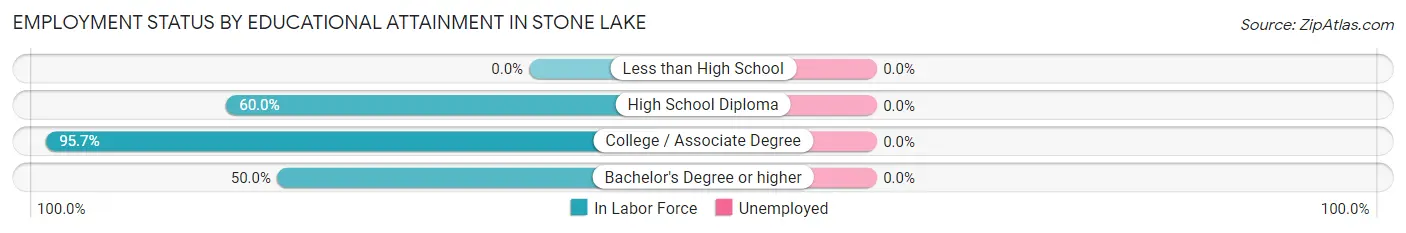
| Educational Attainment | In Labor Force | Unemployed |
| Less than High School | 0 (0.0%) | 0 (0.0%) |
| High School Diploma | 9 (60.0%) | 0 (0.0%) |
| College / Associate Degree | 22 (95.7%) | 0 (0.0%) |
| Bachelor's Degree or higher | 4 (50.0%) | 0 (0.0%) |
| Total | 35 (76.1%) | 0 (0.0%) |
Employment Occupations by Sex in Stone Lake
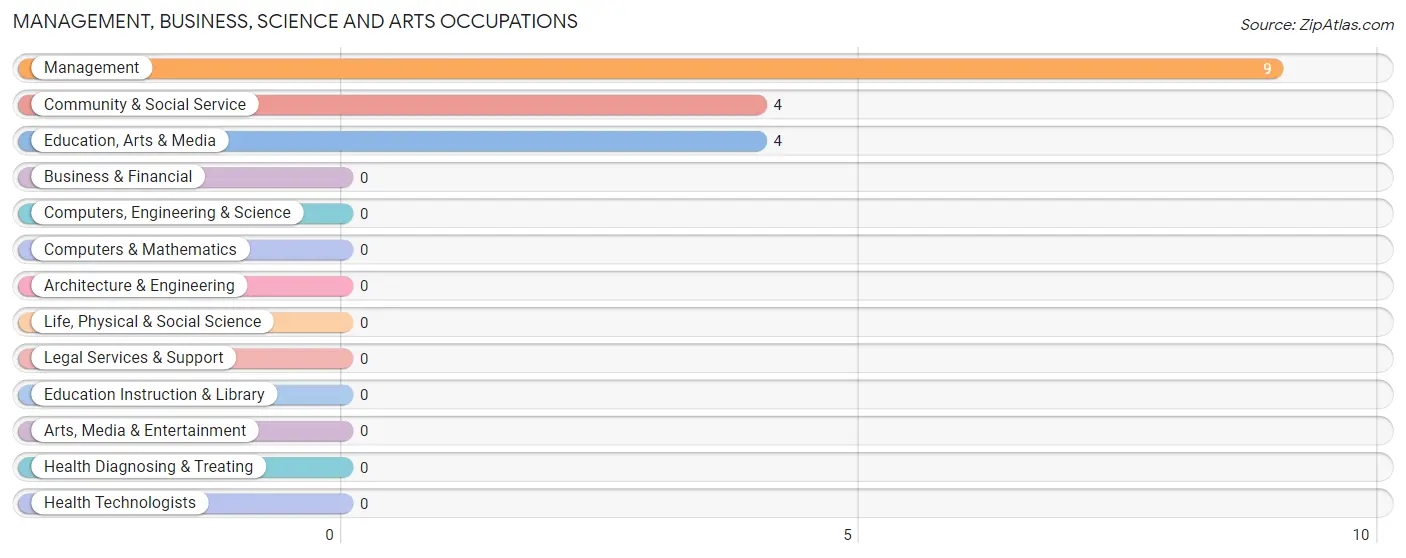
Management, Business, Science and Arts Occupations
The most common Management, Business, Science and Arts occupations in Stone Lake are Management (9 | 21.4%), Community & Social Service (4 | 9.5%), and Education, Arts & Media (4 | 9.5%).
Management, Business, Science and Arts Occupations by Sex
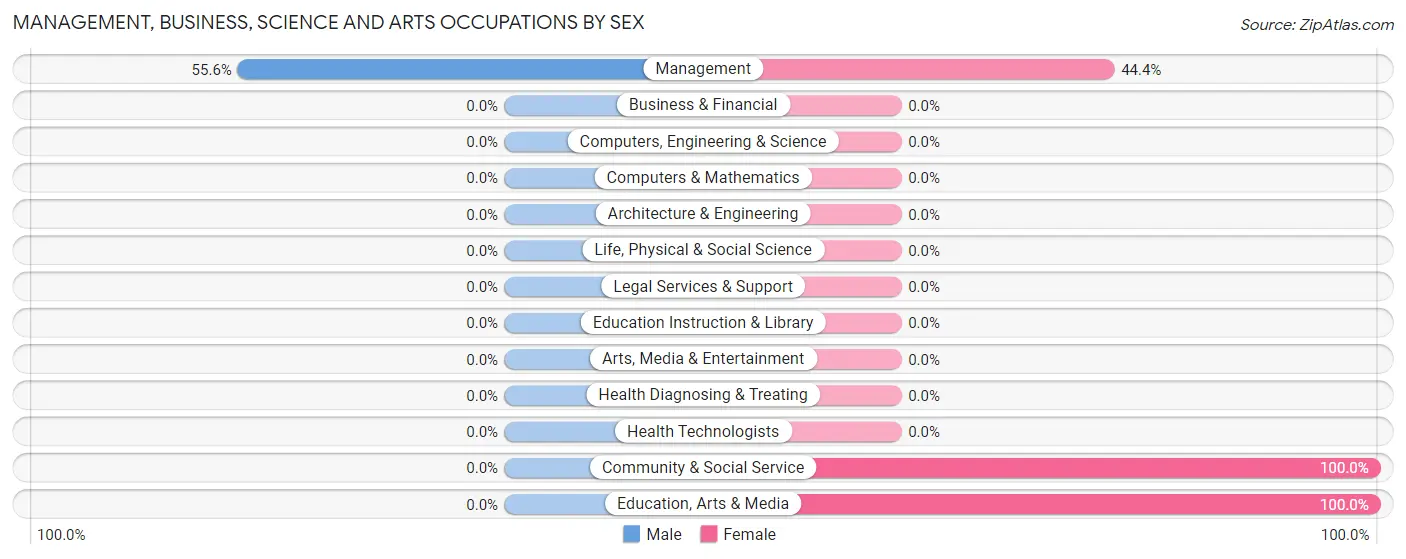
| Occupation | Male | Female |
| Management | 5 (55.6%) | 4 (44.4%) |
| Business & Financial | 0 (0.0%) | 0 (0.0%) |
| Computers, Engineering & Science | 0 (0.0%) | 0 (0.0%) |
| Computers & Mathematics | 0 (0.0%) | 0 (0.0%) |
| Architecture & Engineering | 0 (0.0%) | 0 (0.0%) |
| Life, Physical & Social Science | 0 (0.0%) | 0 (0.0%) |
| Community & Social Service | 0 (0.0%) | 4 (100.0%) |
| Education, Arts & Media | 0 (0.0%) | 4 (100.0%) |
| Legal Services & Support | 0 (0.0%) | 0 (0.0%) |
| Education Instruction & Library | 0 (0.0%) | 0 (0.0%) |
| Arts, Media & Entertainment | 0 (0.0%) | 0 (0.0%) |
| Health Diagnosing & Treating | 0 (0.0%) | 0 (0.0%) |
| Health Technologists | 0 (0.0%) | 0 (0.0%) |
| Total (Category) | 5 (38.5%) | 8 (61.5%) |
| Total (Overall) | 21 (50.0%) | 21 (50.0%) |
Services Occupations
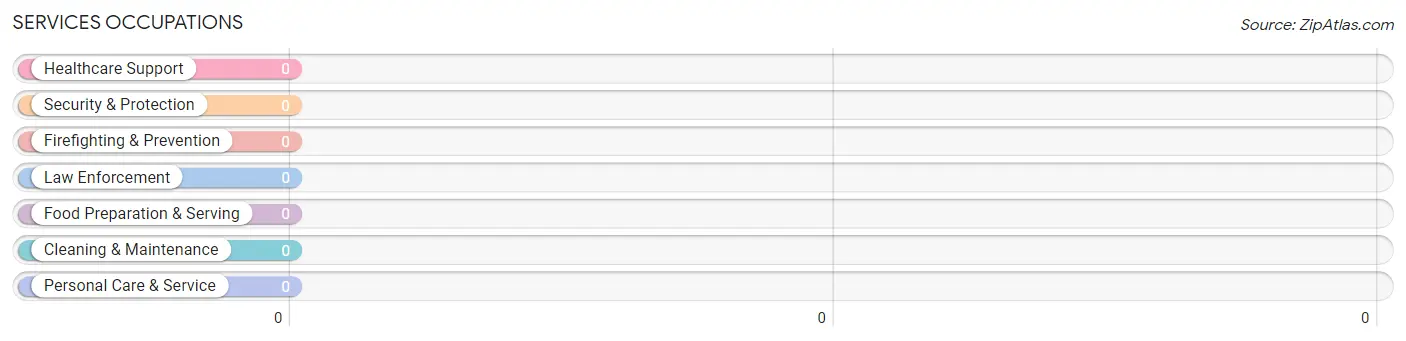
Services Occupations by Sex
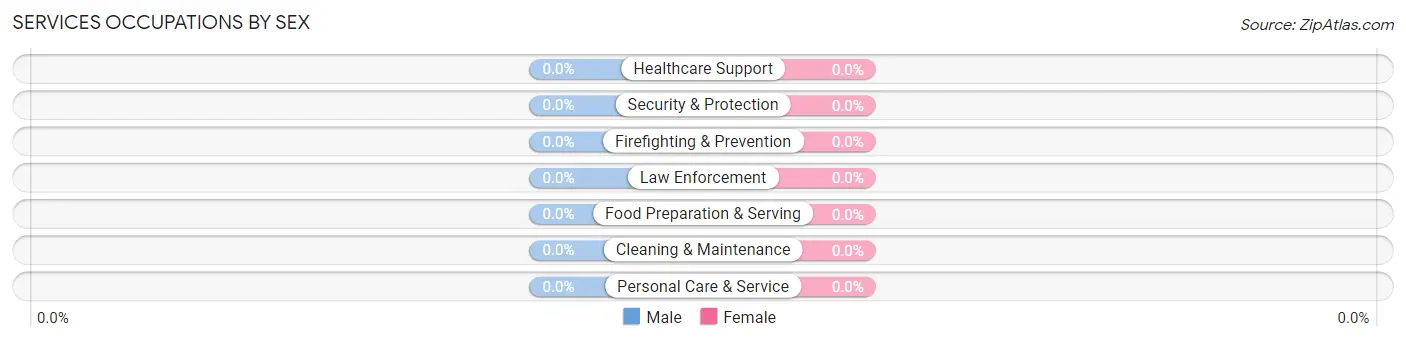
| Occupation | Male | Female |
| Healthcare Support | 0 (0.0%) | 0 (0.0%) |
| Security & Protection | 0 (0.0%) | 0 (0.0%) |
| Firefighting & Prevention | 0 (0.0%) | 0 (0.0%) |
| Law Enforcement | 0 (0.0%) | 0 (0.0%) |
| Food Preparation & Serving | 0 (0.0%) | 0 (0.0%) |
| Cleaning & Maintenance | 0 (0.0%) | 0 (0.0%) |
| Personal Care & Service | 0 (0.0%) | 0 (0.0%) |
| Total (Category) | 0 (0.0%) | 0 (0.0%) |
| Total (Overall) | 21 (50.0%) | 21 (50.0%) |
Sales and Office Occupations
The most common Sales and Office occupations in Stone Lake are Sales & Related (7 | 16.7%), and Office & Administration (4 | 9.5%).
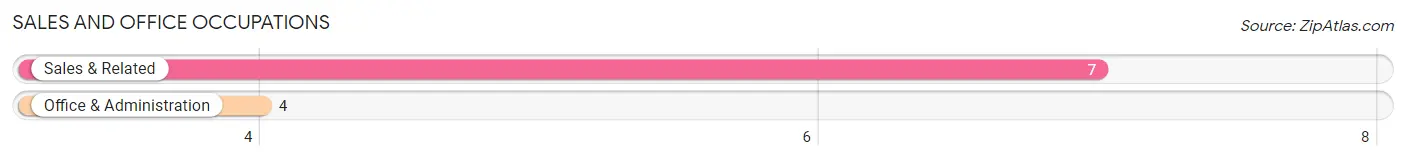
Sales and Office Occupations by Sex
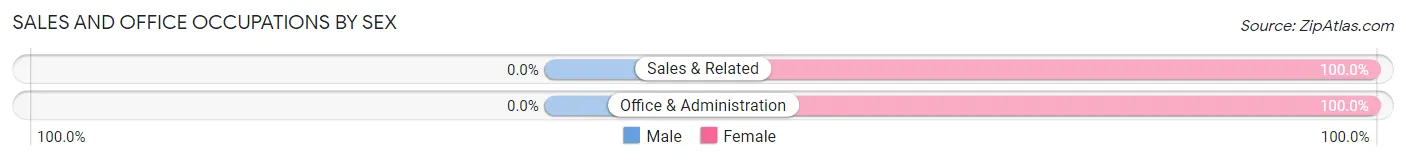
| Occupation | Male | Female |
| Sales & Related | 0 (0.0%) | 7 (100.0%) |
| Office & Administration | 0 (0.0%) | 4 (100.0%) |
| Total (Category) | 0 (0.0%) | 11 (100.0%) |
| Total (Overall) | 21 (50.0%) | 21 (50.0%) |
Natural Resources, Construction and Maintenance Occupations
The most common Natural Resources, Construction and Maintenance occupations in Stone Lake are Construction & Extraction (5 | 11.9%), and Farming, Fishing & Forestry (3 | 7.1%).
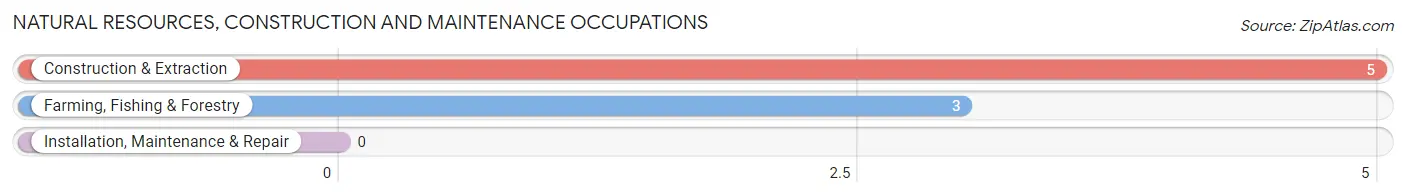
Natural Resources, Construction and Maintenance Occupations by Sex
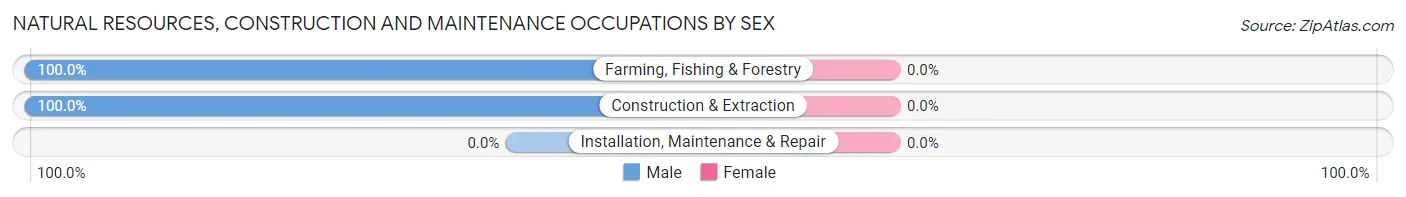
| Occupation | Male | Female |
| Farming, Fishing & Forestry | 3 (100.0%) | 0 (0.0%) |
| Construction & Extraction | 5 (100.0%) | 0 (0.0%) |
| Installation, Maintenance & Repair | 0 (0.0%) | 0 (0.0%) |
| Total (Category) | 8 (100.0%) | 0 (0.0%) |
| Total (Overall) | 21 (50.0%) | 21 (50.0%) |
Production, Transportation and Moving Occupations
The most common Production, Transportation and Moving occupations in Stone Lake are Production (5 | 11.9%), Transportation (3 | 7.1%), and Material Moving (2 | 4.8%).
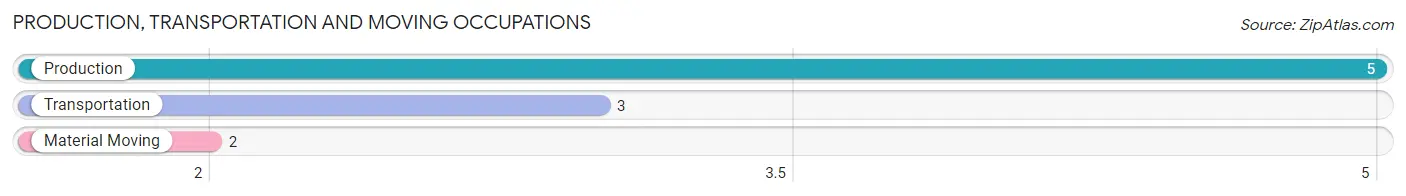
Production, Transportation and Moving Occupations by Sex
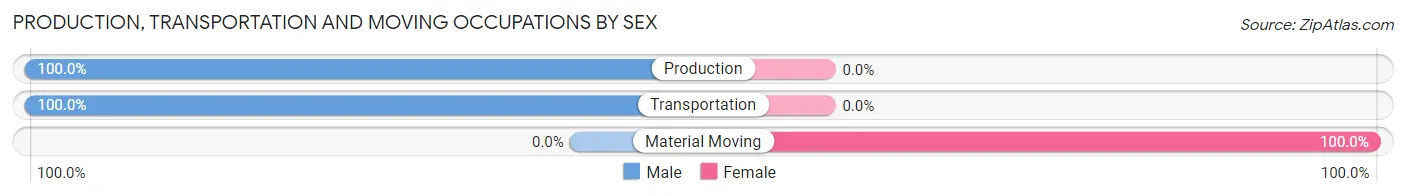
| Occupation | Male | Female |
| Production | 5 (100.0%) | 0 (0.0%) |
| Transportation | 3 (100.0%) | 0 (0.0%) |
| Material Moving | 0 (0.0%) | 2 (100.0%) |
| Total (Category) | 8 (80.0%) | 2 (20.0%) |
| Total (Overall) | 21 (50.0%) | 21 (50.0%) |
Employment Industries by Sex in Stone Lake
Employment Industries in Stone Lake
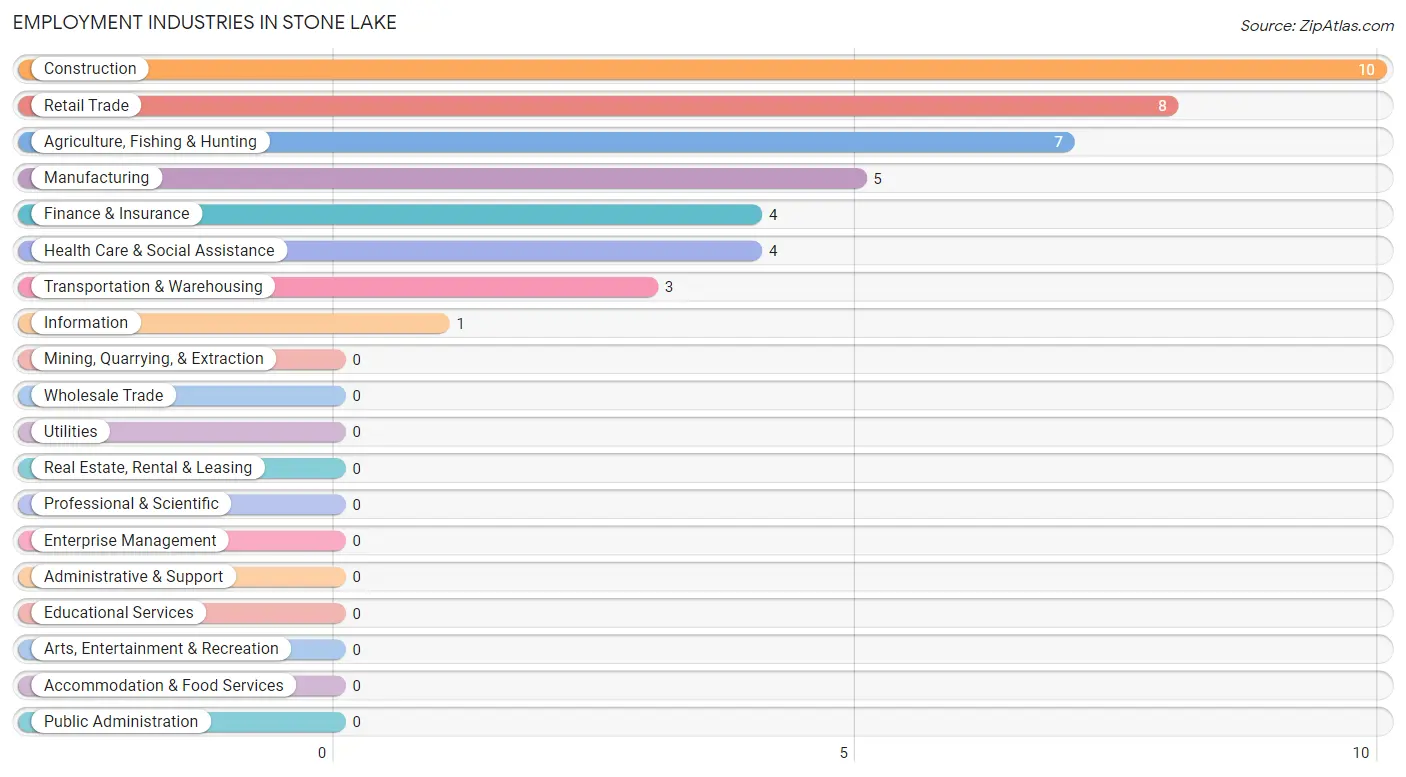
The major employment industries in Stone Lake include Construction (10 | 23.8%), Retail Trade (8 | 19.1%), Agriculture, Fishing & Hunting (7 | 16.7%), Manufacturing (5 | 11.9%), and Finance & Insurance (4 | 9.5%).
Employment Industries by Sex in Stone Lake
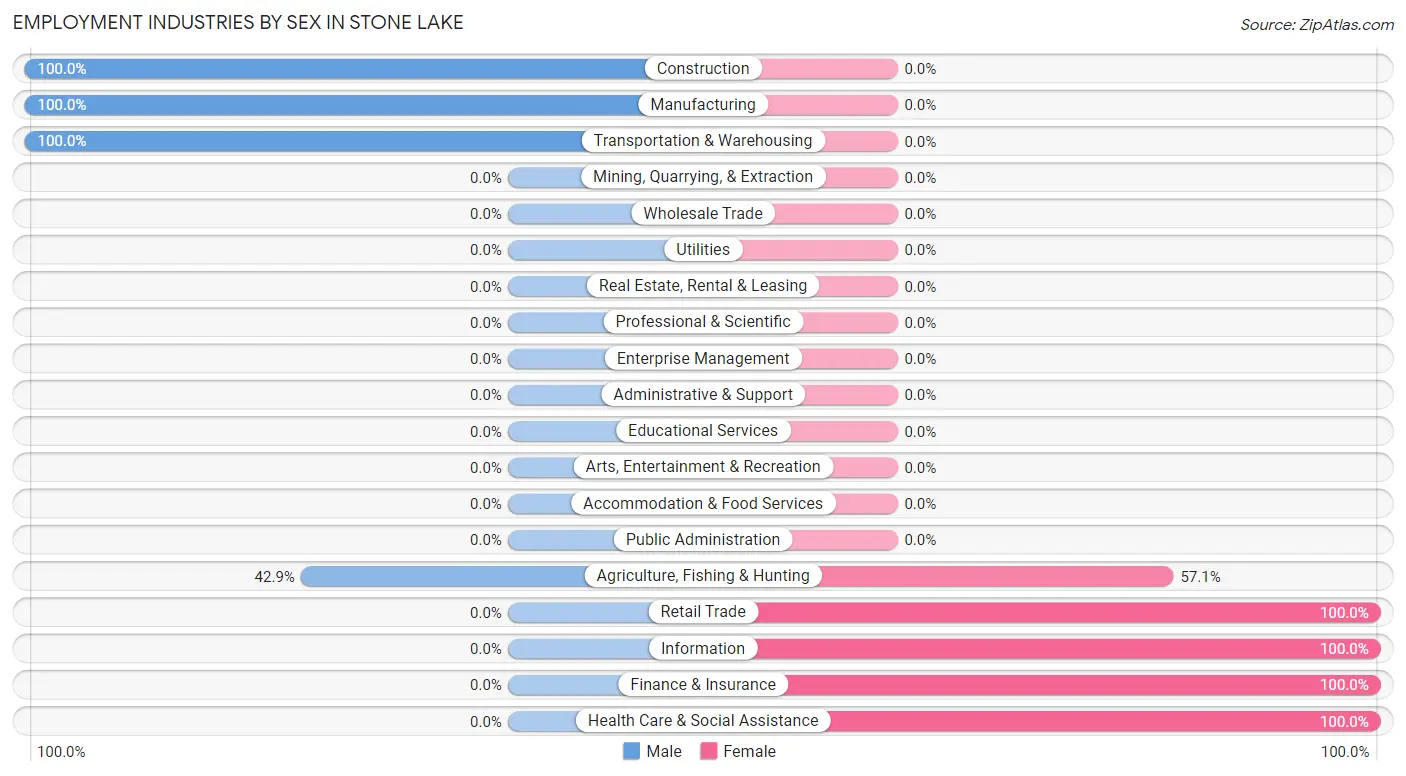
The Stone Lake industries that see more men than women are Construction (100.0%), Manufacturing (100.0%), and Transportation & Warehousing (100.0%), whereas the industries that tend to have a higher number of women are Retail Trade (100.0%), Information (100.0%), and Finance & Insurance (100.0%).
| Industry | Male | Female |
| Agriculture, Fishing & Hunting | 3 (42.9%) | 4 (57.1%) |
| Mining, Quarrying, & Extraction | 0 (0.0%) | 0 (0.0%) |
| Construction | 10 (100.0%) | 0 (0.0%) |
| Manufacturing | 5 (100.0%) | 0 (0.0%) |
| Wholesale Trade | 0 (0.0%) | 0 (0.0%) |
| Retail Trade | 0 (0.0%) | 8 (100.0%) |
| Transportation & Warehousing | 3 (100.0%) | 0 (0.0%) |
| Utilities | 0 (0.0%) | 0 (0.0%) |
| Information | 0 (0.0%) | 1 (100.0%) |
| Finance & Insurance | 0 (0.0%) | 4 (100.0%) |
| Real Estate, Rental & Leasing | 0 (0.0%) | 0 (0.0%) |
| Professional & Scientific | 0 (0.0%) | 0 (0.0%) |
| Enterprise Management | 0 (0.0%) | 0 (0.0%) |
| Administrative & Support | 0 (0.0%) | 0 (0.0%) |
| Educational Services | 0 (0.0%) | 0 (0.0%) |
| Health Care & Social Assistance | 0 (0.0%) | 4 (100.0%) |
| Arts, Entertainment & Recreation | 0 (0.0%) | 0 (0.0%) |
| Accommodation & Food Services | 0 (0.0%) | 0 (0.0%) |
| Public Administration | 0 (0.0%) | 0 (0.0%) |
| Total | 21 (50.0%) | 21 (50.0%) |
Education in Stone Lake
School Enrollment in Stone Lake
| School Level | # Students | % Students |
| Nursery / Preschool | 0 | 0.0% |
| Kindergarten | 0 | 0.0% |
| Elementary School | 0 | 0.0% |
| Middle School | 0 | 0.0% |
| High School | 0 | 0.0% |
| College / Undergraduate | 0 | 0.0% |
| Graduate / Professional | 0 | 0.0% |
| Total | 0 | 0.0% |
School Enrollment by Age by Funding Source in Stone Lake
| Age Bracket | Public School | Private School |
| 3 to 4 Year Olds | 0 (0.0%) | 0 (0.0%) |
| 5 to 9 Year Old | 0 (0.0%) | 0 (0.0%) |
| 10 to 14 Year Olds | 0 (0.0%) | 0 (0.0%) |
| 15 to 17 Year Olds | 0 (0.0%) | 0 (0.0%) |
| 18 to 19 Year Olds | 0 (0.0%) | 0 (0.0%) |
| 20 to 24 Year Olds | 0 (0.0%) | 0 (0.0%) |
| 25 to 34 Year Olds | 0 (0.0%) | 0 (0.0%) |
| 35 Years and over | 0 (0.0%) | 0 (0.0%) |
| Total | 0 (0.0%) | 0 (0.0%) |
Educational Attainment by Field of Study in Stone Lake
Literature & languages (9 | 34.6%), education (6 | 23.1%), science & technology (3 | 11.5%), business (3 | 11.5%), and computers & mathematics (2 | 7.7%) are the most common fields of study among 26 individuals in Stone Lake who have obtained a bachelor's degree or higher.
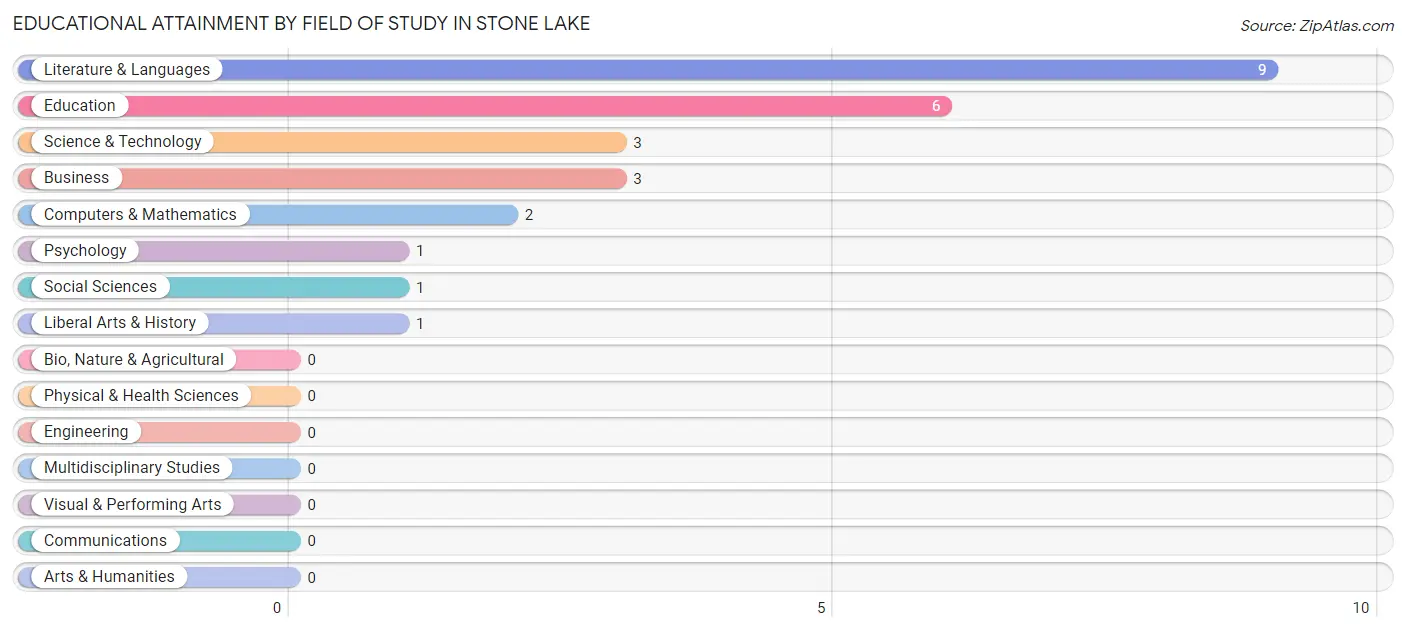
| Field of Study | # Graduates | % Graduates |
| Computers & Mathematics | 2 | 7.7% |
| Bio, Nature & Agricultural | 0 | 0.0% |
| Physical & Health Sciences | 0 | 0.0% |
| Psychology | 1 | 3.8% |
| Social Sciences | 1 | 3.8% |
| Engineering | 0 | 0.0% |
| Multidisciplinary Studies | 0 | 0.0% |
| Science & Technology | 3 | 11.5% |
| Business | 3 | 11.5% |
| Education | 6 | 23.1% |
| Literature & Languages | 9 | 34.6% |
| Liberal Arts & History | 1 | 3.8% |
| Visual & Performing Arts | 0 | 0.0% |
| Communications | 0 | 0.0% |
| Arts & Humanities | 0 | 0.0% |
| Total | 26 | 100.0% |
Transportation & Commute in Stone Lake
Vehicle Availability by Sex in Stone Lake
The most prevalent vehicle ownership categories in Stone Lake are males with 2 vehicles (19, accounting for 90.5%) and females with 2 vehicles (11, making up 90.5%).
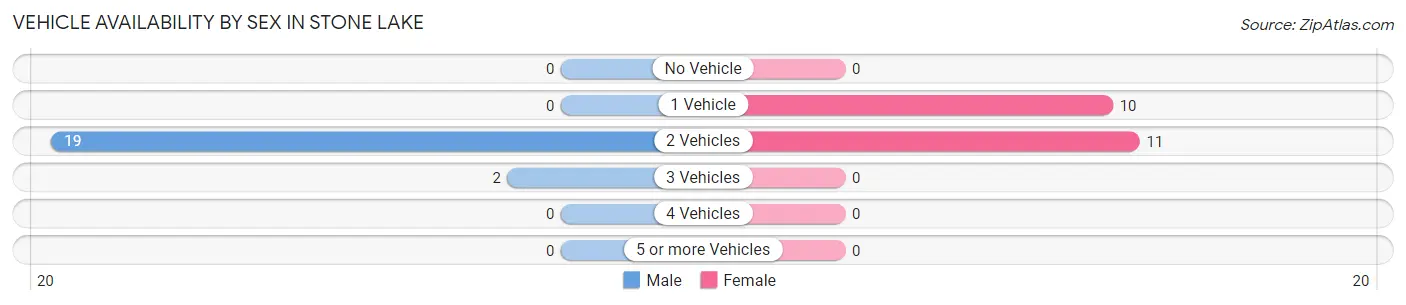
| Vehicles Available | Male | Female |
| No Vehicle | 0 (0.0%) | 0 (0.0%) |
| 1 Vehicle | 0 (0.0%) | 10 (47.6%) |
| 2 Vehicles | 19 (90.5%) | 11 (52.4%) |
| 3 Vehicles | 2 (9.5%) | 0 (0.0%) |
| 4 Vehicles | 0 (0.0%) | 0 (0.0%) |
| 5 or more Vehicles | 0 (0.0%) | 0 (0.0%) |
| Total | 21 (100.0%) | 21 (100.0%) |
Commute Time in Stone Lake
The most frequently occuring commute durations in Stone Lake are 60 to 89 minutes (10 commuters, 30.3%), 20 to 24 minutes (7 commuters, 21.2%), and less than 5 minutes (6 commuters, 18.2%).
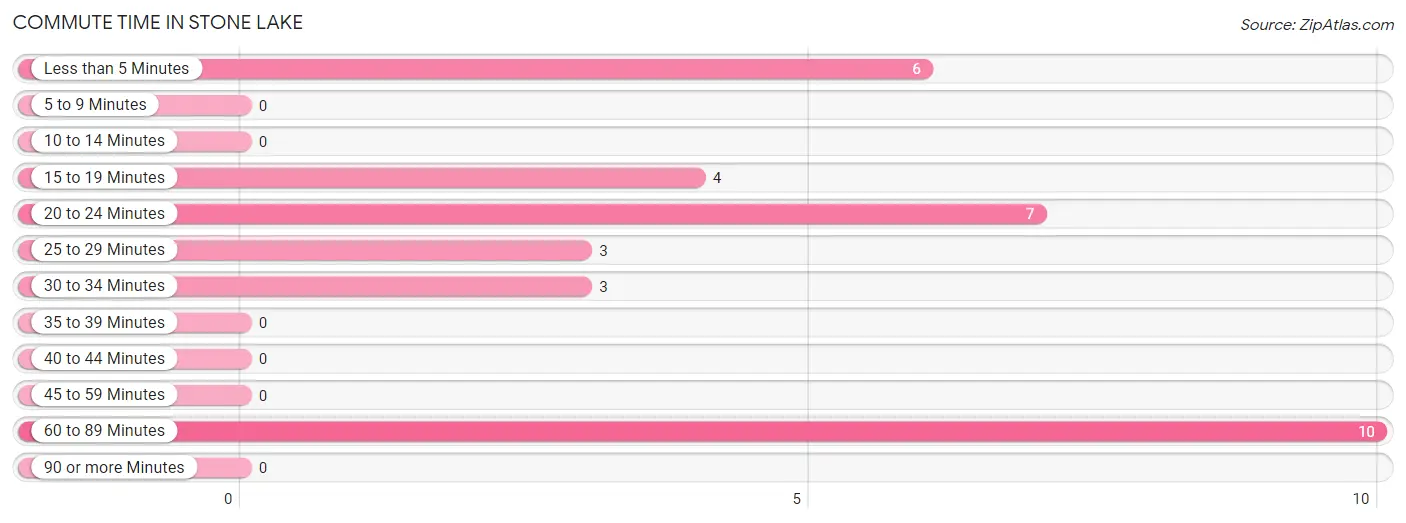
| Commute Time | # Commuters | % Commuters |
| Less than 5 Minutes | 6 | 18.2% |
| 5 to 9 Minutes | 0 | 0.0% |
| 10 to 14 Minutes | 0 | 0.0% |
| 15 to 19 Minutes | 4 | 12.1% |
| 20 to 24 Minutes | 7 | 21.2% |
| 25 to 29 Minutes | 3 | 9.1% |
| 30 to 34 Minutes | 3 | 9.1% |
| 35 to 39 Minutes | 0 | 0.0% |
| 40 to 44 Minutes | 0 | 0.0% |
| 45 to 59 Minutes | 0 | 0.0% |
| 60 to 89 Minutes | 10 | 30.3% |
| 90 or more Minutes | 0 | 0.0% |
Commute Time by Sex in Stone Lake
The most common commute times in Stone Lake are 60 to 89 minutes (10 commuters, 47.6%) for males and less than 5 minutes (6 commuters, 50.0%) for females.
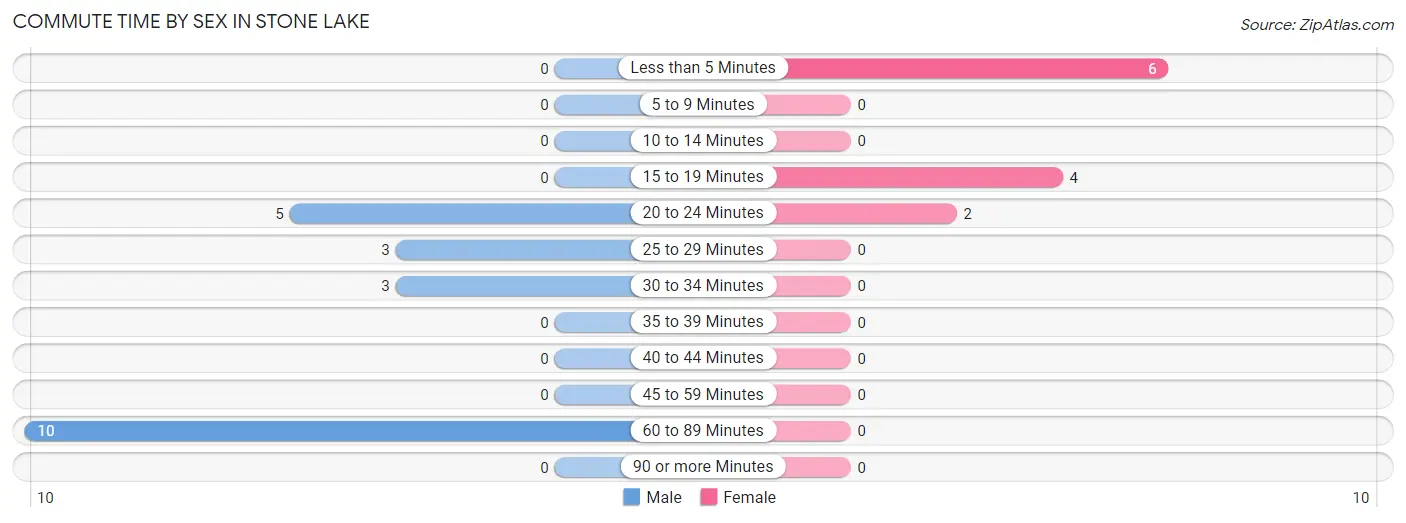
| Commute Time | Male | Female |
| Less than 5 Minutes | 0 (0.0%) | 6 (50.0%) |
| 5 to 9 Minutes | 0 (0.0%) | 0 (0.0%) |
| 10 to 14 Minutes | 0 (0.0%) | 0 (0.0%) |
| 15 to 19 Minutes | 0 (0.0%) | 4 (33.3%) |
| 20 to 24 Minutes | 5 (23.8%) | 2 (16.7%) |
| 25 to 29 Minutes | 3 (14.3%) | 0 (0.0%) |
| 30 to 34 Minutes | 3 (14.3%) | 0 (0.0%) |
| 35 to 39 Minutes | 0 (0.0%) | 0 (0.0%) |
| 40 to 44 Minutes | 0 (0.0%) | 0 (0.0%) |
| 45 to 59 Minutes | 0 (0.0%) | 0 (0.0%) |
| 60 to 89 Minutes | 10 (47.6%) | 0 (0.0%) |
| 90 or more Minutes | 0 (0.0%) | 0 (0.0%) |
Time of Departure to Work by Sex in Stone Lake
The most frequent times of departure to work in Stone Lake are 6:30 AM to 6:59 AM (10, 47.6%) for males and 10:00 AM to 10:59 AM (6, 50.0%) for females.
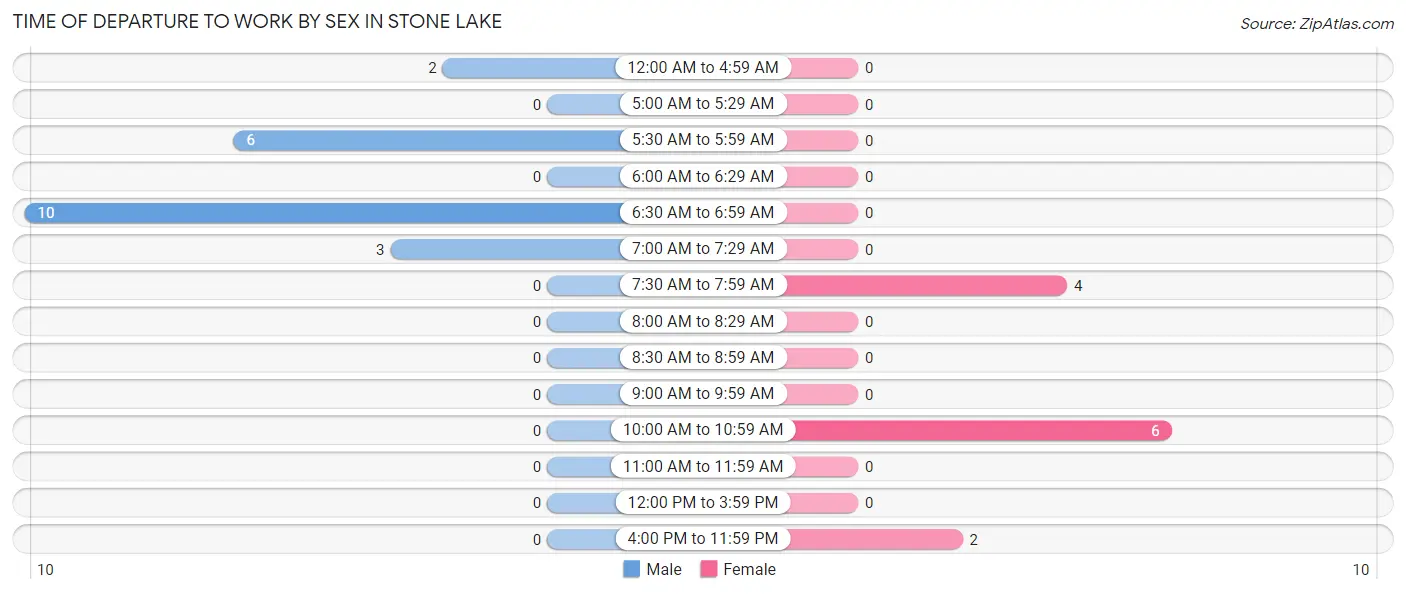
| Time of Departure | Male | Female |
| 12:00 AM to 4:59 AM | 2 (9.5%) | 0 (0.0%) |
| 5:00 AM to 5:29 AM | 0 (0.0%) | 0 (0.0%) |
| 5:30 AM to 5:59 AM | 6 (28.6%) | 0 (0.0%) |
| 6:00 AM to 6:29 AM | 0 (0.0%) | 0 (0.0%) |
| 6:30 AM to 6:59 AM | 10 (47.6%) | 0 (0.0%) |
| 7:00 AM to 7:29 AM | 3 (14.3%) | 0 (0.0%) |
| 7:30 AM to 7:59 AM | 0 (0.0%) | 4 (33.3%) |
| 8:00 AM to 8:29 AM | 0 (0.0%) | 0 (0.0%) |
| 8:30 AM to 8:59 AM | 0 (0.0%) | 0 (0.0%) |
| 9:00 AM to 9:59 AM | 0 (0.0%) | 0 (0.0%) |
| 10:00 AM to 10:59 AM | 0 (0.0%) | 6 (50.0%) |
| 11:00 AM to 11:59 AM | 0 (0.0%) | 0 (0.0%) |
| 12:00 PM to 3:59 PM | 0 (0.0%) | 0 (0.0%) |
| 4:00 PM to 11:59 PM | 0 (0.0%) | 2 (16.7%) |
| Total | 21 (100.0%) | 12 (100.0%) |
Housing Occupancy in Stone Lake
Occupancy by Ownership in Stone Lake
Of the total 48 dwellings in Stone Lake, owner-occupied units account for 44 (91.7%), while renter-occupied units make up 4 (8.3%).
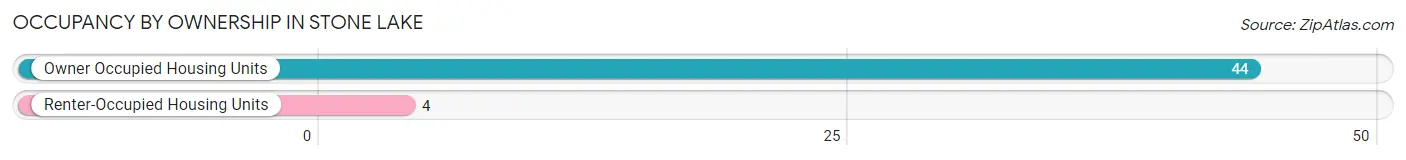
| Occupancy | # Housing Units | % Housing Units |
| Owner Occupied Housing Units | 44 | 91.7% |
| Renter-Occupied Housing Units | 4 | 8.3% |
| Total Occupied Housing Units | 48 | 100.0% |
Occupancy by Household Size in Stone Lake
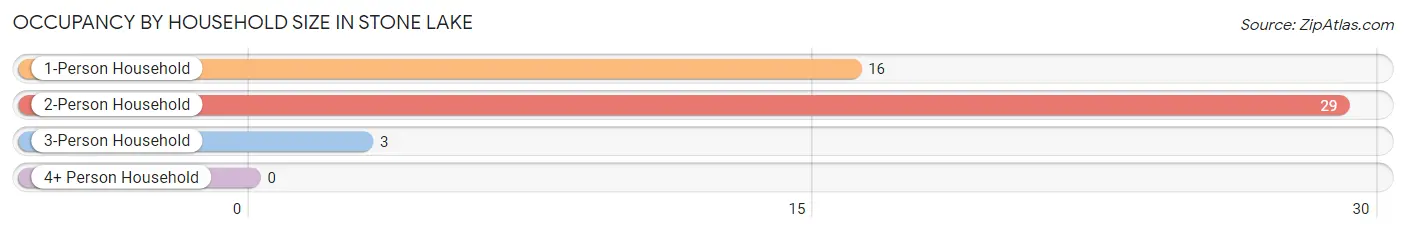
| Household Size | # Housing Units | % Housing Units |
| 1-Person Household | 16 | 33.3% |
| 2-Person Household | 29 | 60.4% |
| 3-Person Household | 3 | 6.2% |
| 4+ Person Household | 0 | 0.0% |
| Total Housing Units | 48 | 100.0% |
Occupancy by Ownership by Household Size in Stone Lake
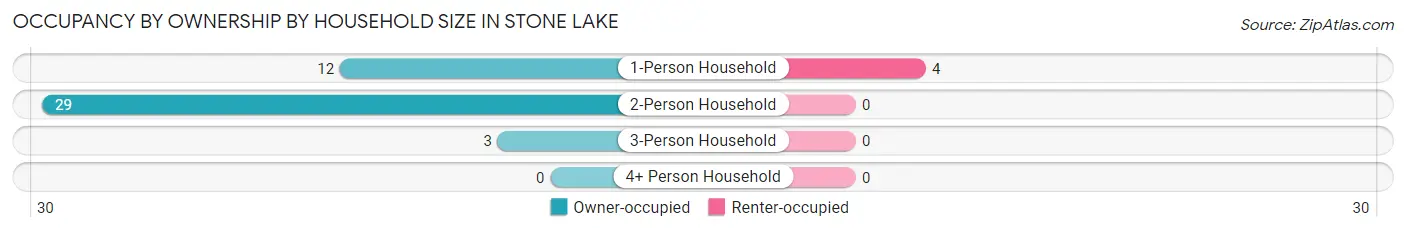
| Household Size | Owner-occupied | Renter-occupied |
| 1-Person Household | 12 (75.0%) | 4 (25.0%) |
| 2-Person Household | 29 (100.0%) | 0 (0.0%) |
| 3-Person Household | 3 (100.0%) | 0 (0.0%) |
| 4+ Person Household | 0 (0.0%) | 0 (0.0%) |
| Total Housing Units | 44 (91.7%) | 4 (8.3%) |
Occupancy by Educational Attainment in Stone Lake
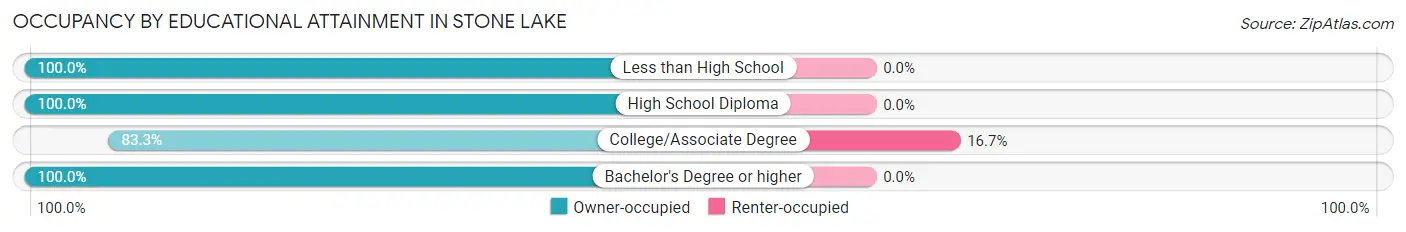
| Household Size | Owner-occupied | Renter-occupied |
| Less than High School | 1 (100.0%) | 0 (0.0%) |
| High School Diploma | 6 (100.0%) | 0 (0.0%) |
| College/Associate Degree | 20 (83.3%) | 4 (16.7%) |
| Bachelor's Degree or higher | 17 (100.0%) | 0 (0.0%) |
Occupancy by Age of Householder in Stone Lake
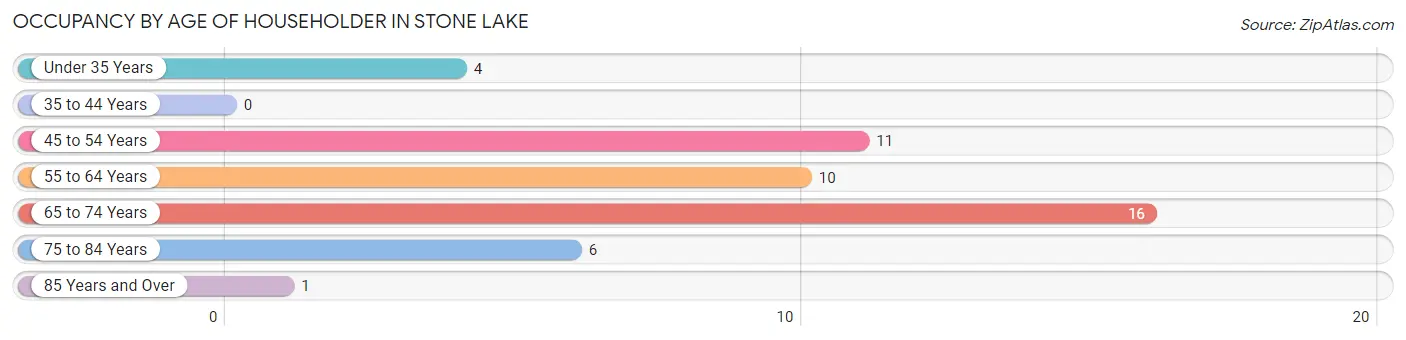
| Age Bracket | # Households | % Households |
| Under 35 Years | 4 | 8.3% |
| 35 to 44 Years | 0 | 0.0% |
| 45 to 54 Years | 11 | 22.9% |
| 55 to 64 Years | 10 | 20.8% |
| 65 to 74 Years | 16 | 33.3% |
| 75 to 84 Years | 6 | 12.5% |
| 85 Years and Over | 1 | 2.1% |
| Total | 48 | 100.0% |
Housing Finances in Stone Lake
Median Income by Occupancy in Stone Lake
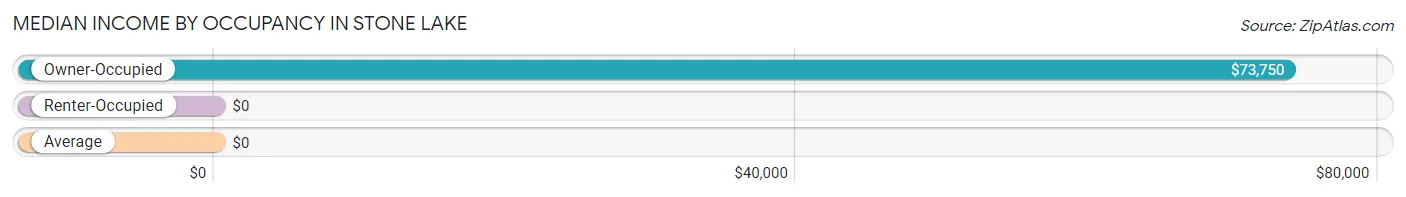
| Occupancy Type | # Households | Median Income |
| Owner-Occupied | 44 (91.7%) | $73,750 |
| Renter-Occupied | 4 (8.3%) | $0 |
| Average | 48 (100.0%) | $0 |
Occupancy by Householder Income Bracket in Stone Lake
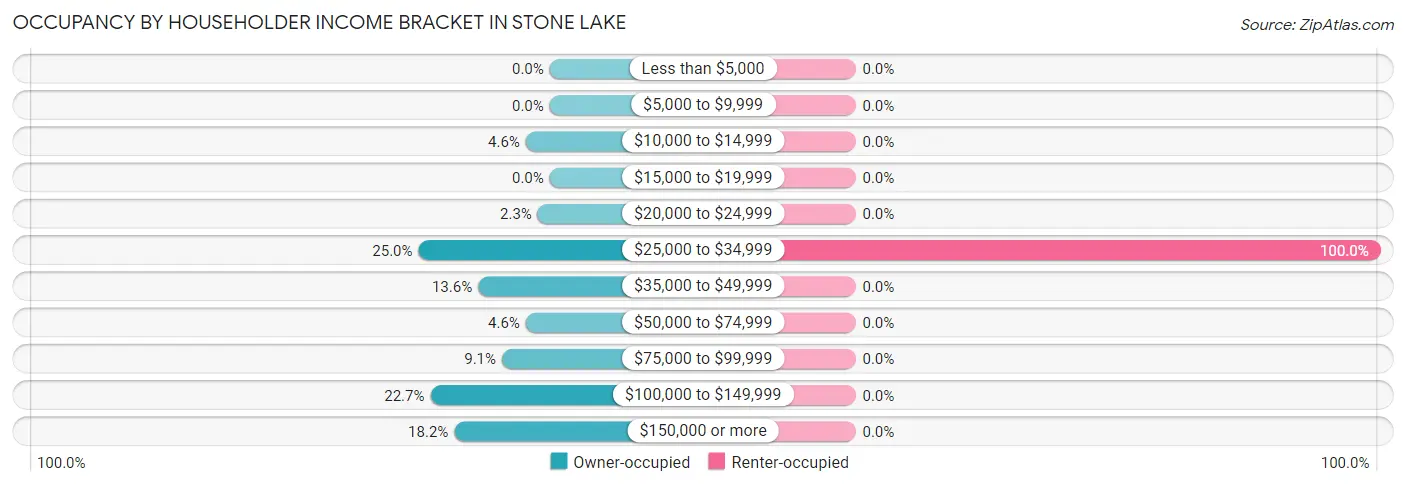
| Income Bracket | Owner-occupied | Renter-occupied |
| Less than $5,000 | 0 (0.0%) | 0 (0.0%) |
| $5,000 to $9,999 | 0 (0.0%) | 0 (0.0%) |
| $10,000 to $14,999 | 2 (4.5%) | 0 (0.0%) |
| $15,000 to $19,999 | 0 (0.0%) | 0 (0.0%) |
| $20,000 to $24,999 | 1 (2.3%) | 0 (0.0%) |
| $25,000 to $34,999 | 11 (25.0%) | 4 (100.0%) |
| $35,000 to $49,999 | 6 (13.6%) | 0 (0.0%) |
| $50,000 to $74,999 | 2 (4.5%) | 0 (0.0%) |
| $75,000 to $99,999 | 4 (9.1%) | 0 (0.0%) |
| $100,000 to $149,999 | 10 (22.7%) | 0 (0.0%) |
| $150,000 or more | 8 (18.2%) | 0 (0.0%) |
| Total | 44 (100.0%) | 4 (100.0%) |
Monthly Housing Cost Tiers in Stone Lake
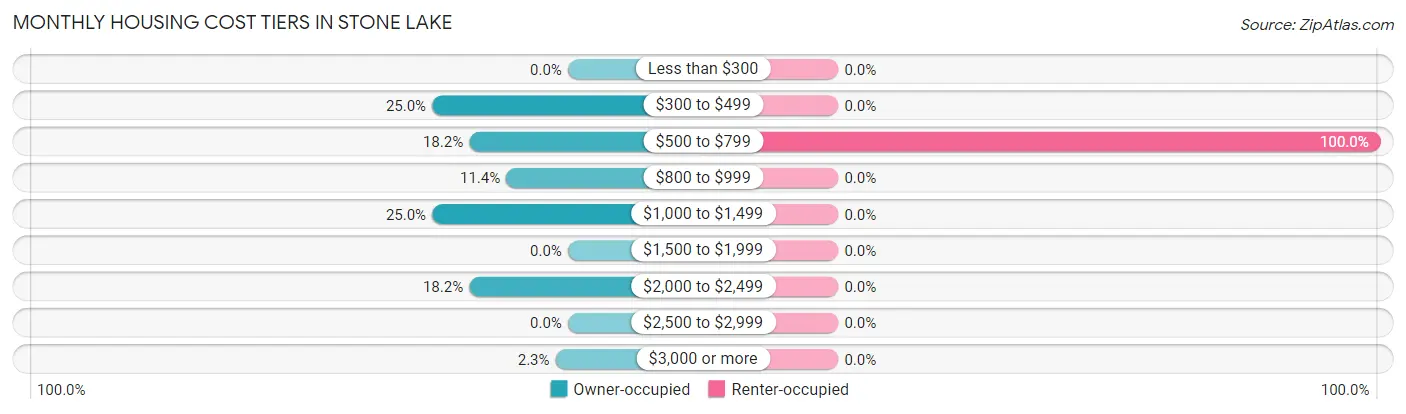
| Monthly Cost | Owner-occupied | Renter-occupied |
| Less than $300 | 0 (0.0%) | 0 (0.0%) |
| $300 to $499 | 11 (25.0%) | 0 (0.0%) |
| $500 to $799 | 8 (18.2%) | 4 (100.0%) |
| $800 to $999 | 5 (11.4%) | 0 (0.0%) |
| $1,000 to $1,499 | 11 (25.0%) | 0 (0.0%) |
| $1,500 to $1,999 | 0 (0.0%) | 0 (0.0%) |
| $2,000 to $2,499 | 8 (18.2%) | 0 (0.0%) |
| $2,500 to $2,999 | 0 (0.0%) | 0 (0.0%) |
| $3,000 or more | 1 (2.3%) | 0 (0.0%) |
| Total | 44 (100.0%) | 4 (100.0%) |
Physical Housing Characteristics in Stone Lake
Housing Structures in Stone Lake
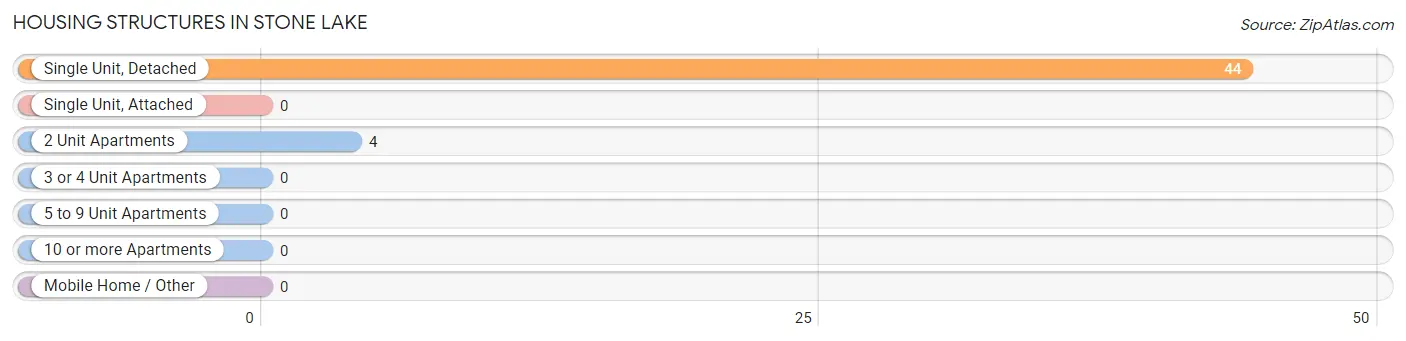
| Structure Type | # Housing Units | % Housing Units |
| Single Unit, Detached | 44 | 91.7% |
| Single Unit, Attached | 0 | 0.0% |
| 2 Unit Apartments | 4 | 8.3% |
| 3 or 4 Unit Apartments | 0 | 0.0% |
| 5 to 9 Unit Apartments | 0 | 0.0% |
| 10 or more Apartments | 0 | 0.0% |
| Mobile Home / Other | 0 | 0.0% |
| Total | 48 | 100.0% |
Housing Structures by Occupancy in Stone Lake
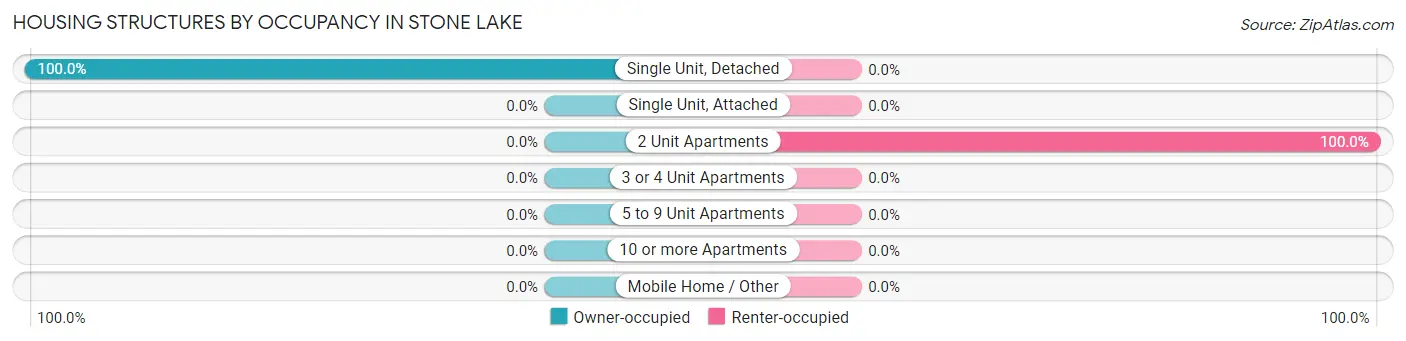
| Structure Type | Owner-occupied | Renter-occupied |
| Single Unit, Detached | 44 (100.0%) | 0 (0.0%) |
| Single Unit, Attached | 0 (0.0%) | 0 (0.0%) |
| 2 Unit Apartments | 0 (0.0%) | 4 (100.0%) |
| 3 or 4 Unit Apartments | 0 (0.0%) | 0 (0.0%) |
| 5 to 9 Unit Apartments | 0 (0.0%) | 0 (0.0%) |
| 10 or more Apartments | 0 (0.0%) | 0 (0.0%) |
| Mobile Home / Other | 0 (0.0%) | 0 (0.0%) |
| Total | 44 (91.7%) | 4 (8.3%) |
Housing Structures by Number of Rooms in Stone Lake
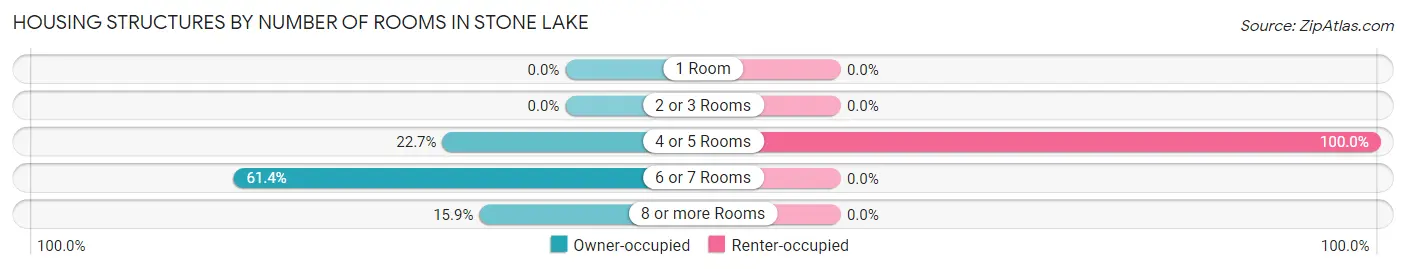
| Number of Rooms | Owner-occupied | Renter-occupied |
| 1 Room | 0 (0.0%) | 0 (0.0%) |
| 2 or 3 Rooms | 0 (0.0%) | 0 (0.0%) |
| 4 or 5 Rooms | 10 (22.7%) | 4 (100.0%) |
| 6 or 7 Rooms | 27 (61.4%) | 0 (0.0%) |
| 8 or more Rooms | 7 (15.9%) | 0 (0.0%) |
| Total | 44 (100.0%) | 4 (100.0%) |
Housing Structure by Heating Type in Stone Lake
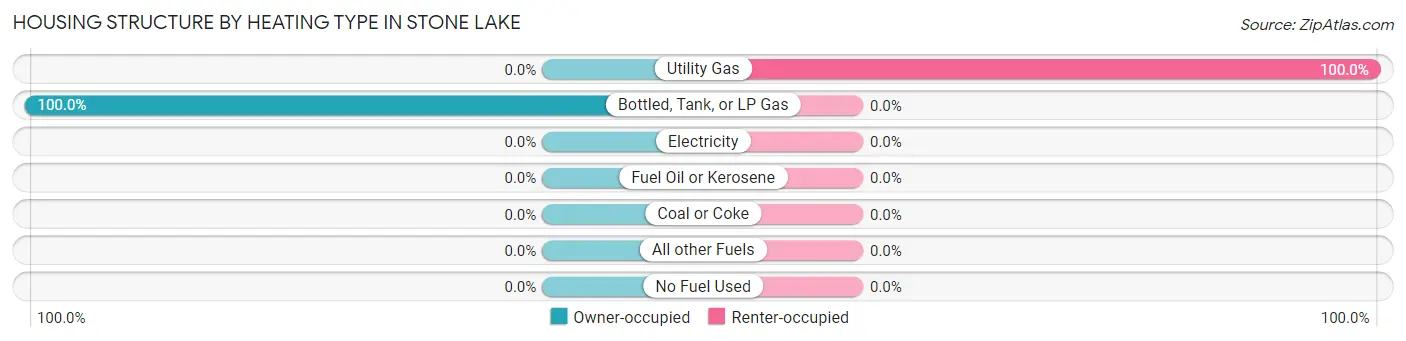
| Heating Type | Owner-occupied | Renter-occupied |
| Utility Gas | 0 (0.0%) | 4 (100.0%) |
| Bottled, Tank, or LP Gas | 44 (100.0%) | 0 (0.0%) |
| Electricity | 0 (0.0%) | 0 (0.0%) |
| Fuel Oil or Kerosene | 0 (0.0%) | 0 (0.0%) |
| Coal or Coke | 0 (0.0%) | 0 (0.0%) |
| All other Fuels | 0 (0.0%) | 0 (0.0%) |
| No Fuel Used | 0 (0.0%) | 0 (0.0%) |
| Total | 44 (100.0%) | 4 (100.0%) |
Household Vehicle Usage in Stone Lake
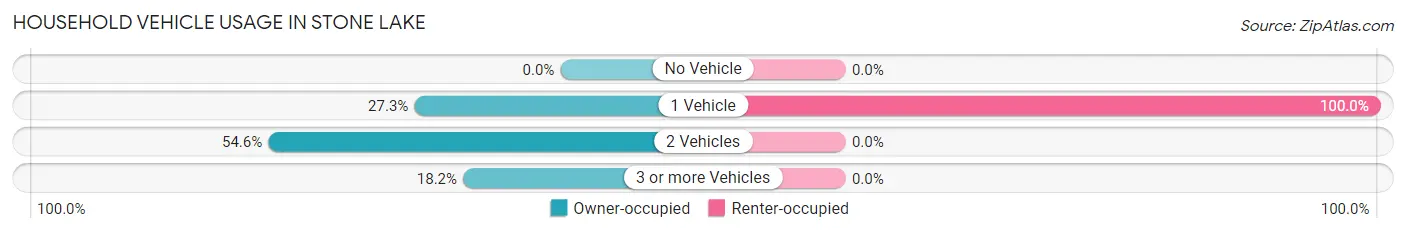
| Vehicles per Household | Owner-occupied | Renter-occupied |
| No Vehicle | 0 (0.0%) | 0 (0.0%) |
| 1 Vehicle | 12 (27.3%) | 4 (100.0%) |
| 2 Vehicles | 24 (54.5%) | 0 (0.0%) |
| 3 or more Vehicles | 8 (18.2%) | 0 (0.0%) |
| Total | 44 (100.0%) | 4 (100.0%) |
Real Estate & Mortgages in Stone Lake
Real Estate and Mortgage Overview in Stone Lake
| Characteristic | Without Mortgage | With Mortgage |
| Housing Units | 23 | 21 |
| Median Property Value | $212,500 | $275,000 |
| Median Household Income | $111,875 | $3 |
| Monthly Housing Costs | $510 | $1 |
| Real Estate Taxes | $3,167 | $0 |
Property Value by Mortgage Status in Stone Lake
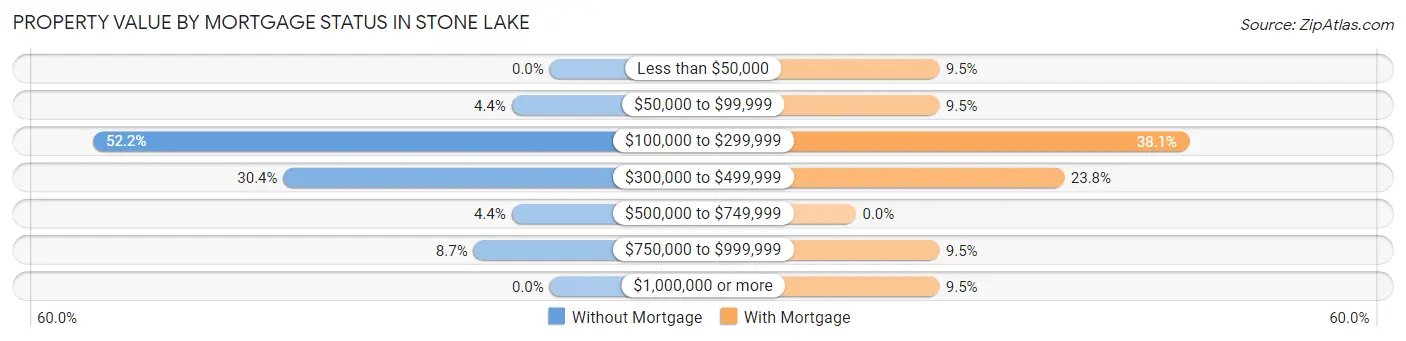
| Property Value | Without Mortgage | With Mortgage |
| Less than $50,000 | 0 (0.0%) | 2 (9.5%) |
| $50,000 to $99,999 | 1 (4.3%) | 2 (9.5%) |
| $100,000 to $299,999 | 12 (52.2%) | 8 (38.1%) |
| $300,000 to $499,999 | 7 (30.4%) | 5 (23.8%) |
| $500,000 to $749,999 | 1 (4.3%) | 0 (0.0%) |
| $750,000 to $999,999 | 2 (8.7%) | 2 (9.5%) |
| $1,000,000 or more | 0 (0.0%) | 2 (9.5%) |
| Total | 23 (100.0%) | 21 (100.0%) |
Household Income by Mortgage Status in Stone Lake
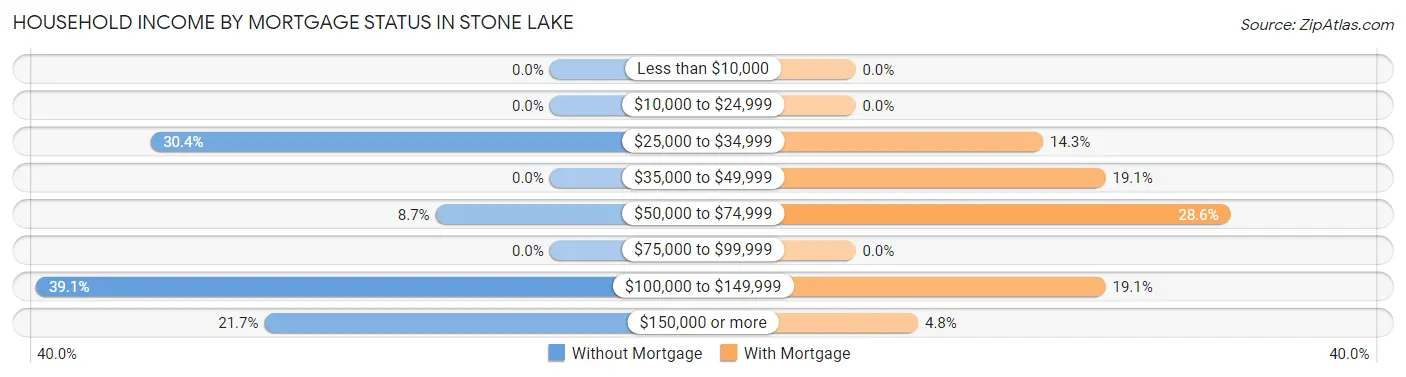
| Household Income | Without Mortgage | With Mortgage |
| Less than $10,000 | 0 (0.0%) | 0 (0.0%) |
| $10,000 to $24,999 | 0 (0.0%) | 0 (0.0%) |
| $25,000 to $34,999 | 7 (30.4%) | 3 (14.3%) |
| $35,000 to $49,999 | 0 (0.0%) | 4 (19.1%) |
| $50,000 to $74,999 | 2 (8.7%) | 6 (28.6%) |
| $75,000 to $99,999 | 0 (0.0%) | 0 (0.0%) |
| $100,000 to $149,999 | 9 (39.1%) | 4 (19.1%) |
| $150,000 or more | 5 (21.7%) | 1 (4.8%) |
| Total | 23 (100.0%) | 21 (100.0%) |
Property Value to Household Income Ratio in Stone Lake
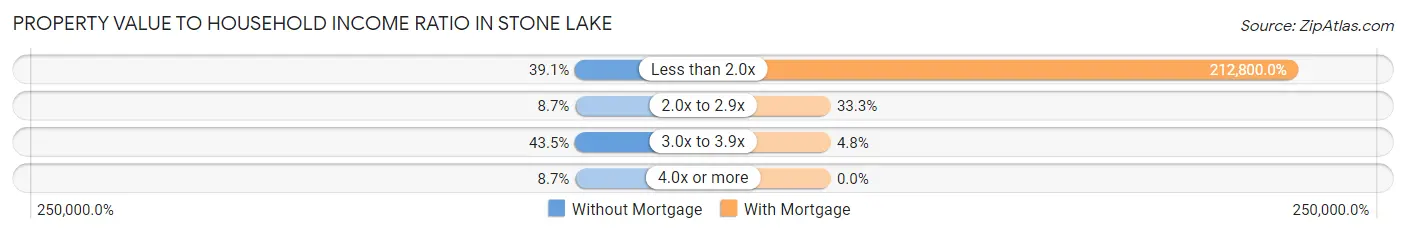
| Value-to-Income Ratio | Without Mortgage | With Mortgage |
| Less than 2.0x | 9 (39.1%) | 44,688 (212,800.0%) |
| 2.0x to 2.9x | 2 (8.7%) | 7 (33.3%) |
| 3.0x to 3.9x | 10 (43.5%) | 1 (4.8%) |
| 4.0x or more | 2 (8.7%) | 0 (0.0%) |
| Total | 23 (100.0%) | 21 (100.0%) |
Real Estate Taxes by Mortgage Status in Stone Lake
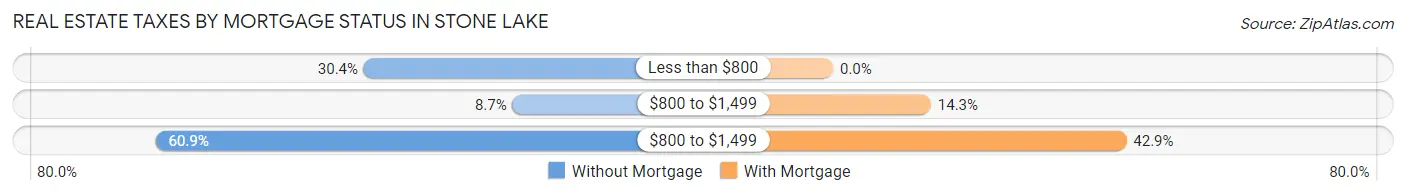
| Property Taxes | Without Mortgage | With Mortgage |
| Less than $800 | 7 (30.4%) | 0 (0.0%) |
| $800 to $1,499 | 2 (8.7%) | 3 (14.3%) |
| $800 to $1,499 | 14 (60.9%) | 9 (42.9%) |
| Total | 23 (100.0%) | 21 (100.0%) |
Health & Disability in Stone Lake
Health Insurance Coverage by Age in Stone Lake
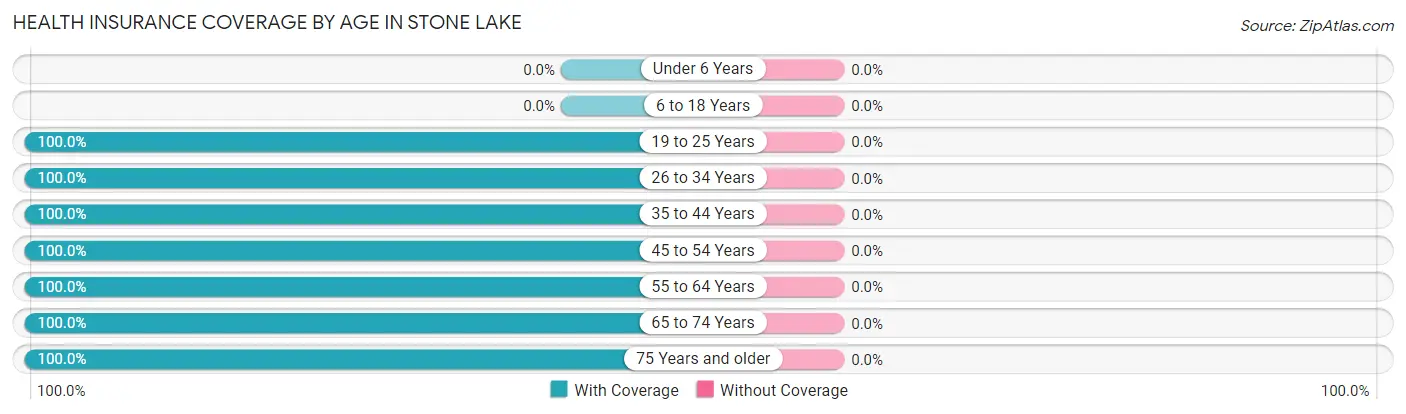
| Age Bracket | With Coverage | Without Coverage |
| Under 6 Years | 0 (0.0%) | 0 (0.0%) |
| 6 to 18 Years | 0 (0.0%) | 0 (0.0%) |
| 19 to 25 Years | 5 (100.0%) | 0 (0.0%) |
| 26 to 34 Years | 4 (100.0%) | 0 (0.0%) |
| 35 to 44 Years | 1 (100.0%) | 0 (0.0%) |
| 45 to 54 Years | 19 (100.0%) | 0 (0.0%) |
| 55 to 64 Years | 22 (100.0%) | 0 (0.0%) |
| 65 to 74 Years | 23 (100.0%) | 0 (0.0%) |
| 75 Years and older | 9 (100.0%) | 0 (0.0%) |
| Total | 83 (100.0%) | 0 (0.0%) |
Health Insurance Coverage by Citizenship Status in Stone Lake
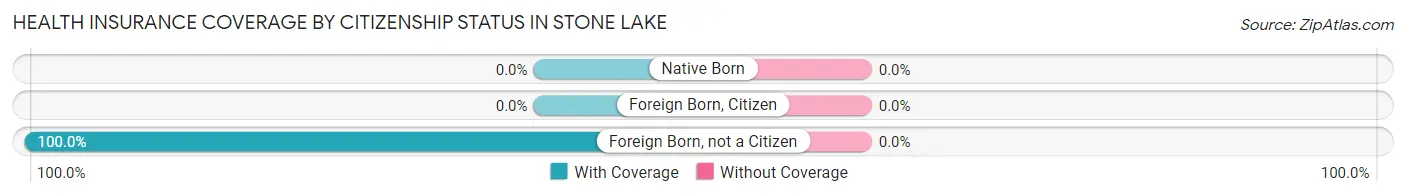
| Citizenship Status | With Coverage | Without Coverage |
| Native Born | 0 (0.0%) | 0 (0.0%) |
| Foreign Born, Citizen | 0 (0.0%) | 0 (0.0%) |
| Foreign Born, not a Citizen | 5 (100.0%) | 0 (0.0%) |
Health Insurance Coverage by Household Income in Stone Lake
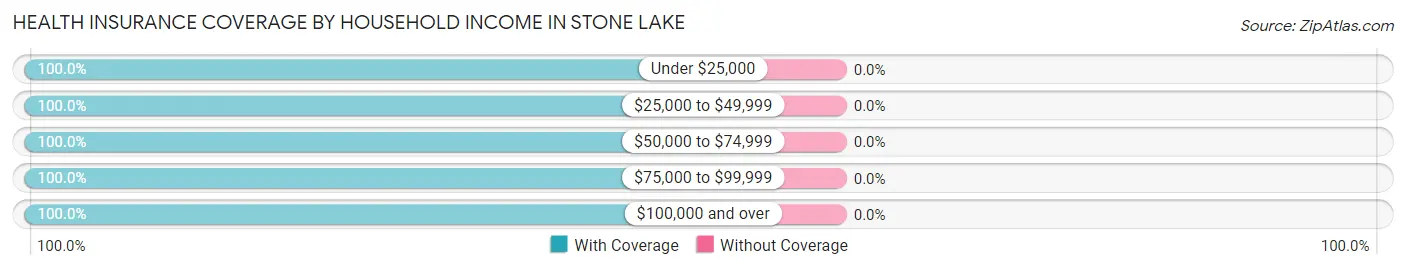
| Household Income | With Coverage | Without Coverage |
| Under $25,000 | 7 (100.0%) | 0 (0.0%) |
| $25,000 to $49,999 | 28 (100.0%) | 0 (0.0%) |
| $50,000 to $74,999 | 4 (100.0%) | 0 (0.0%) |
| $75,000 to $99,999 | 8 (100.0%) | 0 (0.0%) |
| $100,000 and over | 36 (100.0%) | 0 (0.0%) |
Public vs Private Health Insurance Coverage by Age in Stone Lake
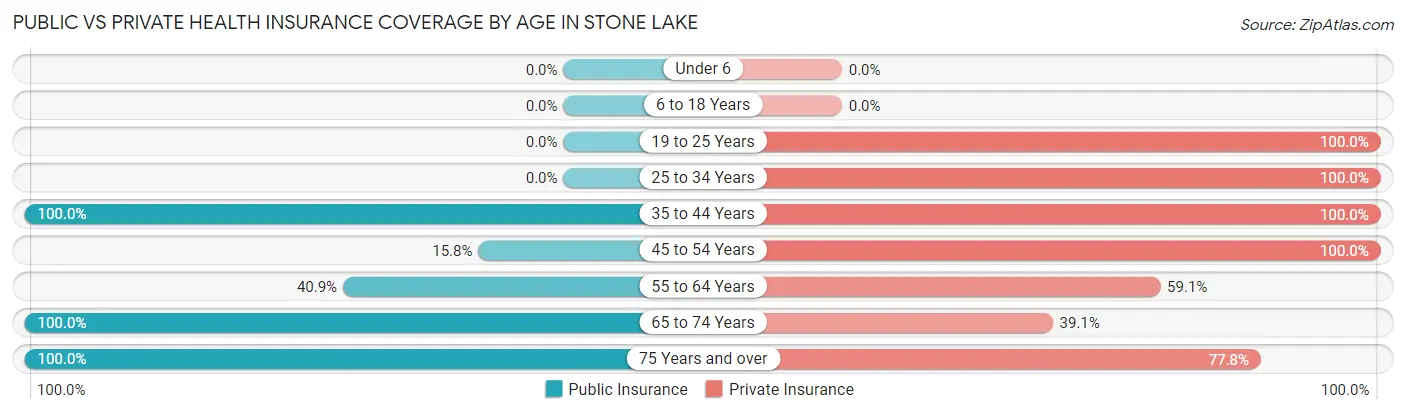
| Age Bracket | Public Insurance | Private Insurance |
| Under 6 | 0 (0.0%) | 0 (0.0%) |
| 6 to 18 Years | 0 (0.0%) | 0 (0.0%) |
| 19 to 25 Years | 0 (0.0%) | 5 (100.0%) |
| 25 to 34 Years | 0 (0.0%) | 4 (100.0%) |
| 35 to 44 Years | 1 (100.0%) | 1 (100.0%) |
| 45 to 54 Years | 3 (15.8%) | 19 (100.0%) |
| 55 to 64 Years | 9 (40.9%) | 13 (59.1%) |
| 65 to 74 Years | 23 (100.0%) | 9 (39.1%) |
| 75 Years and over | 9 (100.0%) | 7 (77.8%) |
| Total | 45 (54.2%) | 58 (69.9%) |
Disability Status by Sex by Age in Stone Lake
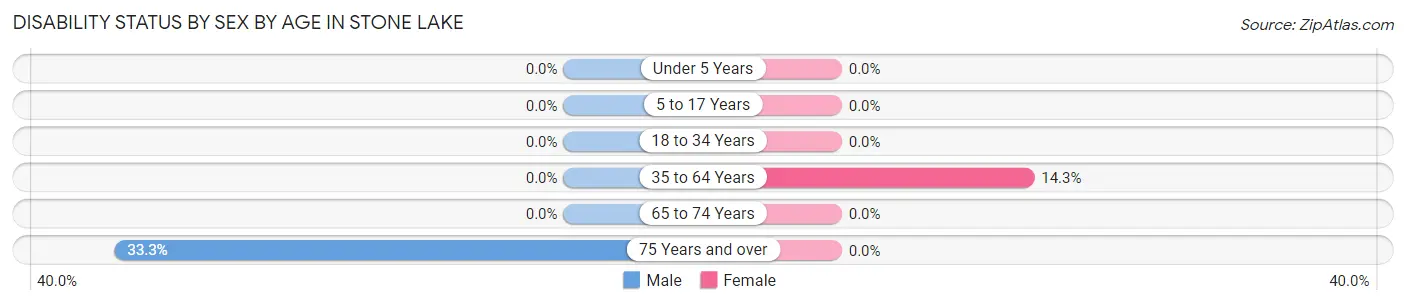
| Age Bracket | Male | Female |
| Under 5 Years | 0 (0.0%) | 0 (0.0%) |
| 5 to 17 Years | 0 (0.0%) | 0 (0.0%) |
| 18 to 34 Years | 0 (0.0%) | 0 (0.0%) |
| 35 to 64 Years | 0 (0.0%) | 4 (14.3%) |
| 65 to 74 Years | 0 (0.0%) | 0 (0.0%) |
| 75 Years and over | 2 (33.3%) | 0 (0.0%) |
Disability Class by Sex by Age in Stone Lake
Disability Class: Hearing Difficulty
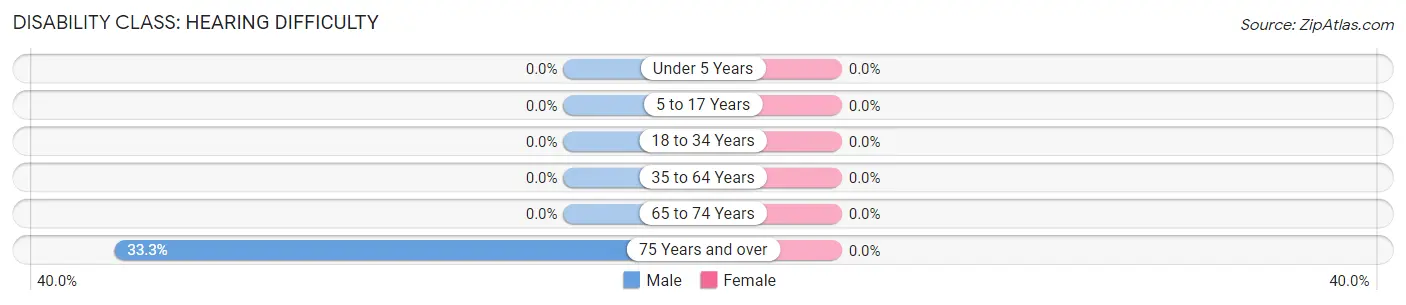
| Age Bracket | Male | Female |
| Under 5 Years | 0 (0.0%) | 0 (0.0%) |
| 5 to 17 Years | 0 (0.0%) | 0 (0.0%) |
| 18 to 34 Years | 0 (0.0%) | 0 (0.0%) |
| 35 to 64 Years | 0 (0.0%) | 0 (0.0%) |
| 65 to 74 Years | 0 (0.0%) | 0 (0.0%) |
| 75 Years and over | 2 (33.3%) | 0 (0.0%) |
Disability Class: Vision Difficulty
| Age Bracket | Male | Female |
| Under 5 Years | 0 (0.0%) | 0 (0.0%) |
| 5 to 17 Years | 0 (0.0%) | 0 (0.0%) |
| 18 to 34 Years | 0 (0.0%) | 0 (0.0%) |
| 35 to 64 Years | 0 (0.0%) | 0 (0.0%) |
| 65 to 74 Years | 0 (0.0%) | 0 (0.0%) |
| 75 Years and over | 0 (0.0%) | 0 (0.0%) |
Disability Class: Cognitive Difficulty
| Age Bracket | Male | Female |
| 5 to 17 Years | 0 (0.0%) | 0 (0.0%) |
| 18 to 34 Years | 0 (0.0%) | 0 (0.0%) |
| 35 to 64 Years | 0 (0.0%) | 4 (14.3%) |
| 65 to 74 Years | 0 (0.0%) | 0 (0.0%) |
| 75 Years and over | 0 (0.0%) | 0 (0.0%) |
Disability Class: Ambulatory Difficulty
| Age Bracket | Male | Female |
| 5 to 17 Years | 0 (0.0%) | 0 (0.0%) |
| 18 to 34 Years | 0 (0.0%) | 0 (0.0%) |
| 35 to 64 Years | 0 (0.0%) | 0 (0.0%) |
| 65 to 74 Years | 0 (0.0%) | 0 (0.0%) |
| 75 Years and over | 1 (16.7%) | 0 (0.0%) |
Disability Class: Self-Care Difficulty
| Age Bracket | Male | Female |
| 5 to 17 Years | 0 (0.0%) | 0 (0.0%) |
| 18 to 34 Years | 0 (0.0%) | 0 (0.0%) |
| 35 to 64 Years | 0 (0.0%) | 0 (0.0%) |
| 65 to 74 Years | 0 (0.0%) | 0 (0.0%) |
| 75 Years and over | 0 (0.0%) | 0 (0.0%) |
Technology Access in Stone Lake
Computing Device Access in Stone Lake
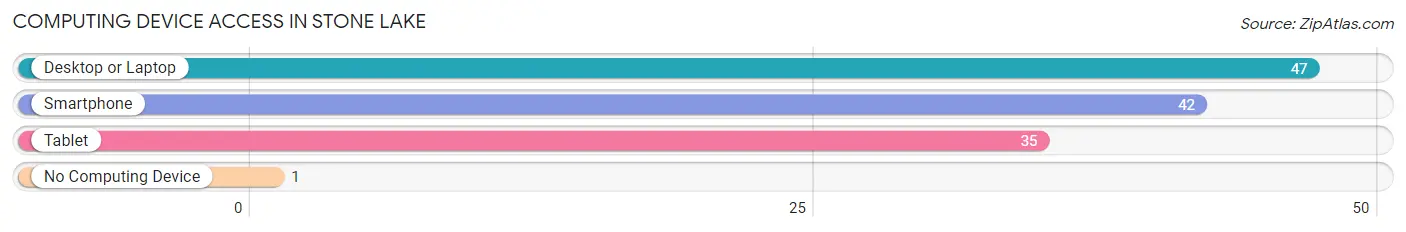
| Device Type | # Households | % Households |
| Desktop or Laptop | 47 | 97.9% |
| Smartphone | 42 | 87.5% |
| Tablet | 35 | 72.9% |
| No Computing Device | 1 | 2.1% |
| Total | 48 | 100.0% |
Internet Access in Stone Lake
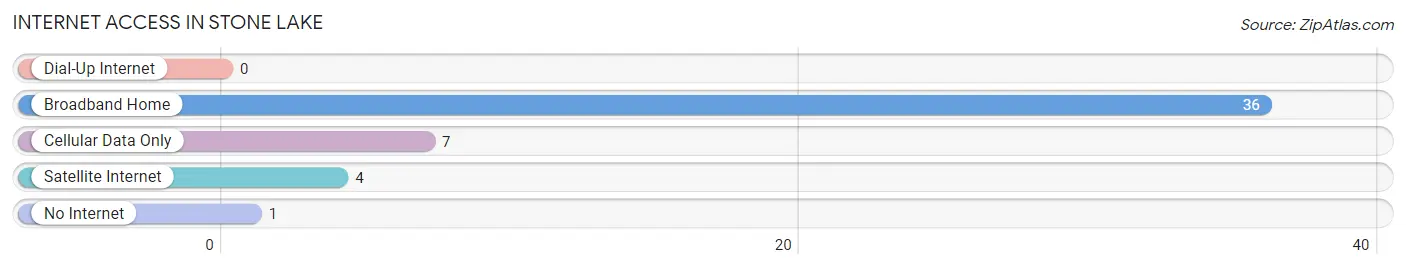
| Internet Type | # Households | % Households |
| Dial-Up Internet | 0 | 0.0% |
| Broadband Home | 36 | 75.0% |
| Cellular Data Only | 7 | 14.6% |
| Satellite Internet | 4 | 8.3% |
| No Internet | 1 | 2.1% |
| Total | 48 | 100.0% |
Stone Lake Summary
Lake Stone is a small village located in the northwest corner of Wisconsin, in the county of Washburn. It is situated on the shores of Stone Lake, a small lake that is part of the Chippewa River system. The village is surrounded by the Chequamegon National Forest and is home to a population of just over 500 people.
History
The area around Stone Lake has been inhabited by Native Americans for centuries. The Ojibwe, or Chippewa, were the first to settle in the area, and they used the lake for fishing and hunting. The first European settlers arrived in the area in the late 1800s, and the village of Stone Lake was officially established in 1891. The village was named after the lake, which was named after the large stones that were found in the lake.
The village grew slowly over the years, and by the early 1900s, it had become a popular destination for tourists and vacationers. The village was home to several resorts, and the lake was a popular spot for fishing and boating. In the 1950s, the village began to experience a decline in population as people moved away to larger cities. However, in recent years, the village has seen a resurgence in population as people have moved back to the area to enjoy the natural beauty and outdoor activities that the area has to offer.
Geography
Stone Lake is located in the northwest corner of Wisconsin, in the county of Washburn. It is situated on the shores of Stone Lake, a small lake that is part of the Chippewa River system. The village is surrounded by the Chequamegon National Forest and is home to a population of just over 500 people.
The village is located in a rural area, and the landscape is mostly wooded with rolling hills and valleys. The lake is the centerpiece of the village, and it is a popular spot for fishing, boating, and swimming. The village is also home to several parks and trails, including the Stone Lake Nature Trail, which is a popular spot for hiking and bird watching.
Economy
The economy of Stone Lake is largely based on tourism and outdoor recreation. The village is home to several resorts and lodges, which attract visitors from all over the region. The lake is a popular spot for fishing, boating, and swimming, and the surrounding forests are popular for hunting and camping. The village is also home to several small businesses, including restaurants, shops, and galleries.
Demographics
As of the 2010 census, the population of Stone Lake was 514 people. The racial makeup of the village was 97.3% White, 0.2% African American, 0.4% Native American, 0.4% Asian, 0.2% from other races, and 1.5% from two or more races. The median household income was $41,250, and the median family income was $50,000. The per capita income was $20,945.
Conclusion
Stone Lake is a small village located in the northwest corner of Wisconsin, in the county of Washburn. It is situated on the shores of Stone Lake, a small lake that is part of the Chippewa River system. The village is surrounded by the Chequamegon National Forest and is home to a population of just over 500 people. The economy of Stone Lake is largely based on tourism and outdoor recreation, and the village is home to several resorts and lodges. The population of Stone Lake is mostly White, with a small percentage of African American, Native American, and Asian residents. The median household income is $41,250, and the per capita income is $20,945.
Common Questions
What is Per Capita Income in Stone Lake?
Per Capita income in Stone Lake is $56,035.
What is the Median Family Income in Stone Lake?
Median Family Income in Stone Lake is $111,875.
What is Income or Wage Gap in Stone Lake?
Income or Wage Gap in Stone Lake is 37.6%.
Women in Stone Lake earn 62.4 cents for every dollar earned by a man.
What is Inequality or Gini Index in Stone Lake?
Inequality or Gini Index in Stone Lake is 0.44.
What is the Total Population of Stone Lake?
Total Population of Stone Lake is 83.
What is the Total Male Population of Stone Lake?
Total Male Population of Stone Lake is 33.
What is the Total Female Population of Stone Lake?
Total Female Population of Stone Lake is 50.
What is the Ratio of Males per 100 Females in Stone Lake?
There are 66.00 Males per 100 Females in Stone Lake.
What is the Ratio of Females per 100 Males in Stone Lake?
There are 151.52 Females per 100 Males in Stone Lake.
What is the Median Population Age in Stone Lake?
Median Population Age in Stone Lake is 61.3 Years.
What is the Average Family Size in Stone Lake
Average Family Size in Stone Lake is 2.0 People.
What is the Average Household Size in Stone Lake
Average Household Size in Stone Lake is 1.7 People.
How Large is the Labor Force in Stone Lake?
There are 42 People in the Labor Forcein in Stone Lake.
What is the Percentage of People in the Labor Force in Stone Lake?
50.6% of People are in the Labor Force in Stone Lake.