Denmark, WI Map & Demographics
Denmark Map
Denmark Overview
$32,928
PER CAPITA INCOME
$94,150
AVG FAMILY INCOME
$71,750
AVG HOUSEHOLD INCOME
22.5%
WAGE / INCOME GAP [ % ]
77.5¢/ $1
WAGE / INCOME GAP [ $ ]
0.45
INEQUALITY / GINI INDEX
2,400
TOTAL POPULATION
1,261
MALE POPULATION
1,139
FEMALE POPULATION
110.71
MALES / 100 FEMALES
90.33
FEMALES / 100 MALES
34.6
MEDIAN AGE
3.5
AVG FAMILY SIZE
2.7
AVG HOUSEHOLD SIZE
1,402
LABOR FORCE [ PEOPLE ]
75.2%
PERCENT IN LABOR FORCE
1.7%
UNEMPLOYMENT RATE
Denmark Zip Codes
Denmark Area Codes
Income in Denmark
Income Overview in Denmark
Per Capita Income in Denmark is $32,928, while median incomes of families and households are $94,150 and $71,750 respectively.
| Characteristic | Number | Measure |
| Per Capita Income | 2,400 | $32,928 |
| Median Family Income | 567 | $94,150 |
| Mean Family Income | 567 | $111,090 |
| Median Household Income | 901 | $71,750 |
| Mean Household Income | 901 | $85,926 |
| Income Deficit | 567 | $0 |
| Wage / Income Gap (%) | 2,400 | 22.53% |
| Wage / Income Gap ($) | 2,400 | 77.47¢ per $1 |
| Gini / Inequality Index | 2,400 | 0.45 |
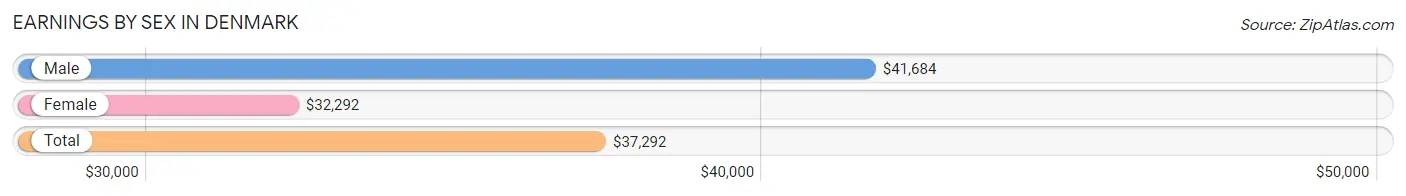
Earnings by Sex in Denmark
Average Earnings in Denmark are $37,292, $41,684 for men and $32,292 for women, a difference of 22.5%.
| Sex | Number | Average Earnings |
| Male | 774 (53.9%) | $41,684 |
| Female | 661 (46.1%) | $32,292 |
| Total | 1,435 (100.0%) | $37,292 |
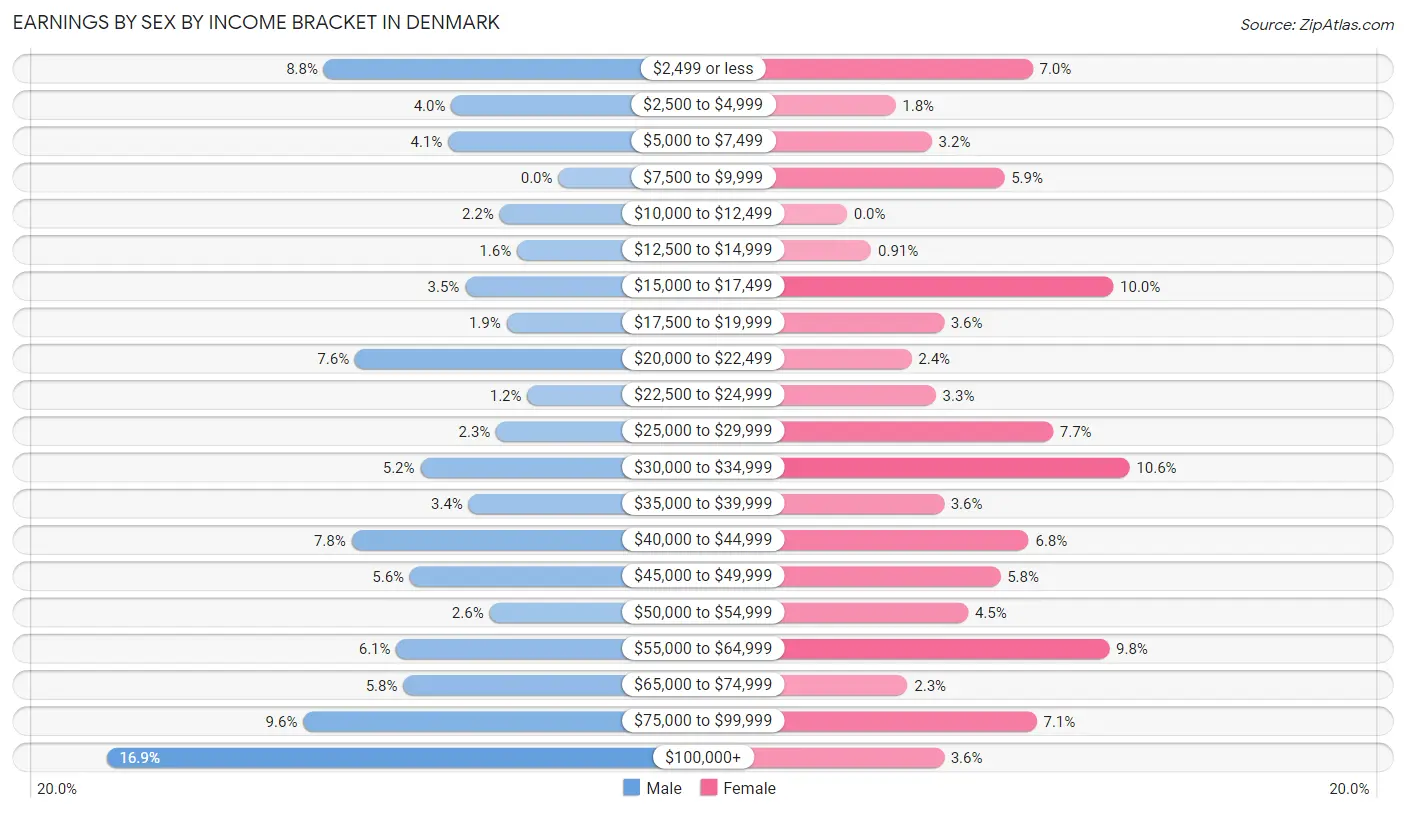
Earnings by Sex by Income Bracket in Denmark
The most common earnings brackets in Denmark are $100,000+ for men (131 | 16.9%) and $30,000 to $34,999 for women (70 | 10.6%).
| Income | Male | Female |
| $2,499 or less | 68 (8.8%) | 46 (7.0%) |
| $2,500 to $4,999 | 31 (4.0%) | 12 (1.8%) |
| $5,000 to $7,499 | 32 (4.1%) | 21 (3.2%) |
| $7,500 to $9,999 | 0 (0.0%) | 39 (5.9%) |
| $10,000 to $12,499 | 17 (2.2%) | 0 (0.0%) |
| $12,500 to $14,999 | 12 (1.5%) | 6 (0.9%) |
| $15,000 to $17,499 | 27 (3.5%) | 66 (10.0%) |
| $17,500 to $19,999 | 15 (1.9%) | 24 (3.6%) |
| $20,000 to $22,499 | 59 (7.6%) | 16 (2.4%) |
| $22,500 to $24,999 | 9 (1.2%) | 22 (3.3%) |
| $25,000 to $29,999 | 18 (2.3%) | 51 (7.7%) |
| $30,000 to $34,999 | 40 (5.2%) | 70 (10.6%) |
| $35,000 to $39,999 | 26 (3.4%) | 24 (3.6%) |
| $40,000 to $44,999 | 60 (7.7%) | 45 (6.8%) |
| $45,000 to $49,999 | 43 (5.6%) | 38 (5.8%) |
| $50,000 to $54,999 | 20 (2.6%) | 30 (4.5%) |
| $55,000 to $64,999 | 47 (6.1%) | 65 (9.8%) |
| $65,000 to $74,999 | 45 (5.8%) | 15 (2.3%) |
| $75,000 to $99,999 | 74 (9.6%) | 47 (7.1%) |
| $100,000+ | 131 (16.9%) | 24 (3.6%) |
| Total | 774 (100.0%) | 661 (100.0%) |
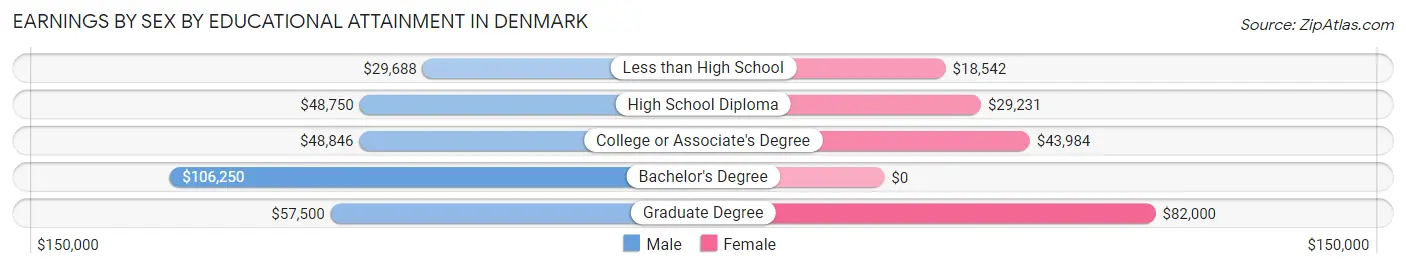
Earnings by Sex by Educational Attainment in Denmark
Average earnings in Denmark are $56,118 for men and $38,073 for women, a difference of 32.2%. Men with an educational attainment of bachelor's degree enjoy the highest average annual earnings of $106,250, while those with less than high school education earn the least with $29,688. Women with an educational attainment of graduate degree earn the most with the average annual earnings of $82,000, while those with less than high school education have the smallest earnings of $18,542.
| Educational Attainment | Male Income | Female Income |
| Less than High School | $29,688 | $18,542 |
| High School Diploma | $48,750 | $29,231 |
| College or Associate's Degree | $48,846 | $43,984 |
| Bachelor's Degree | $106,250 | $0 |
| Graduate Degree | $57,500 | $82,000 |
| Total | $56,118 | $38,073 |
Family Income in Denmark
Family Income Brackets in Denmark
According to the Denmark family income data, there are 132 families falling into the $100,000 to $149,999 income range, which is the most common income bracket and makes up 23.3% of all families. Conversely, the $10,000 to $14,999 income bracket is the least frequent group with only 6 families (1.1%) belonging to this category.
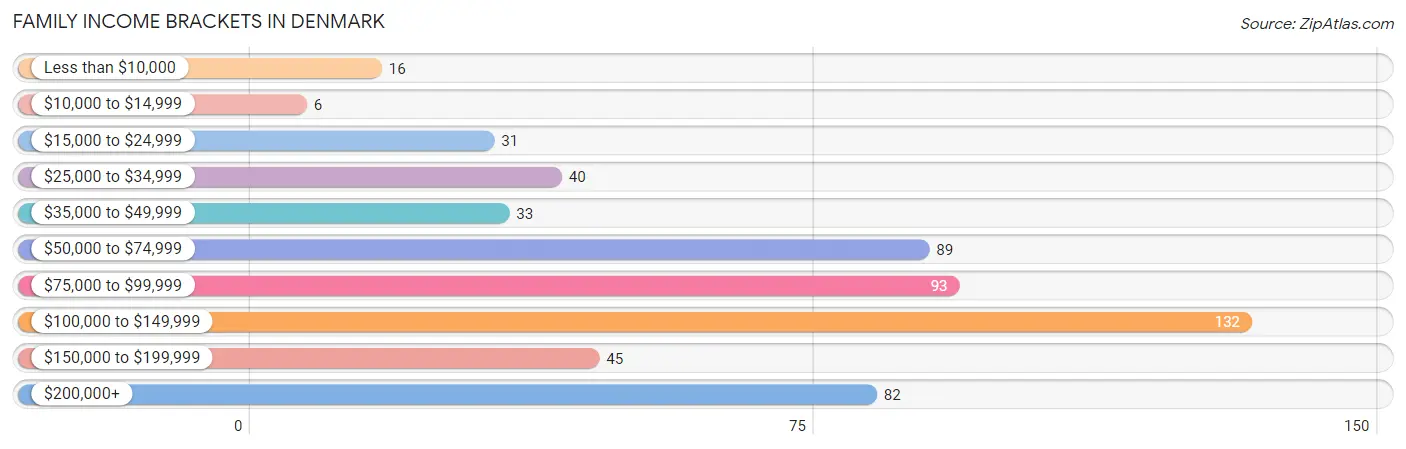
| Income Bracket | # Families | % Families |
| Less than $10,000 | 16 | 2.8% |
| $10,000 to $14,999 | 6 | 1.1% |
| $15,000 to $24,999 | 31 | 5.5% |
| $25,000 to $34,999 | 40 | 7.1% |
| $35,000 to $49,999 | 33 | 5.8% |
| $50,000 to $74,999 | 89 | 15.7% |
| $75,000 to $99,999 | 93 | 16.4% |
| $100,000 to $149,999 | 132 | 23.3% |
| $150,000 to $199,999 | 45 | 7.9% |
| $200,000+ | 82 | 14.5% |
Family Income by Famaliy Size in Denmark
5-person families (70 | 12.3%) account for the highest median family income in Denmark with $213,284 per family, while 5-person families (70 | 12.3%) have the highest median income of $42,657 per family member.
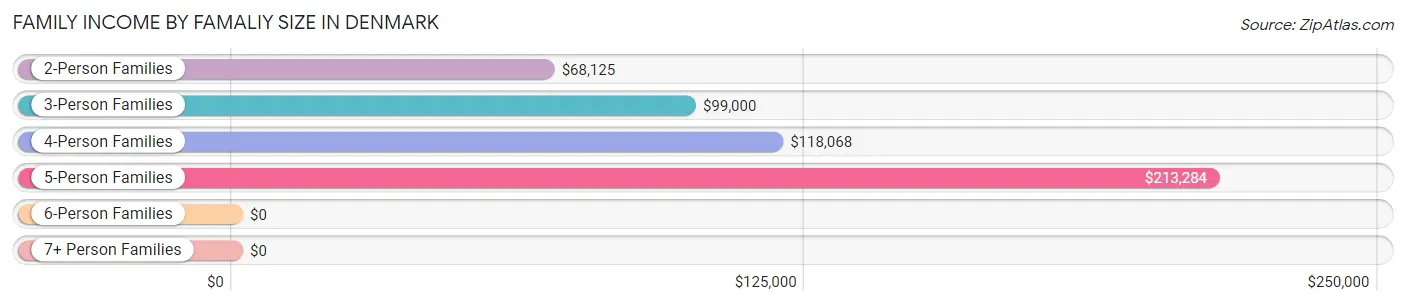
| Income Bracket | # Families | Median Income |
| 2-Person Families | 196 (34.6%) | $68,125 |
| 3-Person Families | 118 (20.8%) | $99,000 |
| 4-Person Families | 156 (27.5%) | $118,068 |
| 5-Person Families | 70 (12.3%) | $213,284 |
| 6-Person Families | 0 (0.0%) | $0 |
| 7+ Person Families | 27 (4.8%) | $0 |
| Total | 567 (100.0%) | $94,150 |
Family Income by Number of Earners in Denmark
The median family income in Denmark is $94,150, with families comprising 3+ earners (115) having the highest median family income of $212,623, while families with no earners (72) have the lowest median family income of $30,625, accounting for 20.3% and 12.7% of families, respectively.
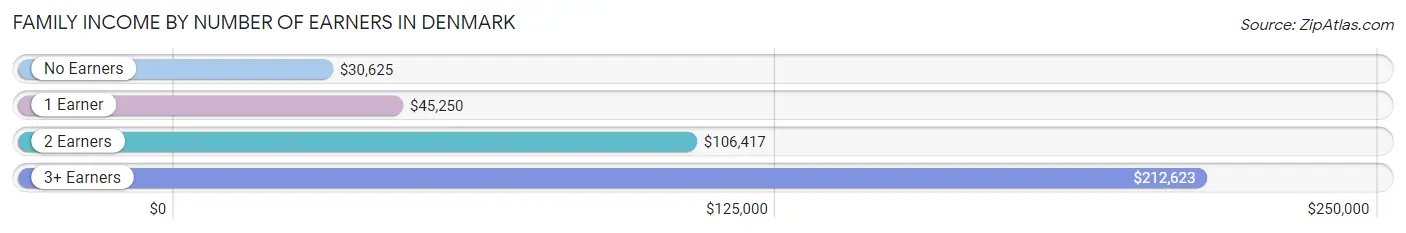
| Number of Earners | # Families | Median Income |
| No Earners | 72 (12.7%) | $30,625 |
| 1 Earner | 91 (16.1%) | $45,250 |
| 2 Earners | 289 (51.0%) | $106,417 |
| 3+ Earners | 115 (20.3%) | $212,623 |
| Total | 567 (100.0%) | $94,150 |
Household Income in Denmark
Household Income Brackets in Denmark
With 164 households falling in the category, the $100,000 to $149,999 income range is the most frequent in Denmark, accounting for 18.2% of all households. In contrast, only 43 households (4.8%) fall into the $10,000 to $14,999 income bracket, making it the least populous group.
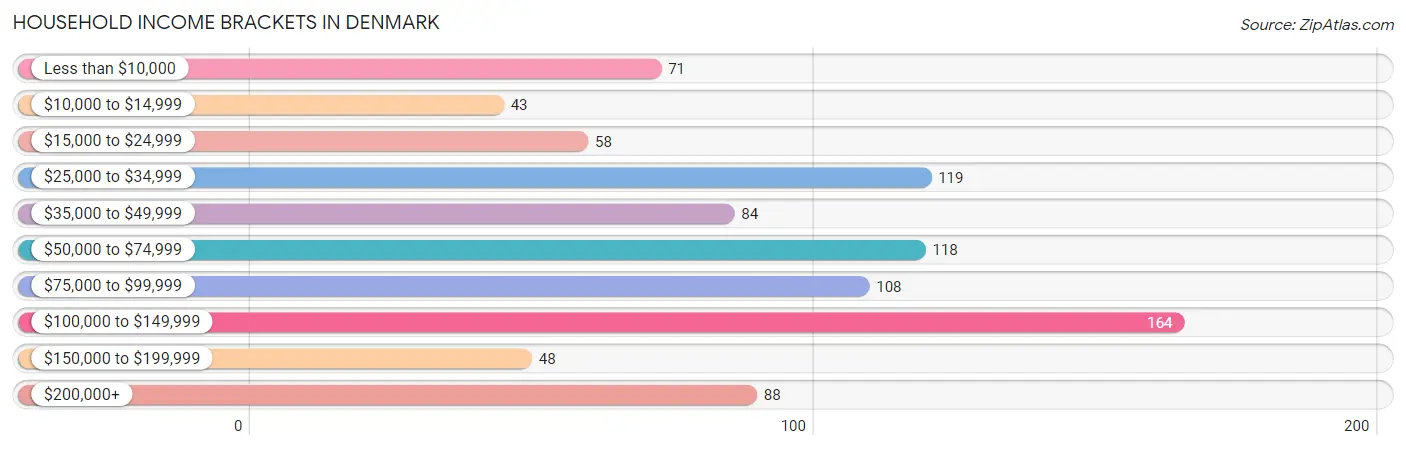
| Income Bracket | # Households | % Households |
| Less than $10,000 | 71 | 7.9% |
| $10,000 to $14,999 | 43 | 4.8% |
| $15,000 to $24,999 | 58 | 6.4% |
| $25,000 to $34,999 | 119 | 13.2% |
| $35,000 to $49,999 | 84 | 9.3% |
| $50,000 to $74,999 | 118 | 13.1% |
| $75,000 to $99,999 | 108 | 12.0% |
| $100,000 to $149,999 | 164 | 18.2% |
| $150,000 to $199,999 | 48 | 5.3% |
| $200,000+ | 88 | 9.8% |
Household Income by Householder Age in Denmark
The median household income in Denmark is $71,750, with the highest median household income of $96,719 found in the 45 to 64 years age bracket for the primary householder. A total of 361 households (40.1%) fall into this category. Meanwhile, the 15 to 24 years age bracket for the primary householder has the lowest median household income of $0, with 5 households (0.5%) in this group.
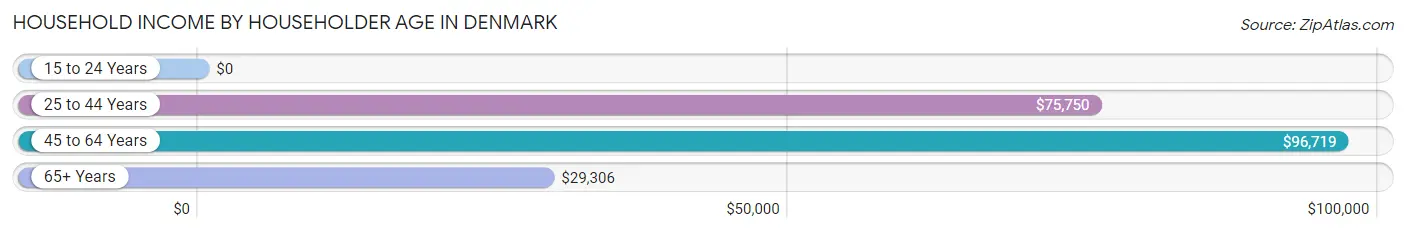
| Income Bracket | # Households | Median Income |
| 15 to 24 Years | 5 (0.5%) | $0 |
| 25 to 44 Years | 303 (33.6%) | $75,750 |
| 45 to 64 Years | 361 (40.1%) | $96,719 |
| 65+ Years | 232 (25.8%) | $29,306 |
| Total | 901 (100.0%) | $71,750 |
Poverty in Denmark
Income Below Poverty by Sex and Age in Denmark
With 10.5% poverty level for males and 15.7% for females among the residents of Denmark, under 5 year old males and 12 to 14 year old females are the most vulnerable to poverty, with 32 males (32.0%) and 11 females (33.3%) in their respective age groups living below the poverty level.
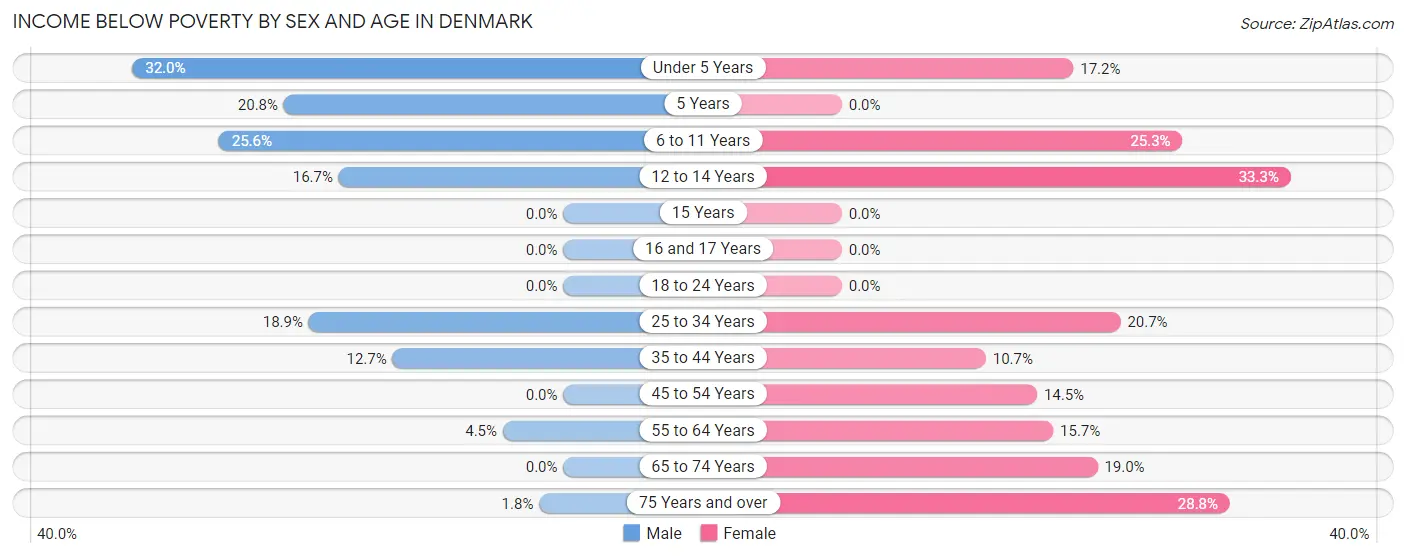
| Age Bracket | Male | Female |
| Under 5 Years | 32 (32.0%) | 11 (17.2%) |
| 5 Years | 11 (20.7%) | 0 (0.0%) |
| 6 to 11 Years | 22 (25.6%) | 22 (25.3%) |
| 12 to 14 Years | 14 (16.7%) | 11 (33.3%) |
| 15 Years | 0 (0.0%) | 0 (0.0%) |
| 16 and 17 Years | 0 (0.0%) | 0 (0.0%) |
| 18 to 24 Years | 0 (0.0%) | 0 (0.0%) |
| 25 to 34 Years | 31 (18.9%) | 30 (20.7%) |
| 35 to 44 Years | 18 (12.7%) | 14 (10.7%) |
| 45 to 54 Years | 0 (0.0%) | 30 (14.5%) |
| 55 to 64 Years | 4 (4.5%) | 16 (15.7%) |
| 65 to 74 Years | 0 (0.0%) | 26 (19.0%) |
| 75 Years and over | 1 (1.8%) | 17 (28.8%) |
| Total | 133 (10.5%) | 177 (15.7%) |
Income Above Poverty by Sex and Age in Denmark
According to the poverty statistics in Denmark, males aged 15 years and females aged 5 years are the age groups that are most secure financially, with 100.0% of males and 100.0% of females in these age groups living above the poverty line.
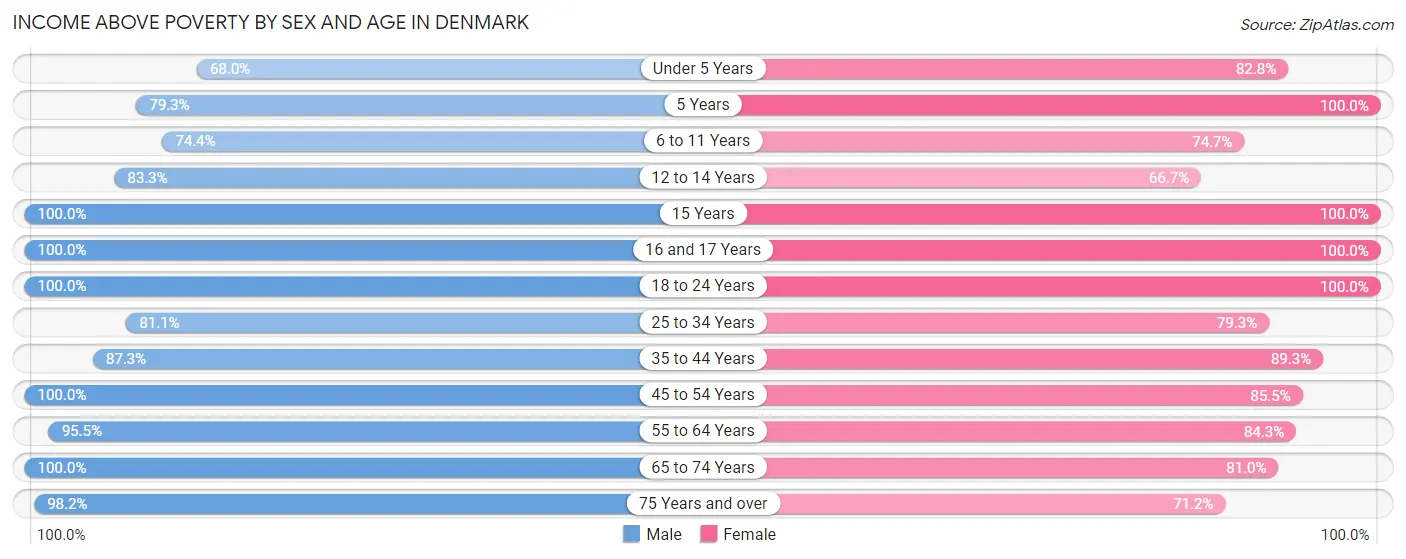
| Age Bracket | Male | Female |
| Under 5 Years | 68 (68.0%) | 53 (82.8%) |
| 5 Years | 42 (79.2%) | 6 (100.0%) |
| 6 to 11 Years | 64 (74.4%) | 65 (74.7%) |
| 12 to 14 Years | 70 (83.3%) | 22 (66.7%) |
| 15 Years | 5 (100.0%) | 12 (100.0%) |
| 16 and 17 Years | 76 (100.0%) | 29 (100.0%) |
| 18 to 24 Years | 154 (100.0%) | 116 (100.0%) |
| 25 to 34 Years | 133 (81.1%) | 115 (79.3%) |
| 35 to 44 Years | 124 (87.3%) | 117 (89.3%) |
| 45 to 54 Years | 176 (100.0%) | 177 (85.5%) |
| 55 to 64 Years | 85 (95.5%) | 86 (84.3%) |
| 65 to 74 Years | 76 (100.0%) | 111 (81.0%) |
| 75 Years and over | 55 (98.2%) | 42 (71.2%) |
| Total | 1,128 (89.4%) | 951 (84.3%) |
Income Below Poverty Among Married-Couple Families in Denmark
The poverty statistics for married-couple families in Denmark show that 3.8% or 17 of the total 449 families live below the poverty line. Families with 5 or more children have the highest poverty rate of 57.1%, comprising of 12 families. On the other hand, families with 3 or 4 children have the lowest poverty rate of 0.0%, which includes 0 families.
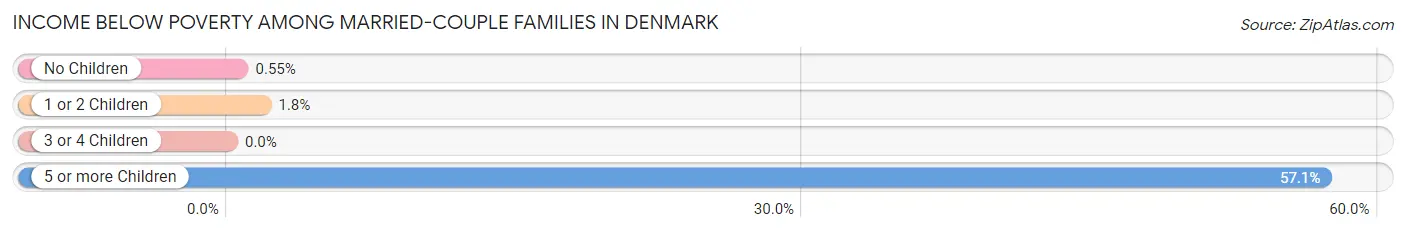
| Children | Above Poverty | Below Poverty |
| No Children | 180 (99.5%) | 1 (0.5%) |
| 1 or 2 Children | 224 (98.3%) | 4 (1.8%) |
| 3 or 4 Children | 19 (100.0%) | 0 (0.0%) |
| 5 or more Children | 9 (42.9%) | 12 (57.1%) |
| Total | 432 (96.2%) | 17 (3.8%) |
Income Below Poverty Among Single-Parent Households in Denmark
According to the poverty data in Denmark, 11.1% or 6 single-father households and 45.3% or 29 single-mother households are living below the poverty line. Among single-father households, those with no children have the highest poverty rate, with 6 households (16.7%) experiencing poverty. Likewise, among single-mother households, those with 3 or 4 children have the highest poverty rate, with 15 households (100.0%) falling below the poverty line.
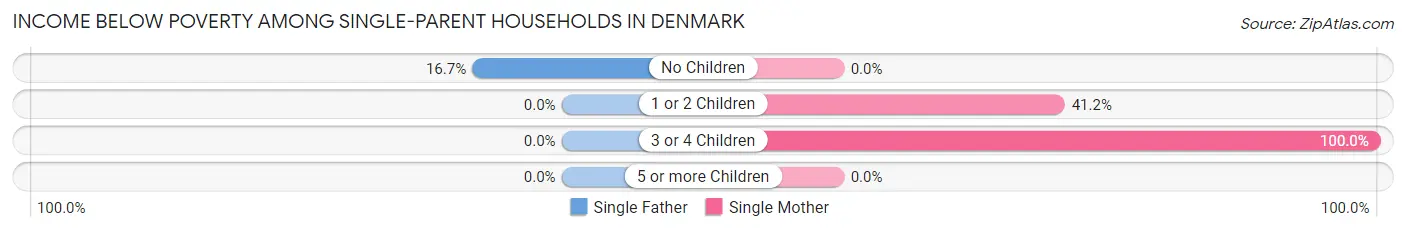
| Children | Single Father | Single Mother |
| No Children | 6 (16.7%) | 0 (0.0%) |
| 1 or 2 Children | 0 (0.0%) | 14 (41.2%) |
| 3 or 4 Children | 0 (0.0%) | 15 (100.0%) |
| 5 or more Children | 0 (0.0%) | 0 (0.0%) |
| Total | 6 (11.1%) | 29 (45.3%) |
Income Below Poverty Among Married-Couple vs Single-Parent Households in Denmark
The poverty data for Denmark shows that 17 of the married-couple family households (3.8%) and 35 of the single-parent households (29.7%) are living below the poverty level. Within the married-couple family households, those with 5 or more children have the highest poverty rate, with 12 households (57.1%) falling below the poverty line. Among the single-parent households, those with 3 or 4 children have the highest poverty rate, with 15 household (68.2%) living below poverty.
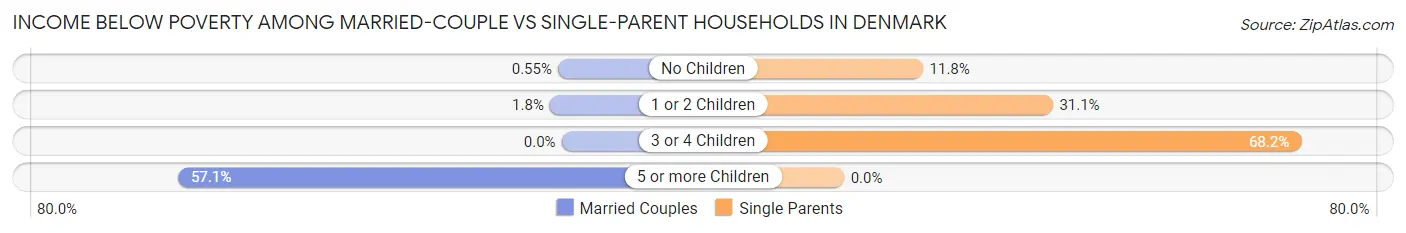
| Children | Married-Couple Families | Single-Parent Households |
| No Children | 1 (0.5%) | 6 (11.8%) |
| 1 or 2 Children | 4 (1.8%) | 14 (31.1%) |
| 3 or 4 Children | 0 (0.0%) | 15 (68.2%) |
| 5 or more Children | 12 (57.1%) | 0 (0.0%) |
| Total | 17 (3.8%) | 35 (29.7%) |
Race in Denmark
The most populous races in Denmark are White / Caucasian (2,192 | 91.3%), Two or more Races (142 | 5.9%), and Hispanic or Latino (58 | 2.4%).
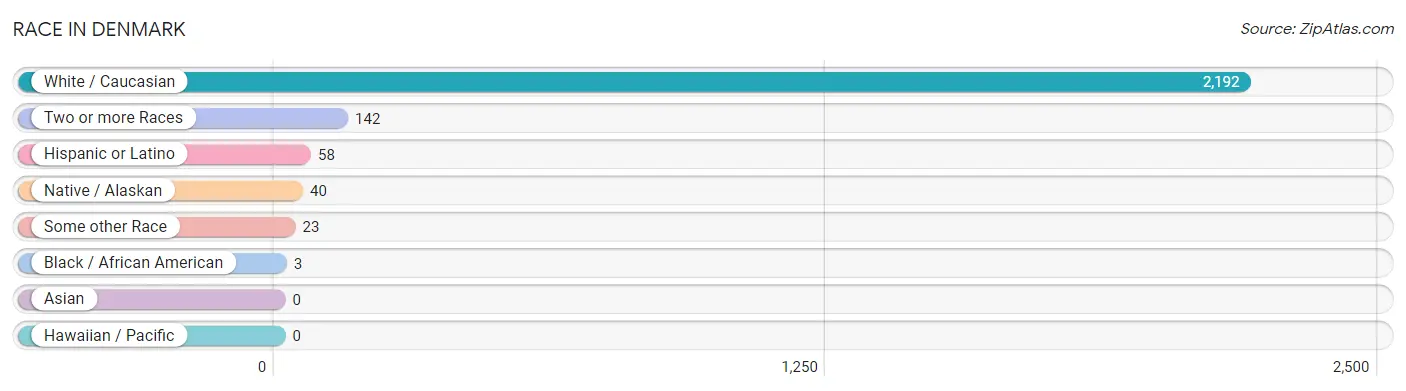
| Race | # Population | % Population |
| Asian | 0 | 0.0% |
| Black / African American | 3 | 0.1% |
| Hawaiian / Pacific | 0 | 0.0% |
| Hispanic or Latino | 58 | 2.4% |
| Native / Alaskan | 40 | 1.7% |
| White / Caucasian | 2,192 | 91.3% |
| Two or more Races | 142 | 5.9% |
| Some other Race | 23 | 1.0% |
| Total | 2,400 | 100.0% |
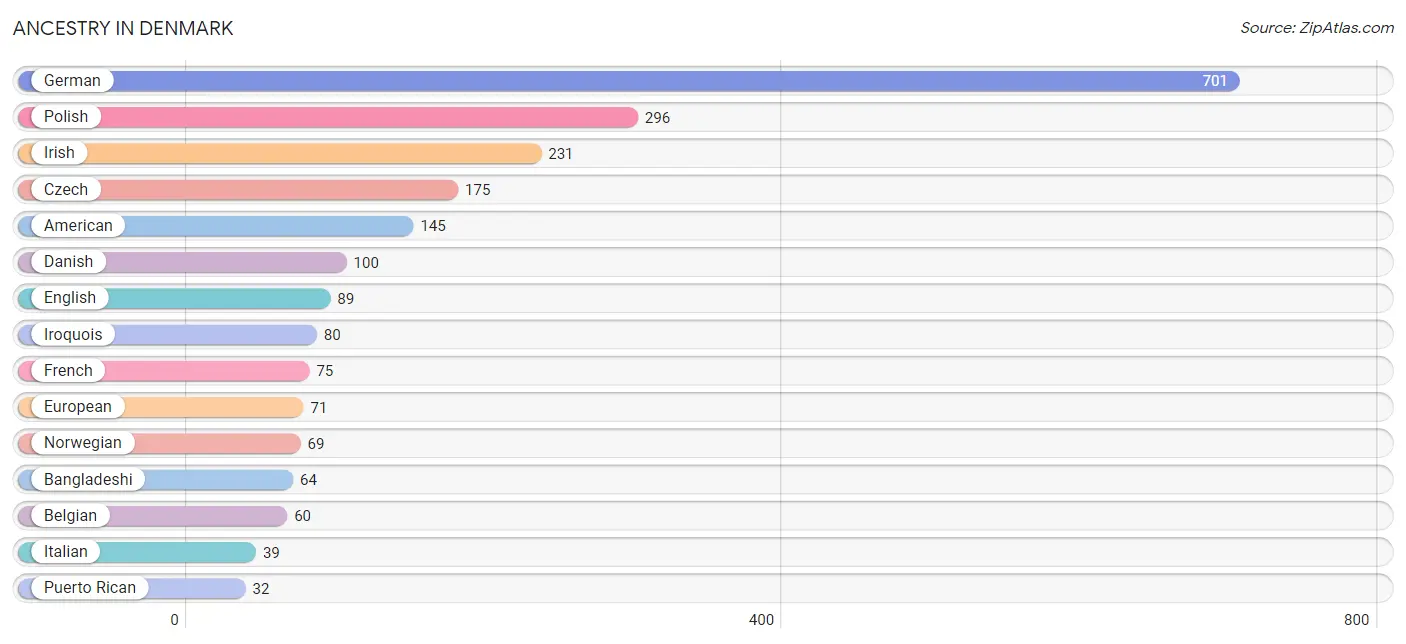
Ancestry in Denmark
The most populous ancestries reported in Denmark are German (701 | 29.2%), Polish (296 | 12.3%), Irish (231 | 9.6%), Czech (175 | 7.3%), and American (145 | 6.0%), together accounting for 64.5% of all Denmark residents.
| Ancestry | # Population | % Population |
| American | 145 | 6.0% |
| Austrian | 10 | 0.4% |
| Bangladeshi | 64 | 2.7% |
| Belgian | 60 | 2.5% |
| Burmese | 9 | 0.4% |
| Chippewa | 4 | 0.2% |
| Czech | 175 | 7.3% |
| Czechoslovakian | 16 | 0.7% |
| Danish | 100 | 4.2% |
| Dutch | 8 | 0.3% |
| Eastern European | 5 | 0.2% |
| English | 89 | 3.7% |
| European | 71 | 3.0% |
| Finnish | 27 | 1.1% |
| French | 75 | 3.1% |
| French Canadian | 21 | 0.9% |
| German | 701 | 29.2% |
| German Russian | 8 | 0.3% |
| Greek | 5 | 0.2% |
| Irish | 231 | 9.6% |
| Iroquois | 80 | 3.3% |
| Italian | 39 | 1.6% |
| Lumbee | 9 | 0.4% |
| Mexican | 26 | 1.1% |
| Norwegian | 69 | 2.9% |
| Polish | 296 | 12.3% |
| Puerto Rican | 32 | 1.3% |
| Russian | 16 | 0.7% |
| Scandinavian | 10 | 0.4% |
| Scotch-Irish | 30 | 1.3% |
| Scottish | 20 | 0.8% |
| Slovak | 5 | 0.2% |
| Swedish | 13 | 0.5% |
| Swiss | 2 | 0.1% |
| Ukrainian | 5 | 0.2% | View All 35 Rows |
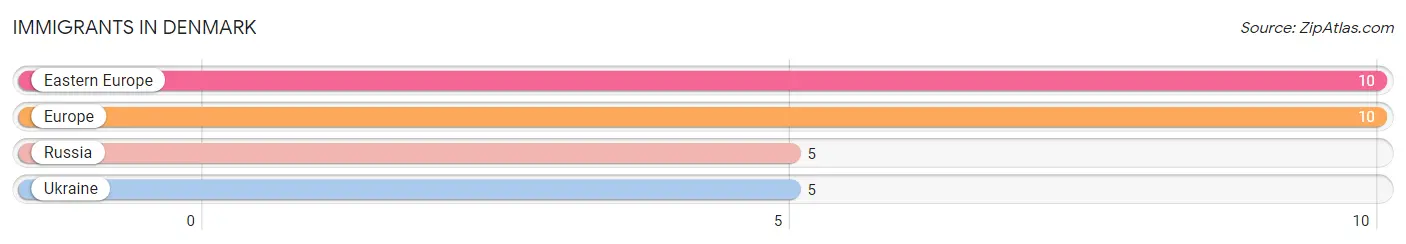
Immigrants in Denmark
The most numerous immigrant groups reported in Denmark came from Eastern Europe (10 | 0.4%), Europe (10 | 0.4%), Russia (5 | 0.2%), and Ukraine (5 | 0.2%), together accounting for 1.3% of all Denmark residents.
| Immigration Origin | # Population | % Population |
| Eastern Europe | 10 | 0.4% |
| Europe | 10 | 0.4% |
| Russia | 5 | 0.2% |
| Ukraine | 5 | 0.2% | View All 4 Rows |
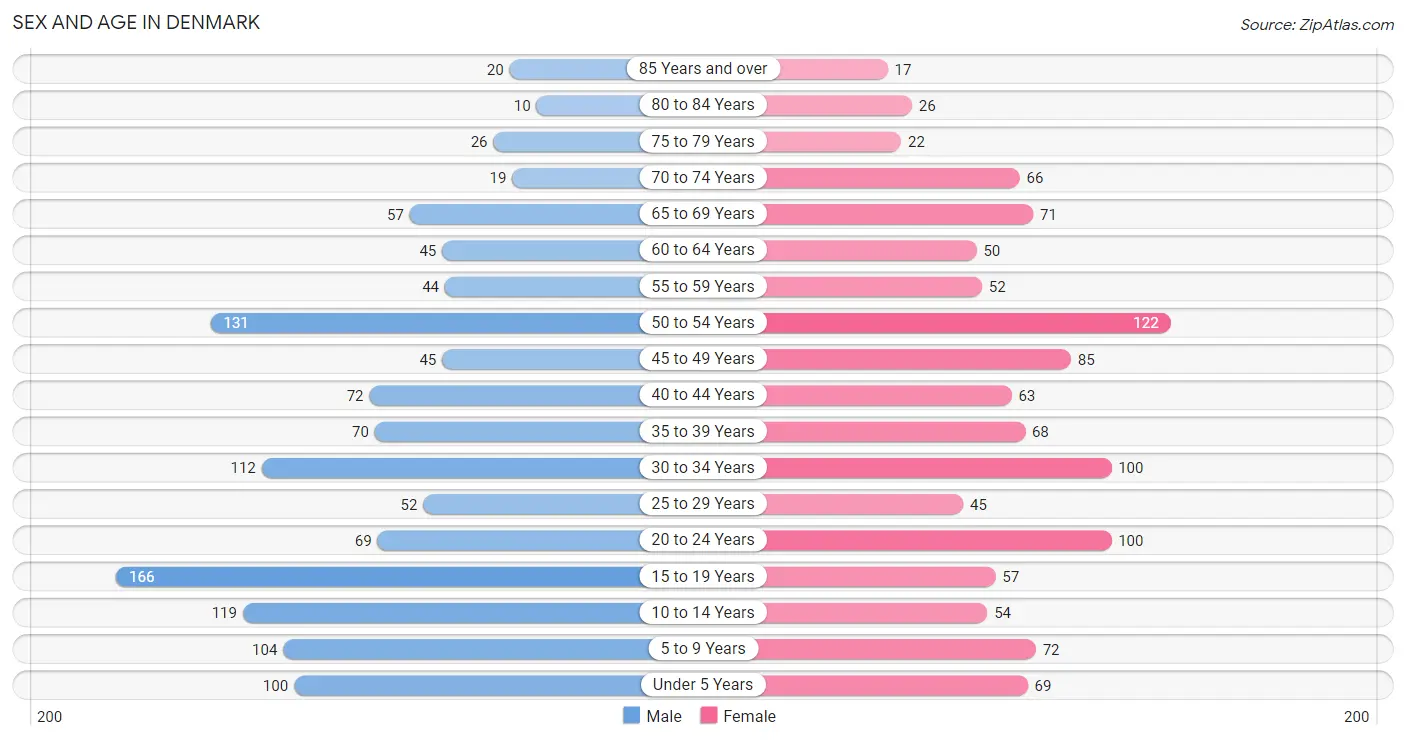
Sex and Age in Denmark
Sex and Age in Denmark
The most populous age groups in Denmark are 15 to 19 Years (166 | 13.2%) for men and 50 to 54 Years (122 | 10.7%) for women.
| Age Bracket | Male | Female |
| Under 5 Years | 100 (7.9%) | 69 (6.1%) |
| 5 to 9 Years | 104 (8.3%) | 72 (6.3%) |
| 10 to 14 Years | 119 (9.4%) | 54 (4.7%) |
| 15 to 19 Years | 166 (13.2%) | 57 (5.0%) |
| 20 to 24 Years | 69 (5.5%) | 100 (8.8%) |
| 25 to 29 Years | 52 (4.1%) | 45 (4.0%) |
| 30 to 34 Years | 112 (8.9%) | 100 (8.8%) |
| 35 to 39 Years | 70 (5.6%) | 68 (6.0%) |
| 40 to 44 Years | 72 (5.7%) | 63 (5.5%) |
| 45 to 49 Years | 45 (3.6%) | 85 (7.5%) |
| 50 to 54 Years | 131 (10.4%) | 122 (10.7%) |
| 55 to 59 Years | 44 (3.5%) | 52 (4.6%) |
| 60 to 64 Years | 45 (3.6%) | 50 (4.4%) |
| 65 to 69 Years | 57 (4.5%) | 71 (6.2%) |
| 70 to 74 Years | 19 (1.5%) | 66 (5.8%) |
| 75 to 79 Years | 26 (2.1%) | 22 (1.9%) |
| 80 to 84 Years | 10 (0.8%) | 26 (2.3%) |
| 85 Years and over | 20 (1.6%) | 17 (1.5%) |
| Total | 1,261 (100.0%) | 1,139 (100.0%) |
Families and Households in Denmark
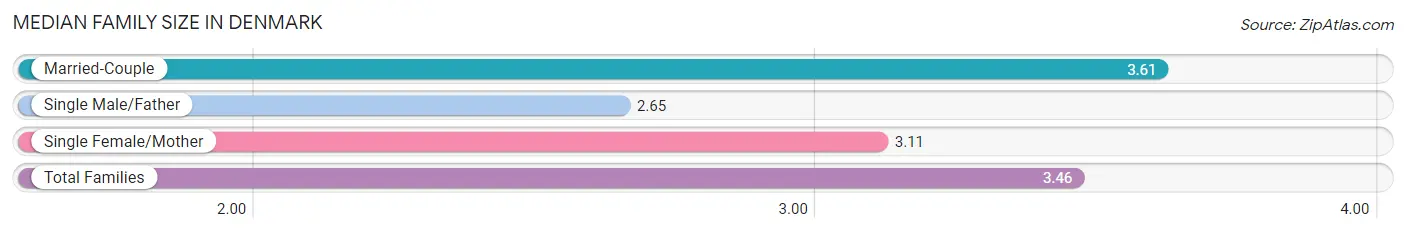
Median Family Size in Denmark
The median family size in Denmark is 3.46 persons per family, with married-couple families (449 | 79.2%) accounting for the largest median family size of 3.61 persons per family. On the other hand, single male/father families (54 | 9.5%) represent the smallest median family size with 2.65 persons per family.
| Family Type | # Families | Family Size |
| Married-Couple | 449 (79.2%) | 3.61 |
| Single Male/Father | 54 (9.5%) | 2.65 |
| Single Female/Mother | 64 (11.3%) | 3.11 |
| Total Families | 567 (100.0%) | 3.46 |
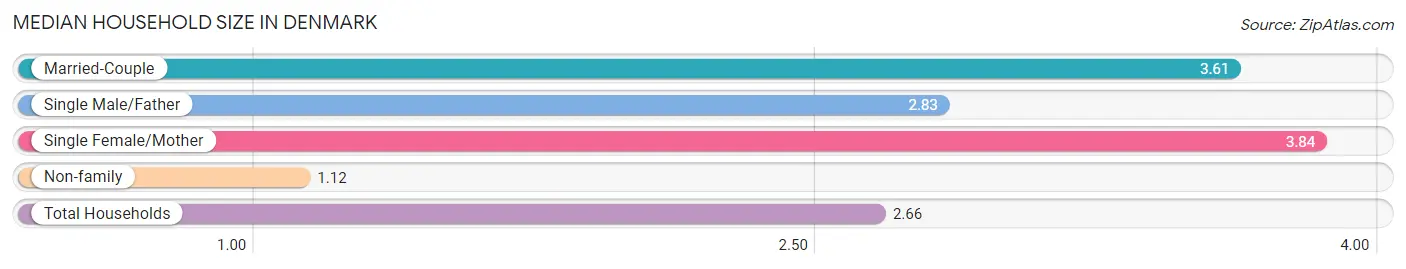
Median Household Size in Denmark
The median household size in Denmark is 2.66 persons per household, with single female/mother households (64 | 7.1%) accounting for the largest median household size of 3.84 persons per household. non-family households (334 | 37.1%) represent the smallest median household size with 1.12 persons per household.
| Household Type | # Households | Household Size |
| Married-Couple | 449 (49.8%) | 3.61 |
| Single Male/Father | 54 (6.0%) | 2.83 |
| Single Female/Mother | 64 (7.1%) | 3.84 |
| Non-family | 334 (37.1%) | 1.12 |
| Total Households | 901 (100.0%) | 2.66 |
Household Size by Marriage Status in Denmark
Out of a total of 901 households in Denmark, 567 (62.9%) are family households, while 334 (37.1%) are nonfamily households. The most numerous type of family households are 2-person households, comprising 177, and the most common type of nonfamily households are 1-person households, comprising 293.
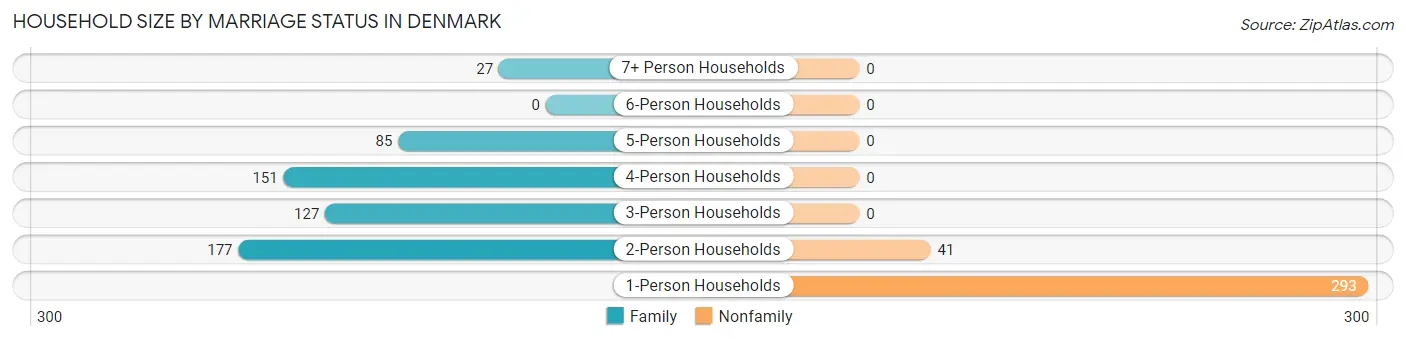
| Household Size | Family Households | Nonfamily Households |
| 1-Person Households | - | 293 (32.5%) |
| 2-Person Households | 177 (19.6%) | 41 (4.5%) |
| 3-Person Households | 127 (14.1%) | 0 (0.0%) |
| 4-Person Households | 151 (16.8%) | 0 (0.0%) |
| 5-Person Households | 85 (9.4%) | 0 (0.0%) |
| 6-Person Households | 0 (0.0%) | 0 (0.0%) |
| 7+ Person Households | 27 (3.0%) | 0 (0.0%) |
| Total | 567 (62.9%) | 334 (37.1%) |
Female Fertility in Denmark
Fertility by Age in Denmark
Average fertility rate in Denmark is 36.0 births per 1,000 women. Women in the age bracket of 20 to 34 years have the highest fertility rate with 57.0 births per 1,000 women. Women in the age bracket of 20 to 34 years acount for 73.7% of all women with births.
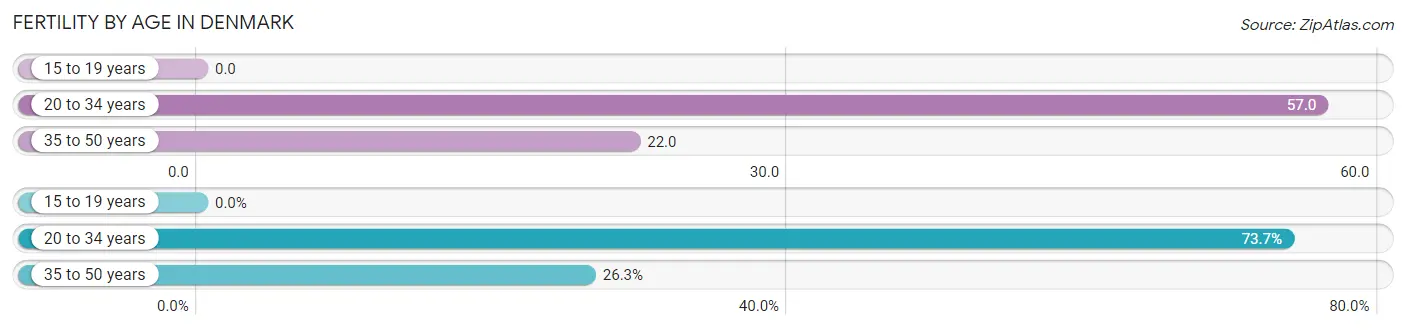
| Age Bracket | Women with Births | Births / 1,000 Women |
| 15 to 19 years | 0 (0.0%) | 0.0 |
| 20 to 34 years | 14 (73.7%) | 57.0 |
| 35 to 50 years | 5 (26.3%) | 22.0 |
| Total | 19 (100.0%) | 36.0 |
Fertility by Age by Marriage Status in Denmark
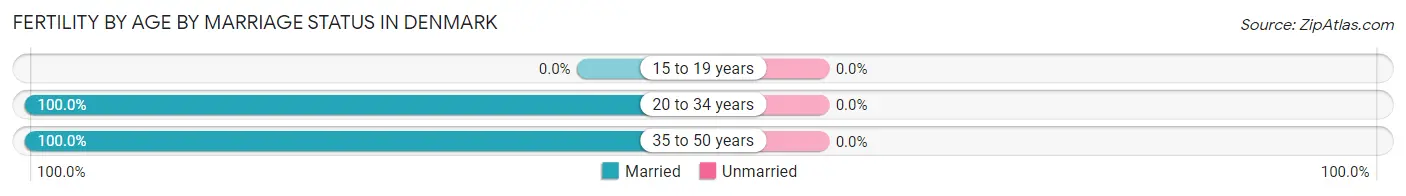
| Age Bracket | Married | Unmarried |
| 15 to 19 years | 0 (0.0%) | 0 (0.0%) |
| 20 to 34 years | 14 (100.0%) | 0 (0.0%) |
| 35 to 50 years | 5 (100.0%) | 0 (0.0%) |
| Total | 19 (100.0%) | 0 (0.0%) |
Fertility by Education in Denmark
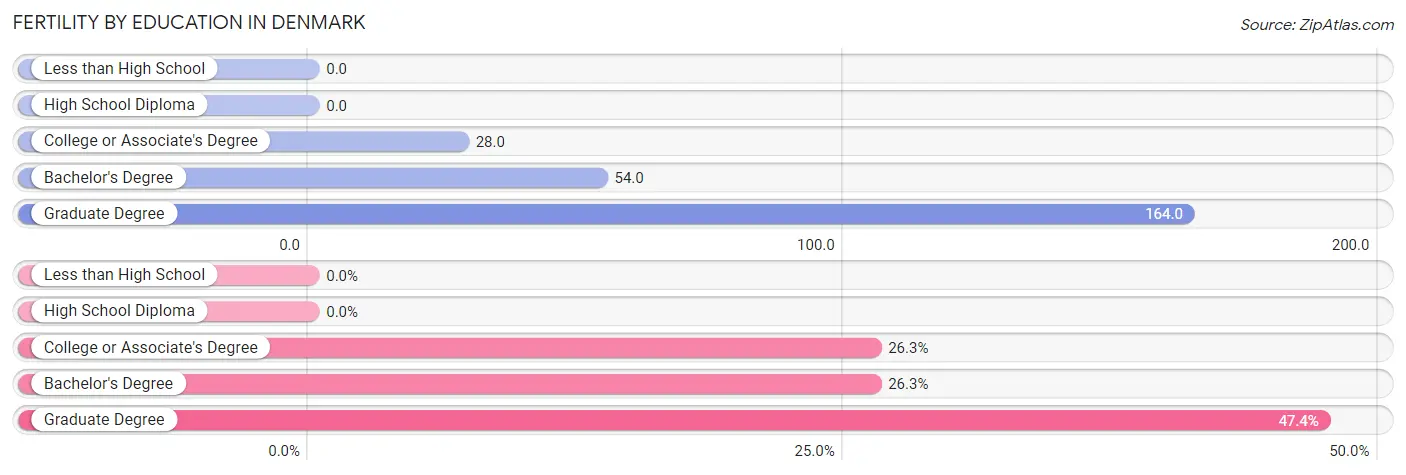
| Educational Attainment | Women with Births | Births / 1,000 Women |
| Less than High School | 0 (0.0%) | 0.0 |
| High School Diploma | 0 (0.0%) | 0.0 |
| College or Associate's Degree | 5 (26.3%) | 28.0 |
| Bachelor's Degree | 5 (26.3%) | 54.0 |
| Graduate Degree | 9 (47.4%) | 164.0 |
| Total | 19 (100.0%) | 36.0 |
Fertility by Education by Marriage Status in Denmark
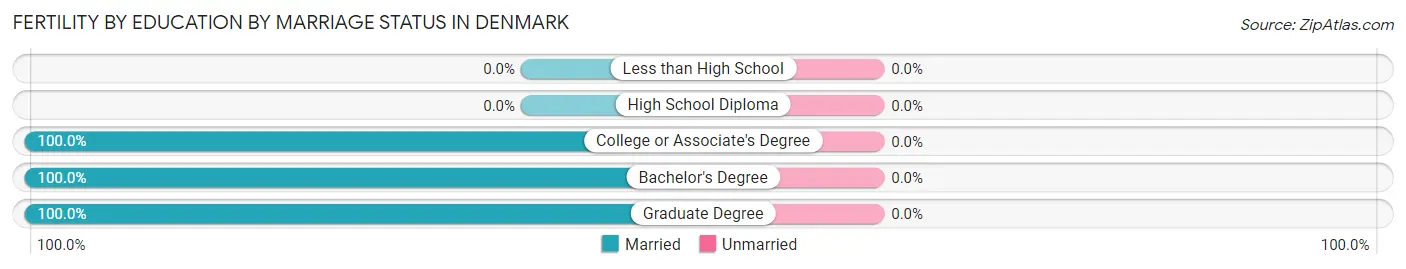
| Educational Attainment | Married | Unmarried |
| Less than High School | 0 (0.0%) | 0 (0.0%) |
| High School Diploma | 0 (0.0%) | 0 (0.0%) |
| College or Associate's Degree | 5 (100.0%) | 0 (0.0%) |
| Bachelor's Degree | 5 (100.0%) | 0 (0.0%) |
| Graduate Degree | 9 (100.0%) | 0 (0.0%) |
| Total | 19 (100.0%) | 0 (0.0%) |
Employment Characteristics in Denmark
Employment by Class of Employer in Denmark
Among the 1,349 employed individuals in Denmark, private company employees (948 | 70.3%), self-employed (not incorporated) (133 | 9.9%), and local government employees (96 | 7.1%) make up the most common classes of employment.
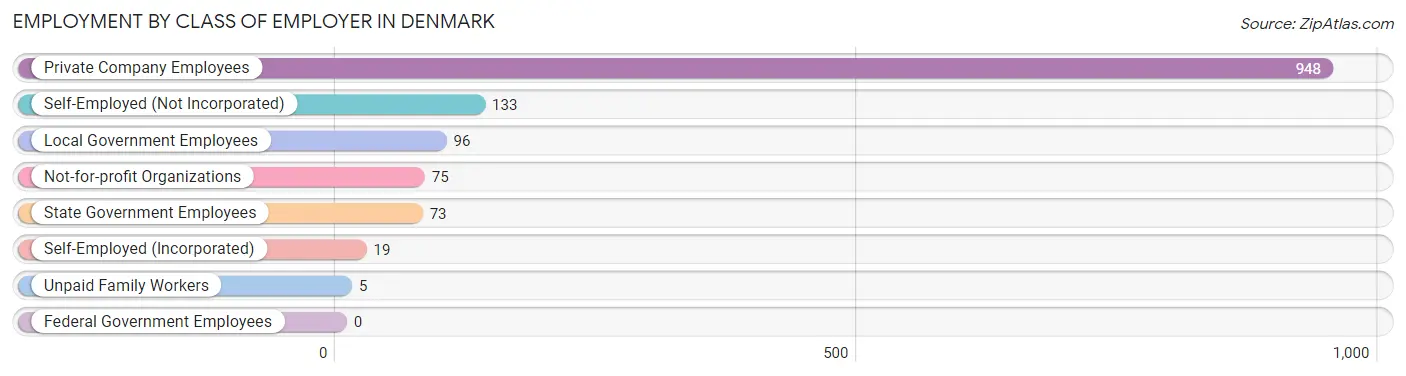
| Employer Class | # Employees | % Employees |
| Private Company Employees | 948 | 70.3% |
| Self-Employed (Incorporated) | 19 | 1.4% |
| Self-Employed (Not Incorporated) | 133 | 9.9% |
| Not-for-profit Organizations | 75 | 5.6% |
| Local Government Employees | 96 | 7.1% |
| State Government Employees | 73 | 5.4% |
| Federal Government Employees | 0 | 0.0% |
| Unpaid Family Workers | 5 | 0.4% |
| Total | 1,349 | 100.0% |
Employment Status by Age in Denmark
According to the labor force statistics for Denmark, out of the total population over 16 years of age (1,865), 75.2% or 1,402 individuals are in the labor force, with 1.7% or 24 of them unemployed. The age group with the highest labor force participation rate is 45 to 54 years, with 97.4% or 373 individuals in the labor force. Within the labor force, the 20 to 24 years age range has the highest percentage of unemployed individuals, with 8.6% or 14 of them being unemployed.
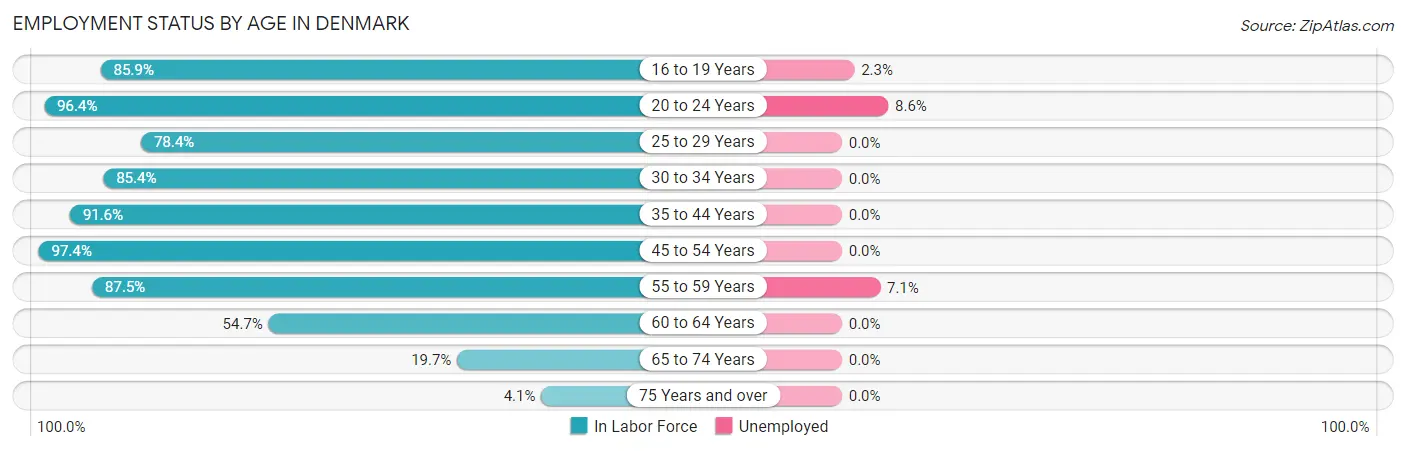
| Age Bracket | In Labor Force | Unemployed |
| 16 to 19 Years | 177 (85.9%) | 4 (2.3%) |
| 20 to 24 Years | 163 (96.4%) | 14 (8.6%) |
| 25 to 29 Years | 76 (78.4%) | 0 (0.0%) |
| 30 to 34 Years | 181 (85.4%) | 0 (0.0%) |
| 35 to 44 Years | 250 (91.6%) | 0 (0.0%) |
| 45 to 54 Years | 373 (97.4%) | 0 (0.0%) |
| 55 to 59 Years | 84 (87.5%) | 6 (7.1%) |
| 60 to 64 Years | 52 (54.7%) | 0 (0.0%) |
| 65 to 74 Years | 42 (19.7%) | 0 (0.0%) |
| 75 Years and over | 5 (4.1%) | 0 (0.0%) |
| Total | 1,402 (75.2%) | 24 (1.7%) |
Employment Status by Educational Attainment in Denmark
According to labor force statistics for Denmark, 87.9% of individuals (1,016) out of the total population between 25 and 64 years of age (1,156) are in the labor force, with 0.6% or 6 of them being unemployed. The group with the highest labor force participation rate are those with the educational attainment of college / associate degree, with 95.9% or 375 individuals in the labor force. Within the labor force, individuals with college / associate degree education have the highest percentage of unemployment, with 1.6% or 6 of them being unemployed.
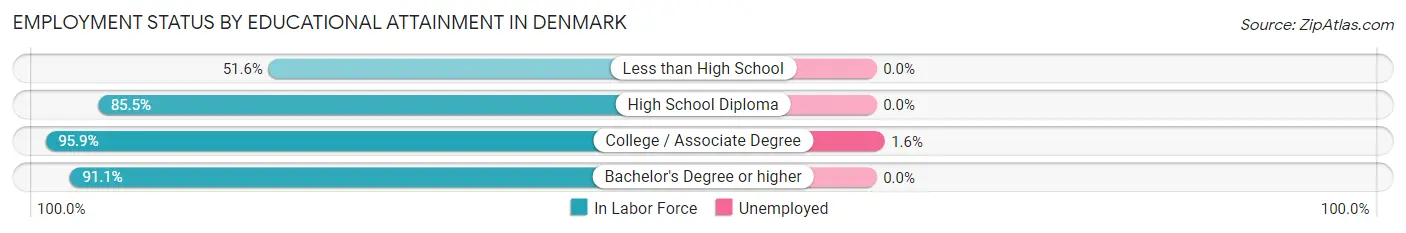
| Educational Attainment | In Labor Force | Unemployed |
| Less than High School | 48 (51.6%) | 0 (0.0%) |
| High School Diploma | 296 (85.5%) | 0 (0.0%) |
| College / Associate Degree | 375 (95.9%) | 6 (1.6%) |
| Bachelor's Degree or higher | 297 (91.1%) | 0 (0.0%) |
| Total | 1,016 (87.9%) | 7 (0.6%) |
Employment Occupations by Sex in Denmark
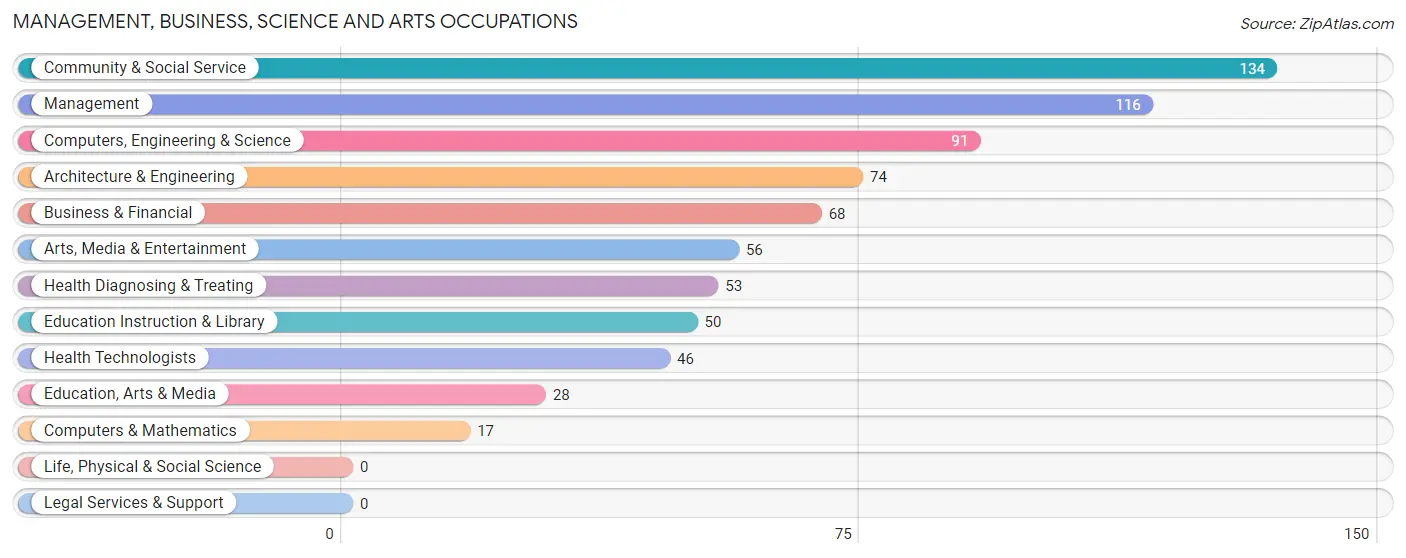
Management, Business, Science and Arts Occupations
The most common Management, Business, Science and Arts occupations in Denmark are Community & Social Service (134 | 9.7%), Management (116 | 8.4%), Computers, Engineering & Science (91 | 6.6%), Architecture & Engineering (74 | 5.4%), and Business & Financial (68 | 4.9%).
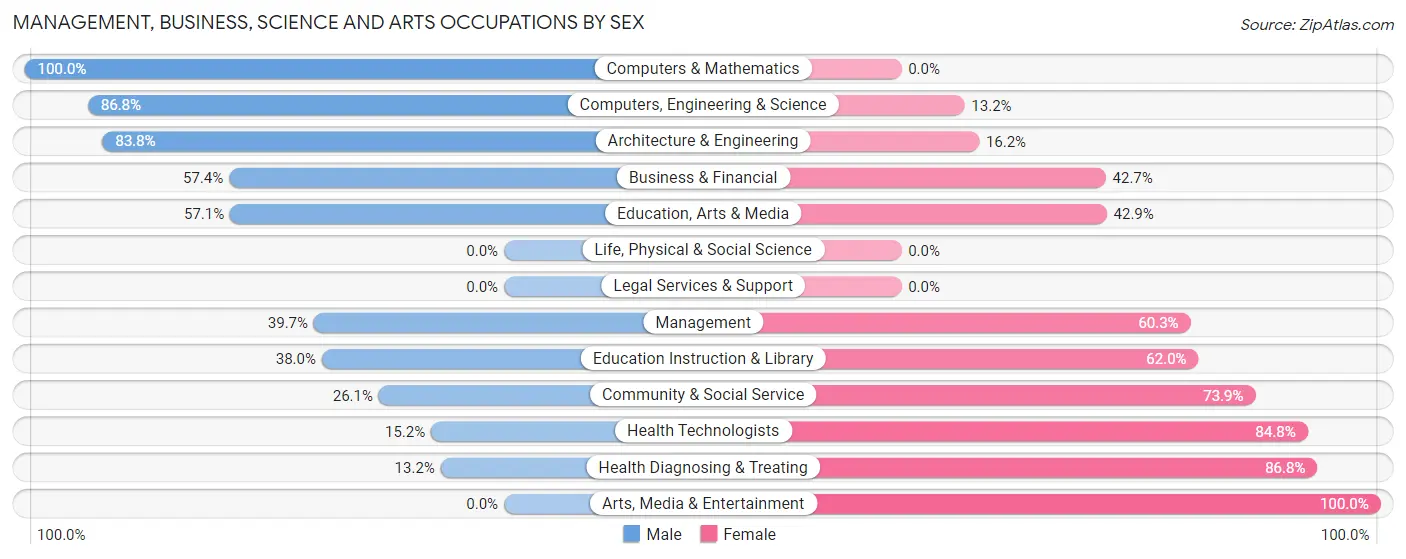
Management, Business, Science and Arts Occupations by Sex
Within the Management, Business, Science and Arts occupations in Denmark, the most male-oriented occupations are Computers & Mathematics (100.0%), Computers, Engineering & Science (86.8%), and Architecture & Engineering (83.8%), while the most female-oriented occupations are Arts, Media & Entertainment (100.0%), Health Diagnosing & Treating (86.8%), and Health Technologists (84.8%).
| Occupation | Male | Female |
| Management | 46 (39.7%) | 70 (60.3%) |
| Business & Financial | 39 (57.4%) | 29 (42.6%) |
| Computers, Engineering & Science | 79 (86.8%) | 12 (13.2%) |
| Computers & Mathematics | 17 (100.0%) | 0 (0.0%) |
| Architecture & Engineering | 62 (83.8%) | 12 (16.2%) |
| Life, Physical & Social Science | 0 (0.0%) | 0 (0.0%) |
| Community & Social Service | 35 (26.1%) | 99 (73.9%) |
| Education, Arts & Media | 16 (57.1%) | 12 (42.9%) |
| Legal Services & Support | 0 (0.0%) | 0 (0.0%) |
| Education Instruction & Library | 19 (38.0%) | 31 (62.0%) |
| Arts, Media & Entertainment | 0 (0.0%) | 56 (100.0%) |
| Health Diagnosing & Treating | 7 (13.2%) | 46 (86.8%) |
| Health Technologists | 7 (15.2%) | 39 (84.8%) |
| Total (Category) | 206 (44.6%) | 256 (55.4%) |
| Total (Overall) | 766 (55.5%) | 613 (44.5%) |
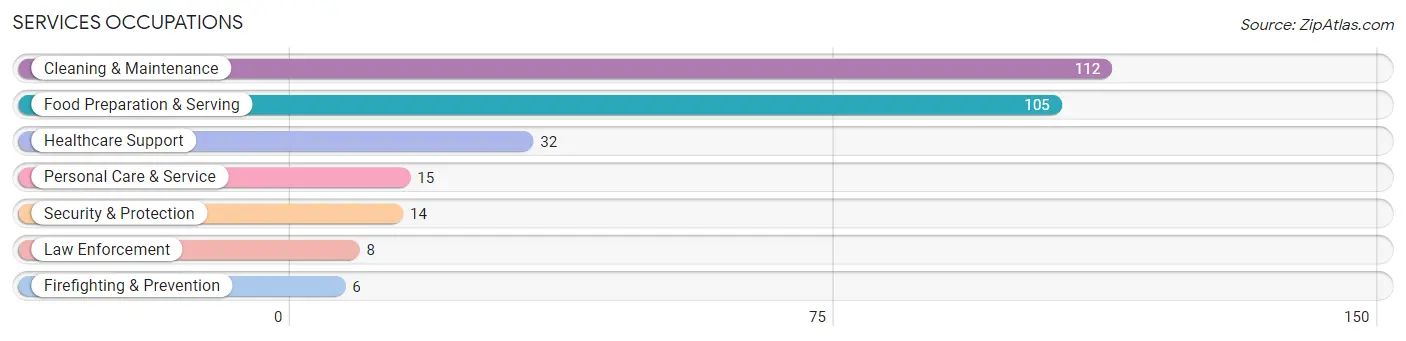
Services Occupations
The most common Services occupations in Denmark are Cleaning & Maintenance (112 | 8.1%), Food Preparation & Serving (105 | 7.6%), Healthcare Support (32 | 2.3%), Personal Care & Service (15 | 1.1%), and Security & Protection (14 | 1.0%).
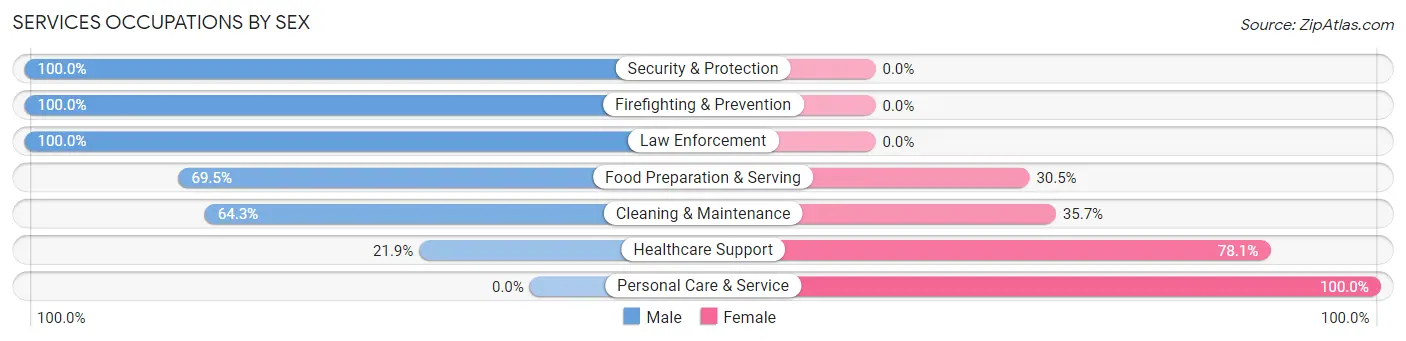
Services Occupations by Sex
Within the Services occupations in Denmark, the most male-oriented occupations are Security & Protection (100.0%), Firefighting & Prevention (100.0%), and Law Enforcement (100.0%), while the most female-oriented occupations are Personal Care & Service (100.0%), Healthcare Support (78.1%), and Cleaning & Maintenance (35.7%).
| Occupation | Male | Female |
| Healthcare Support | 7 (21.9%) | 25 (78.1%) |
| Security & Protection | 14 (100.0%) | 0 (0.0%) |
| Firefighting & Prevention | 6 (100.0%) | 0 (0.0%) |
| Law Enforcement | 8 (100.0%) | 0 (0.0%) |
| Food Preparation & Serving | 73 (69.5%) | 32 (30.5%) |
| Cleaning & Maintenance | 72 (64.3%) | 40 (35.7%) |
| Personal Care & Service | 0 (0.0%) | 15 (100.0%) |
| Total (Category) | 166 (59.7%) | 112 (40.3%) |
| Total (Overall) | 766 (55.5%) | 613 (44.5%) |
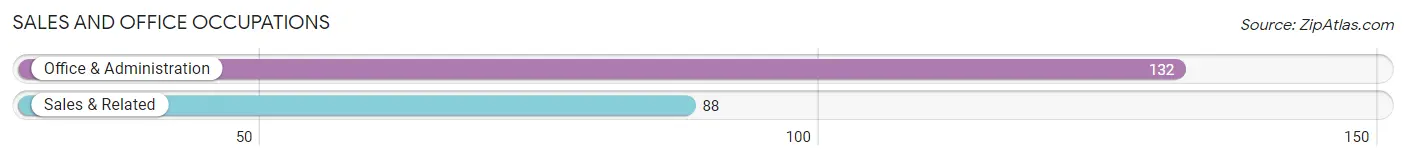
Sales and Office Occupations
The most common Sales and Office occupations in Denmark are Office & Administration (132 | 9.6%), and Sales & Related (88 | 6.4%).
Sales and Office Occupations by Sex
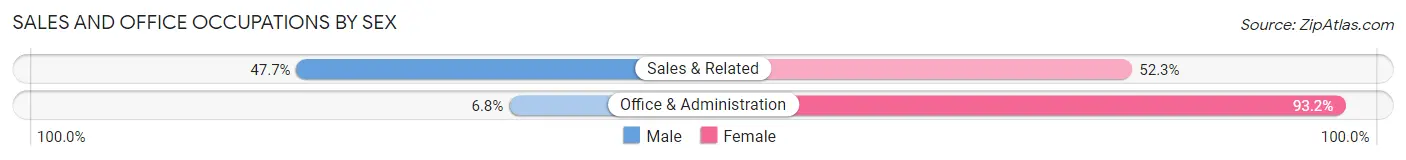
| Occupation | Male | Female |
| Sales & Related | 42 (47.7%) | 46 (52.3%) |
| Office & Administration | 9 (6.8%) | 123 (93.2%) |
| Total (Category) | 51 (23.2%) | 169 (76.8%) |
| Total (Overall) | 766 (55.5%) | 613 (44.5%) |
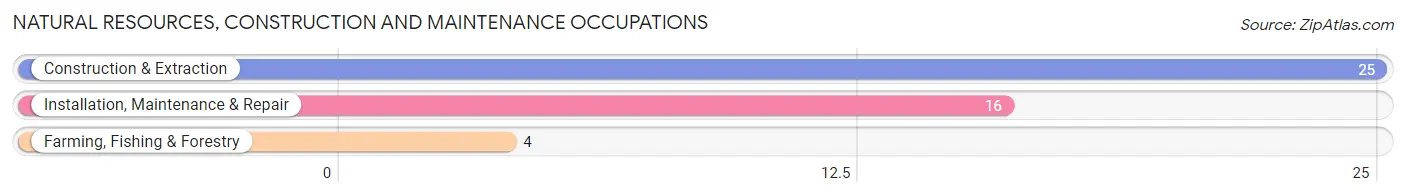
Natural Resources, Construction and Maintenance Occupations
The most common Natural Resources, Construction and Maintenance occupations in Denmark are Construction & Extraction (25 | 1.8%), Installation, Maintenance & Repair (16 | 1.2%), and Farming, Fishing & Forestry (4 | 0.3%).
Natural Resources, Construction and Maintenance Occupations by Sex
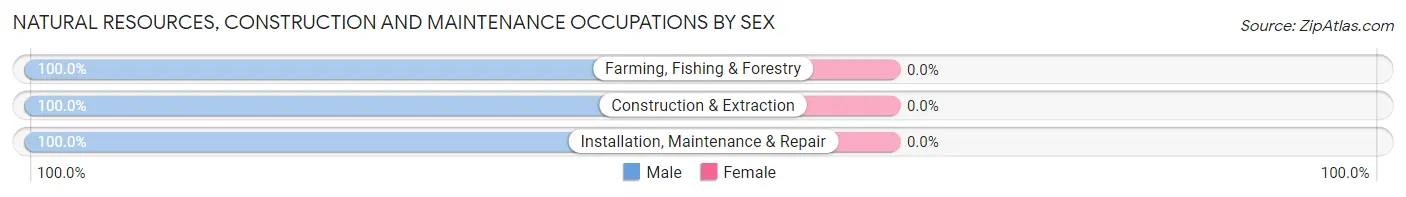
| Occupation | Male | Female |
| Farming, Fishing & Forestry | 4 (100.0%) | 0 (0.0%) |
| Construction & Extraction | 25 (100.0%) | 0 (0.0%) |
| Installation, Maintenance & Repair | 16 (100.0%) | 0 (0.0%) |
| Total (Category) | 45 (100.0%) | 0 (0.0%) |
| Total (Overall) | 766 (55.5%) | 613 (44.5%) |
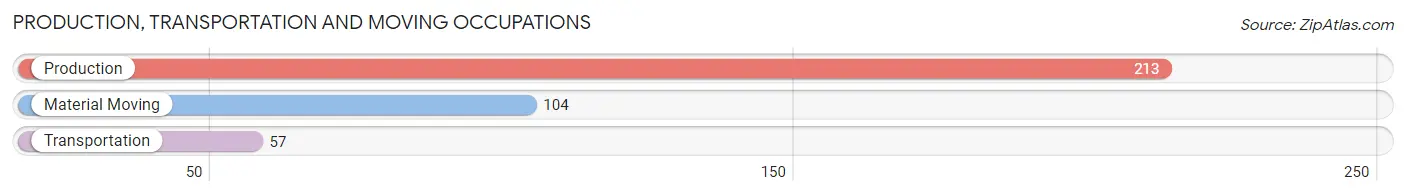
Production, Transportation and Moving Occupations
The most common Production, Transportation and Moving occupations in Denmark are Production (213 | 15.4%), Material Moving (104 | 7.5%), and Transportation (57 | 4.1%).
Production, Transportation and Moving Occupations by Sex
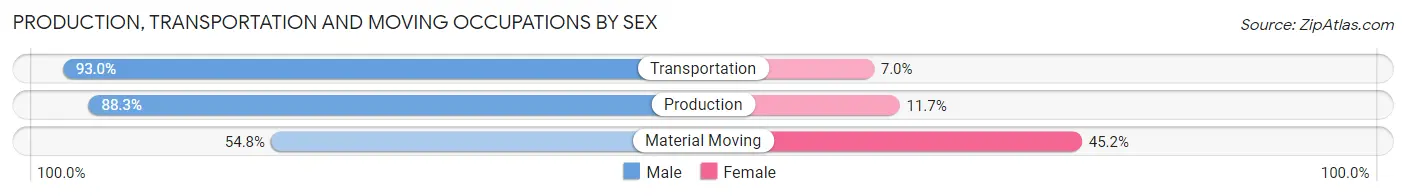
| Occupation | Male | Female |
| Production | 188 (88.3%) | 25 (11.7%) |
| Transportation | 53 (93.0%) | 4 (7.0%) |
| Material Moving | 57 (54.8%) | 47 (45.2%) |
| Total (Category) | 298 (79.7%) | 76 (20.3%) |
| Total (Overall) | 766 (55.5%) | 613 (44.5%) |
Employment Industries by Sex in Denmark
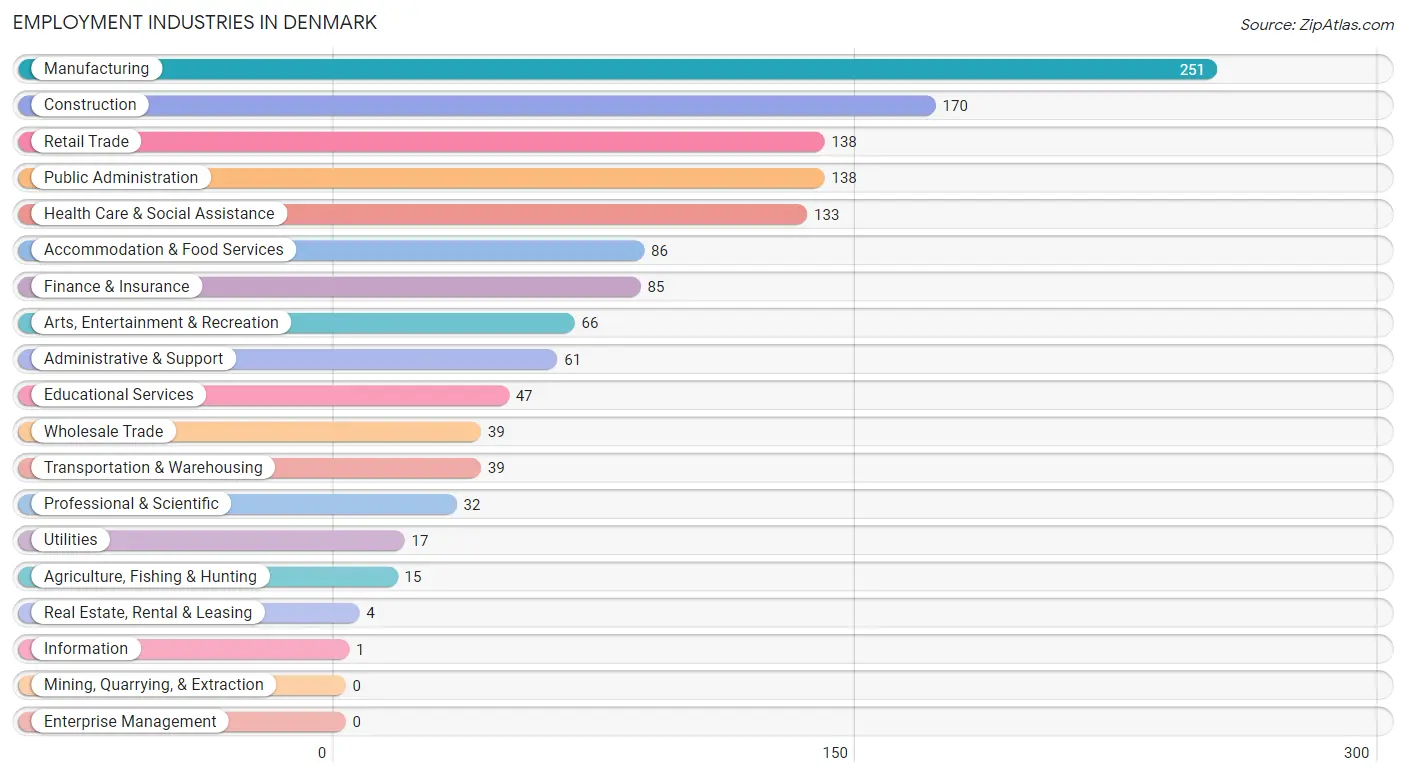
Employment Industries in Denmark
The major employment industries in Denmark include Manufacturing (251 | 18.2%), Construction (170 | 12.3%), Retail Trade (138 | 10.0%), Public Administration (138 | 10.0%), and Health Care & Social Assistance (133 | 9.6%).
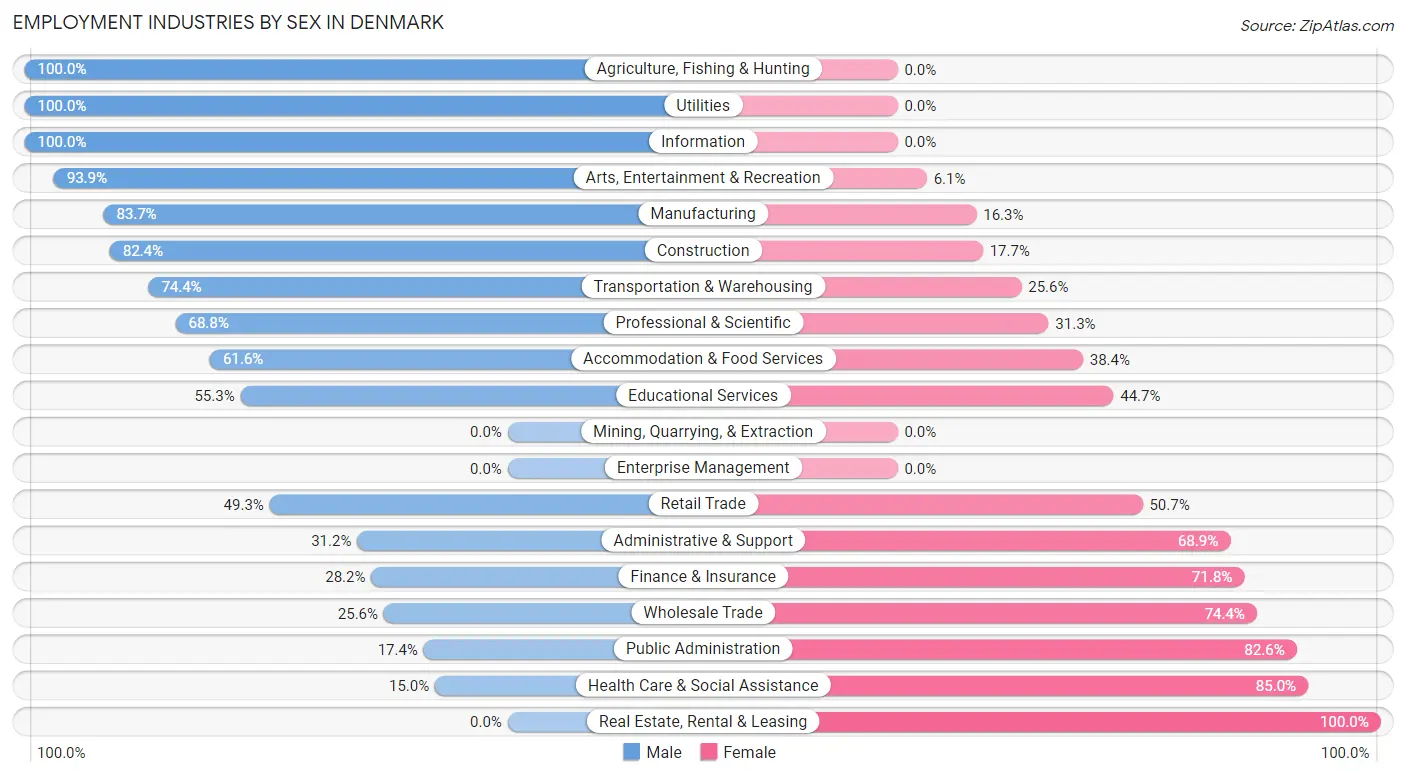
Employment Industries by Sex in Denmark
The Denmark industries that see more men than women are Agriculture, Fishing & Hunting (100.0%), Utilities (100.0%), and Information (100.0%), whereas the industries that tend to have a higher number of women are Real Estate, Rental & Leasing (100.0%), Health Care & Social Assistance (85.0%), and Public Administration (82.6%).
| Industry | Male | Female |
| Agriculture, Fishing & Hunting | 15 (100.0%) | 0 (0.0%) |
| Mining, Quarrying, & Extraction | 0 (0.0%) | 0 (0.0%) |
| Construction | 140 (82.4%) | 30 (17.6%) |
| Manufacturing | 210 (83.7%) | 41 (16.3%) |
| Wholesale Trade | 10 (25.6%) | 29 (74.4%) |
| Retail Trade | 68 (49.3%) | 70 (50.7%) |
| Transportation & Warehousing | 29 (74.4%) | 10 (25.6%) |
| Utilities | 17 (100.0%) | 0 (0.0%) |
| Information | 1 (100.0%) | 0 (0.0%) |
| Finance & Insurance | 24 (28.2%) | 61 (71.8%) |
| Real Estate, Rental & Leasing | 0 (0.0%) | 4 (100.0%) |
| Professional & Scientific | 22 (68.8%) | 10 (31.2%) |
| Enterprise Management | 0 (0.0%) | 0 (0.0%) |
| Administrative & Support | 19 (31.1%) | 42 (68.9%) |
| Educational Services | 26 (55.3%) | 21 (44.7%) |
| Health Care & Social Assistance | 20 (15.0%) | 113 (85.0%) |
| Arts, Entertainment & Recreation | 62 (93.9%) | 4 (6.1%) |
| Accommodation & Food Services | 53 (61.6%) | 33 (38.4%) |
| Public Administration | 24 (17.4%) | 114 (82.6%) |
| Total | 766 (55.5%) | 613 (44.5%) |
Education in Denmark
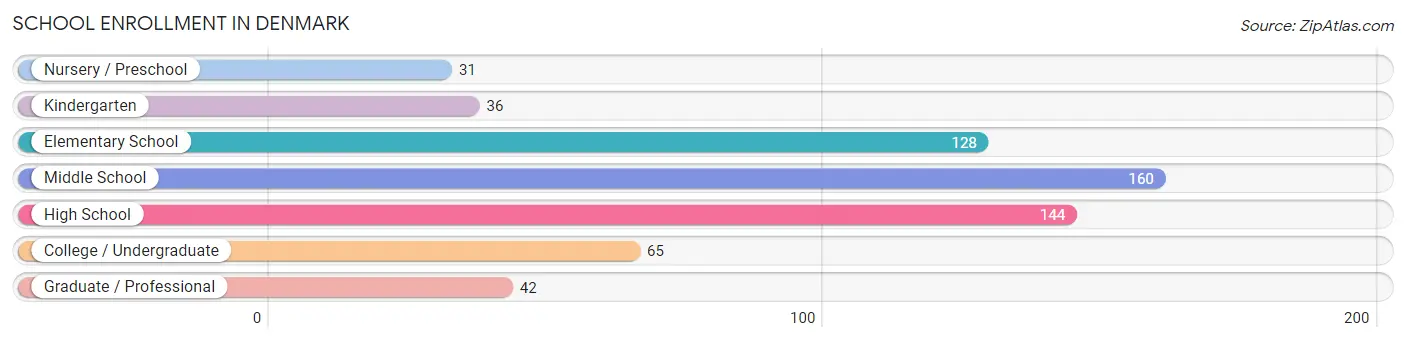
School Enrollment in Denmark
The most common levels of schooling among the 606 students in Denmark are middle school (160 | 26.4%), high school (144 | 23.8%), and elementary school (128 | 21.1%).
| School Level | # Students | % Students |
| Nursery / Preschool | 31 | 5.1% |
| Kindergarten | 36 | 5.9% |
| Elementary School | 128 | 21.1% |
| Middle School | 160 | 26.4% |
| High School | 144 | 23.8% |
| College / Undergraduate | 65 | 10.7% |
| Graduate / Professional | 42 | 6.9% |
| Total | 606 | 100.0% |
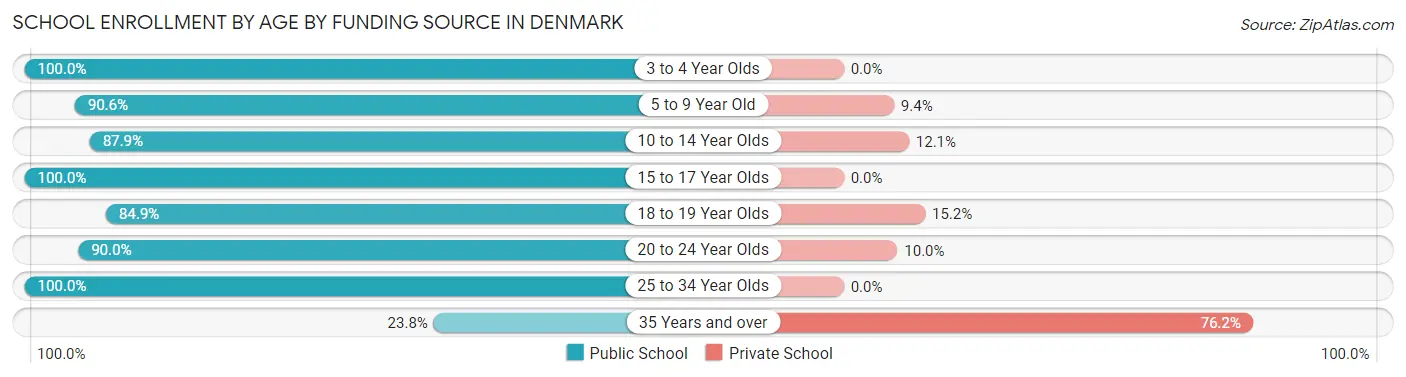
School Enrollment by Age by Funding Source in Denmark
Out of a total of 606 students who are enrolled in schools in Denmark, 64 (10.6%) attend a private institution, while the remaining 542 (89.4%) are enrolled in public schools. The age group of 35 years and over has the highest likelihood of being enrolled in private schools, with 16 (76.2% in the age bracket) enrolled. Conversely, the age group of 3 to 4 year olds has the lowest likelihood of being enrolled in a private school, with 11 (100.0% in the age bracket) attending a public institution.
| Age Bracket | Public School | Private School |
| 3 to 4 Year Olds | 11 (100.0%) | 0 (0.0%) |
| 5 to 9 Year Old | 155 (90.6%) | 16 (9.4%) |
| 10 to 14 Year Olds | 152 (87.9%) | 21 (12.1%) |
| 15 to 17 Year Olds | 122 (100.0%) | 0 (0.0%) |
| 18 to 19 Year Olds | 28 (84.9%) | 5 (15.1%) |
| 20 to 24 Year Olds | 54 (90.0%) | 6 (10.0%) |
| 25 to 34 Year Olds | 15 (100.0%) | 0 (0.0%) |
| 35 Years and over | 5 (23.8%) | 16 (76.2%) |
| Total | 542 (89.4%) | 64 (10.6%) |
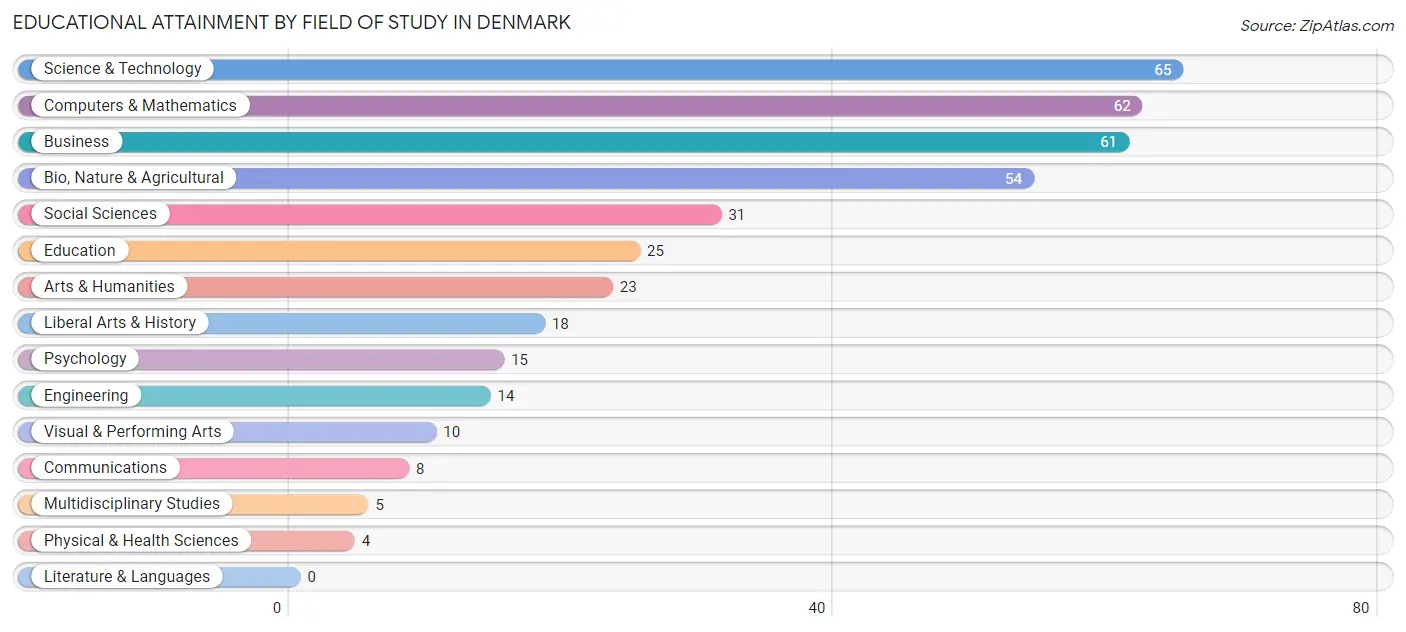
Educational Attainment by Field of Study in Denmark
Science & technology (65 | 16.5%), computers & mathematics (62 | 15.7%), business (61 | 15.4%), bio, nature & agricultural (54 | 13.7%), and social sciences (31 | 7.9%) are the most common fields of study among 395 individuals in Denmark who have obtained a bachelor's degree or higher.
| Field of Study | # Graduates | % Graduates |
| Computers & Mathematics | 62 | 15.7% |
| Bio, Nature & Agricultural | 54 | 13.7% |
| Physical & Health Sciences | 4 | 1.0% |
| Psychology | 15 | 3.8% |
| Social Sciences | 31 | 7.9% |
| Engineering | 14 | 3.5% |
| Multidisciplinary Studies | 5 | 1.3% |
| Science & Technology | 65 | 16.5% |
| Business | 61 | 15.4% |
| Education | 25 | 6.3% |
| Literature & Languages | 0 | 0.0% |
| Liberal Arts & History | 18 | 4.6% |
| Visual & Performing Arts | 10 | 2.5% |
| Communications | 8 | 2.0% |
| Arts & Humanities | 23 | 5.8% |
| Total | 395 | 100.0% |
Transportation & Commute in Denmark
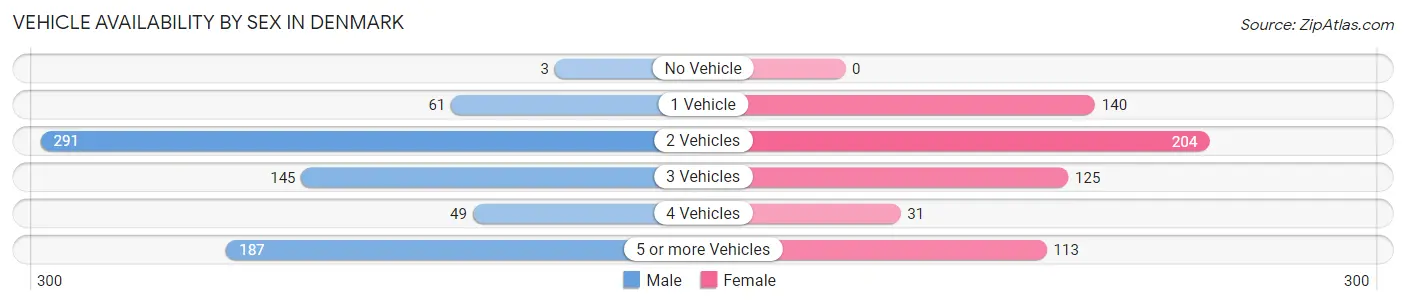
Vehicle Availability by Sex in Denmark
The most prevalent vehicle ownership categories in Denmark are males with 2 vehicles (291, accounting for 39.5%) and females with 2 vehicles (204, making up 47.5%).
| Vehicles Available | Male | Female |
| No Vehicle | 3 (0.4%) | 0 (0.0%) |
| 1 Vehicle | 61 (8.3%) | 140 (22.8%) |
| 2 Vehicles | 291 (39.5%) | 204 (33.3%) |
| 3 Vehicles | 145 (19.7%) | 125 (20.4%) |
| 4 Vehicles | 49 (6.7%) | 31 (5.1%) |
| 5 or more Vehicles | 187 (25.4%) | 113 (18.4%) |
| Total | 736 (100.0%) | 613 (100.0%) |
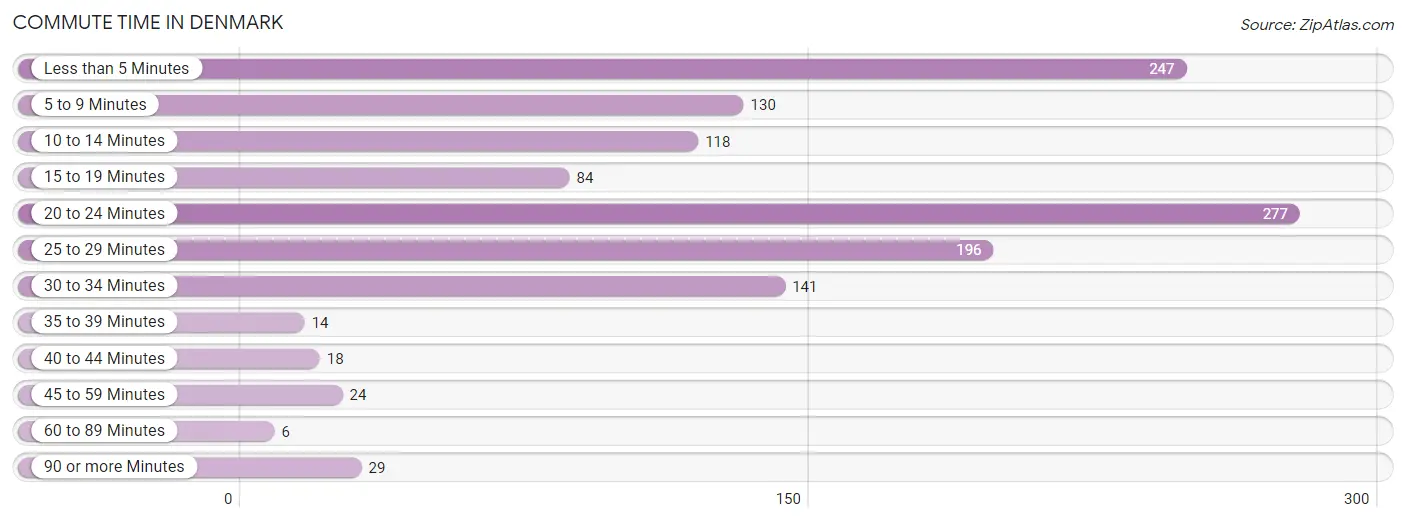
Commute Time in Denmark
The most frequently occuring commute durations in Denmark are 20 to 24 minutes (277 commuters, 21.6%), less than 5 minutes (247 commuters, 19.2%), and 25 to 29 minutes (196 commuters, 15.3%).
| Commute Time | # Commuters | % Commuters |
| Less than 5 Minutes | 247 | 19.2% |
| 5 to 9 Minutes | 130 | 10.1% |
| 10 to 14 Minutes | 118 | 9.2% |
| 15 to 19 Minutes | 84 | 6.5% |
| 20 to 24 Minutes | 277 | 21.6% |
| 25 to 29 Minutes | 196 | 15.3% |
| 30 to 34 Minutes | 141 | 11.0% |
| 35 to 39 Minutes | 14 | 1.1% |
| 40 to 44 Minutes | 18 | 1.4% |
| 45 to 59 Minutes | 24 | 1.9% |
| 60 to 89 Minutes | 6 | 0.5% |
| 90 or more Minutes | 29 | 2.3% |
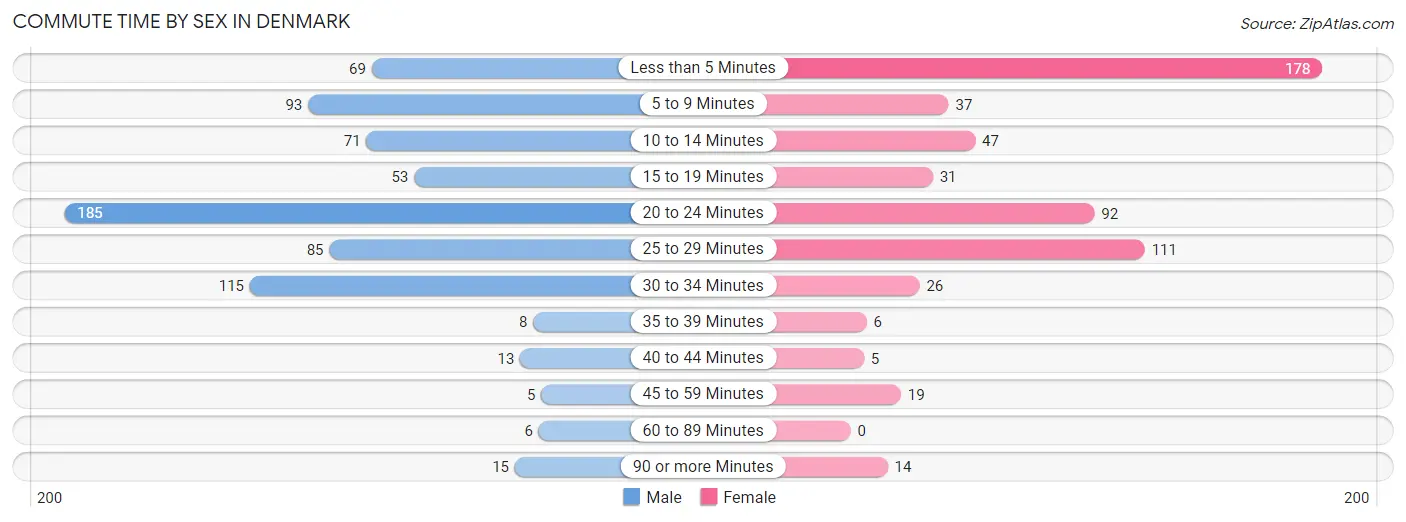
Commute Time by Sex in Denmark
The most common commute times in Denmark are 20 to 24 minutes (185 commuters, 25.8%) for males and less than 5 minutes (178 commuters, 31.5%) for females.
| Commute Time | Male | Female |
| Less than 5 Minutes | 69 (9.6%) | 178 (31.5%) |
| 5 to 9 Minutes | 93 (13.0%) | 37 (6.5%) |
| 10 to 14 Minutes | 71 (9.9%) | 47 (8.3%) |
| 15 to 19 Minutes | 53 (7.4%) | 31 (5.5%) |
| 20 to 24 Minutes | 185 (25.8%) | 92 (16.3%) |
| 25 to 29 Minutes | 85 (11.8%) | 111 (19.6%) |
| 30 to 34 Minutes | 115 (16.0%) | 26 (4.6%) |
| 35 to 39 Minutes | 8 (1.1%) | 6 (1.1%) |
| 40 to 44 Minutes | 13 (1.8%) | 5 (0.9%) |
| 45 to 59 Minutes | 5 (0.7%) | 19 (3.4%) |
| 60 to 89 Minutes | 6 (0.8%) | 0 (0.0%) |
| 90 or more Minutes | 15 (2.1%) | 14 (2.5%) |
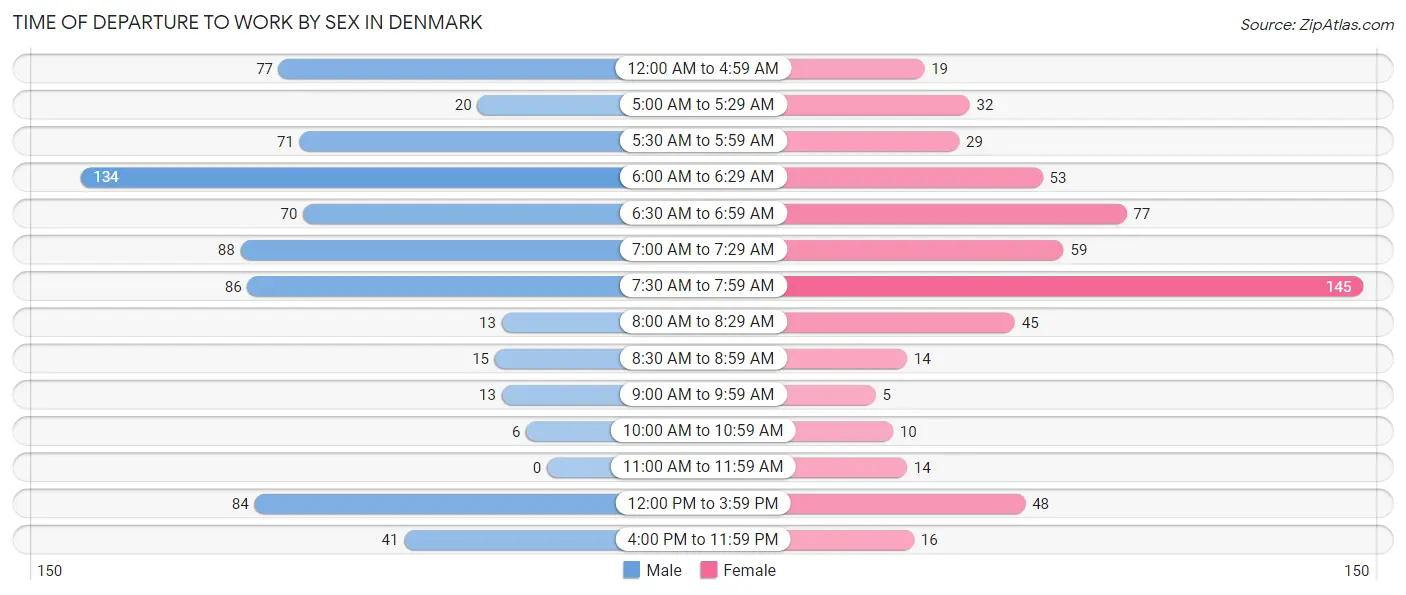
Time of Departure to Work by Sex in Denmark
The most frequent times of departure to work in Denmark are 6:00 AM to 6:29 AM (134, 18.7%) for males and 7:30 AM to 7:59 AM (145, 25.6%) for females.
| Time of Departure | Male | Female |
| 12:00 AM to 4:59 AM | 77 (10.7%) | 19 (3.4%) |
| 5:00 AM to 5:29 AM | 20 (2.8%) | 32 (5.7%) |
| 5:30 AM to 5:59 AM | 71 (9.9%) | 29 (5.1%) |
| 6:00 AM to 6:29 AM | 134 (18.7%) | 53 (9.4%) |
| 6:30 AM to 6:59 AM | 70 (9.8%) | 77 (13.6%) |
| 7:00 AM to 7:29 AM | 88 (12.3%) | 59 (10.4%) |
| 7:30 AM to 7:59 AM | 86 (12.0%) | 145 (25.6%) |
| 8:00 AM to 8:29 AM | 13 (1.8%) | 45 (8.0%) |
| 8:30 AM to 8:59 AM | 15 (2.1%) | 14 (2.5%) |
| 9:00 AM to 9:59 AM | 13 (1.8%) | 5 (0.9%) |
| 10:00 AM to 10:59 AM | 6 (0.8%) | 10 (1.8%) |
| 11:00 AM to 11:59 AM | 0 (0.0%) | 14 (2.5%) |
| 12:00 PM to 3:59 PM | 84 (11.7%) | 48 (8.5%) |
| 4:00 PM to 11:59 PM | 41 (5.7%) | 16 (2.8%) |
| Total | 718 (100.0%) | 566 (100.0%) |
Housing Occupancy in Denmark
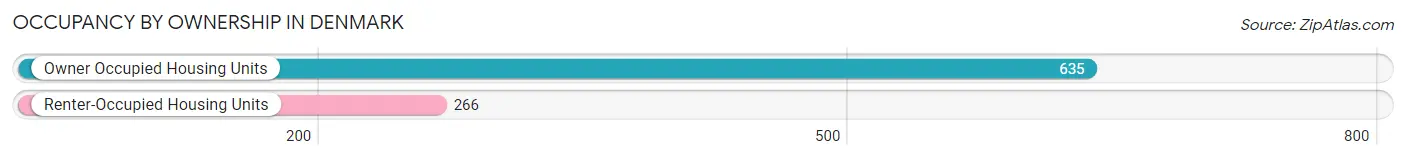
Occupancy by Ownership in Denmark
Of the total 901 dwellings in Denmark, owner-occupied units account for 635 (70.5%), while renter-occupied units make up 266 (29.5%).
| Occupancy | # Housing Units | % Housing Units |
| Owner Occupied Housing Units | 635 | 70.5% |
| Renter-Occupied Housing Units | 266 | 29.5% |
| Total Occupied Housing Units | 901 | 100.0% |
Occupancy by Household Size in Denmark
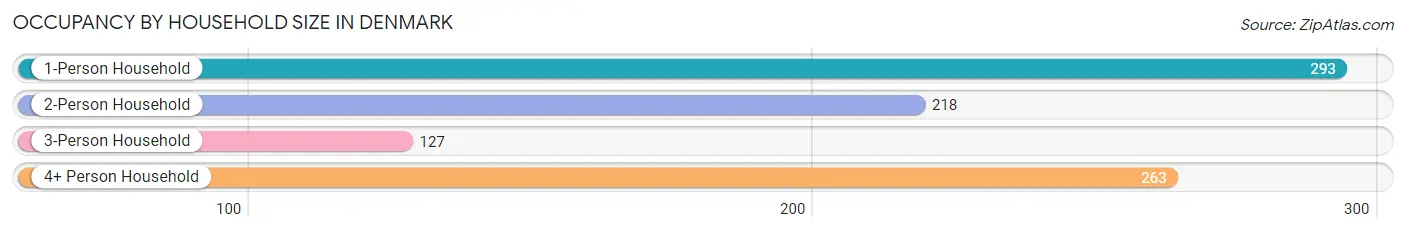
| Household Size | # Housing Units | % Housing Units |
| 1-Person Household | 293 | 32.5% |
| 2-Person Household | 218 | 24.2% |
| 3-Person Household | 127 | 14.1% |
| 4+ Person Household | 263 | 29.2% |
| Total Housing Units | 901 | 100.0% |
Occupancy by Ownership by Household Size in Denmark
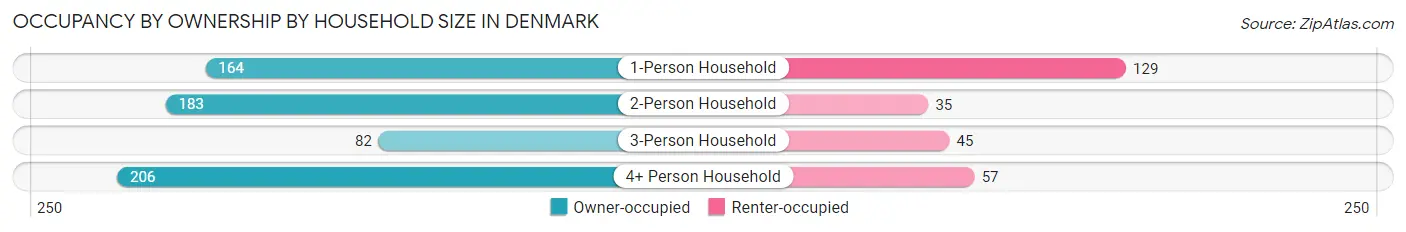
| Household Size | Owner-occupied | Renter-occupied |
| 1-Person Household | 164 (56.0%) | 129 (44.0%) |
| 2-Person Household | 183 (83.9%) | 35 (16.1%) |
| 3-Person Household | 82 (64.6%) | 45 (35.4%) |
| 4+ Person Household | 206 (78.3%) | 57 (21.7%) |
| Total Housing Units | 635 (70.5%) | 266 (29.5%) |
Occupancy by Educational Attainment in Denmark
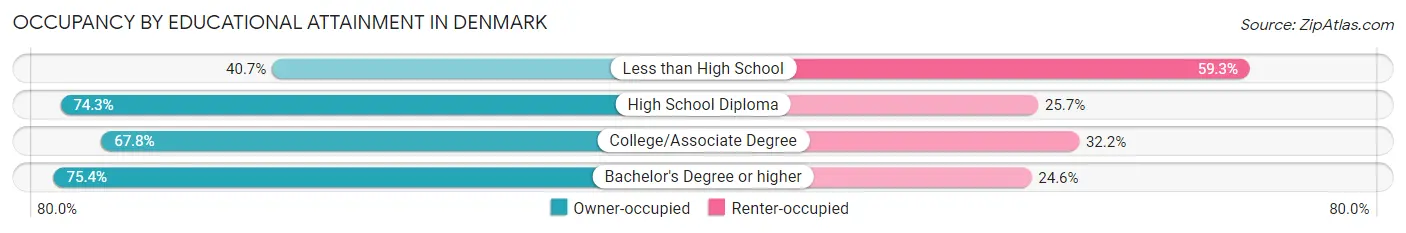
| Household Size | Owner-occupied | Renter-occupied |
| Less than High School | 22 (40.7%) | 32 (59.3%) |
| High School Diploma | 275 (74.3%) | 95 (25.7%) |
| College/Associate Degree | 194 (67.8%) | 92 (32.2%) |
| Bachelor's Degree or higher | 144 (75.4%) | 47 (24.6%) |
Occupancy by Age of Householder in Denmark
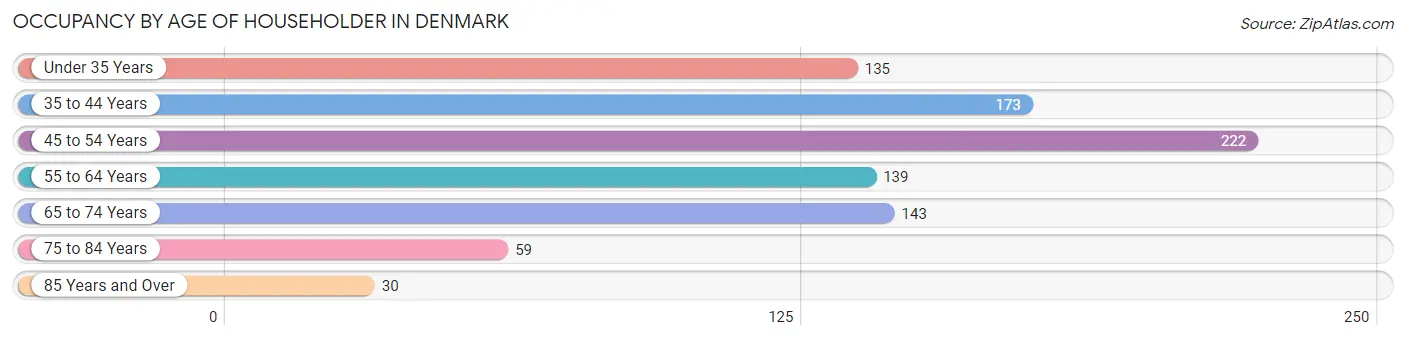
| Age Bracket | # Households | % Households |
| Under 35 Years | 135 | 15.0% |
| 35 to 44 Years | 173 | 19.2% |
| 45 to 54 Years | 222 | 24.6% |
| 55 to 64 Years | 139 | 15.4% |
| 65 to 74 Years | 143 | 15.9% |
| 75 to 84 Years | 59 | 6.6% |
| 85 Years and Over | 30 | 3.3% |
| Total | 901 | 100.0% |
Housing Finances in Denmark
Median Income by Occupancy in Denmark
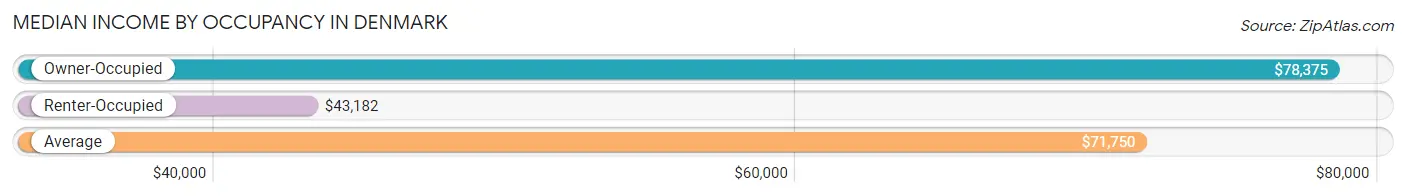
| Occupancy Type | # Households | Median Income |
| Owner-Occupied | 635 (70.5%) | $78,375 |
| Renter-Occupied | 266 (29.5%) | $43,182 |
| Average | 901 (100.0%) | $71,750 |
Occupancy by Householder Income Bracket in Denmark
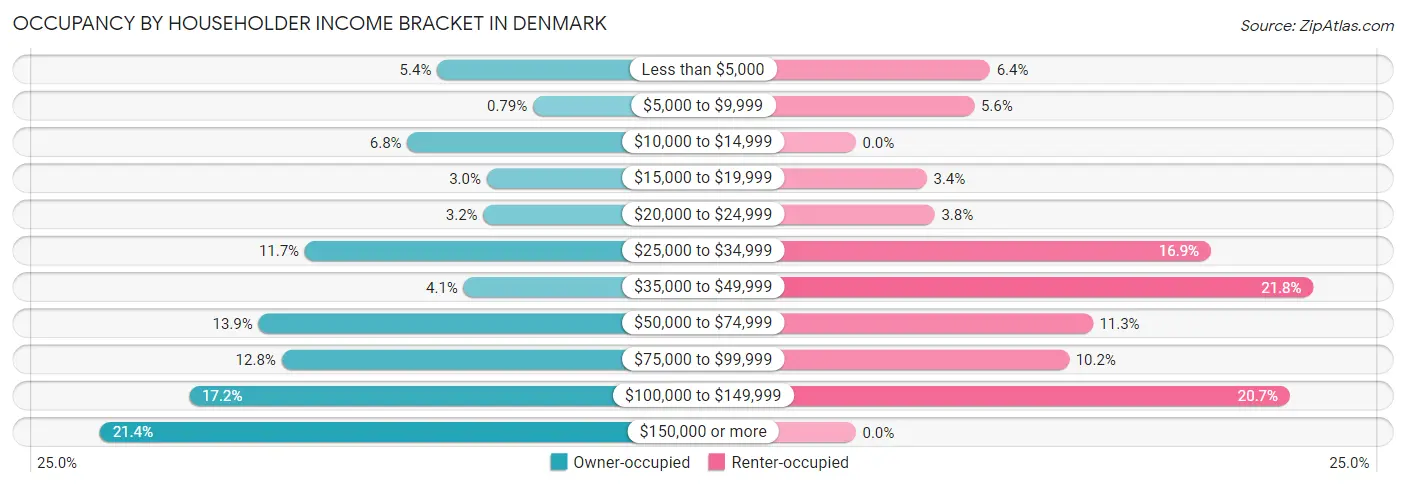
| Income Bracket | Owner-occupied | Renter-occupied |
| Less than $5,000 | 34 (5.3%) | 17 (6.4%) |
| $5,000 to $9,999 | 5 (0.8%) | 15 (5.6%) |
| $10,000 to $14,999 | 43 (6.8%) | 0 (0.0%) |
| $15,000 to $19,999 | 19 (3.0%) | 9 (3.4%) |
| $20,000 to $24,999 | 20 (3.2%) | 10 (3.8%) |
| $25,000 to $34,999 | 74 (11.7%) | 45 (16.9%) |
| $35,000 to $49,999 | 26 (4.1%) | 58 (21.8%) |
| $50,000 to $74,999 | 88 (13.9%) | 30 (11.3%) |
| $75,000 to $99,999 | 81 (12.8%) | 27 (10.2%) |
| $100,000 to $149,999 | 109 (17.2%) | 55 (20.7%) |
| $150,000 or more | 136 (21.4%) | 0 (0.0%) |
| Total | 635 (100.0%) | 266 (100.0%) |
Monthly Housing Cost Tiers in Denmark
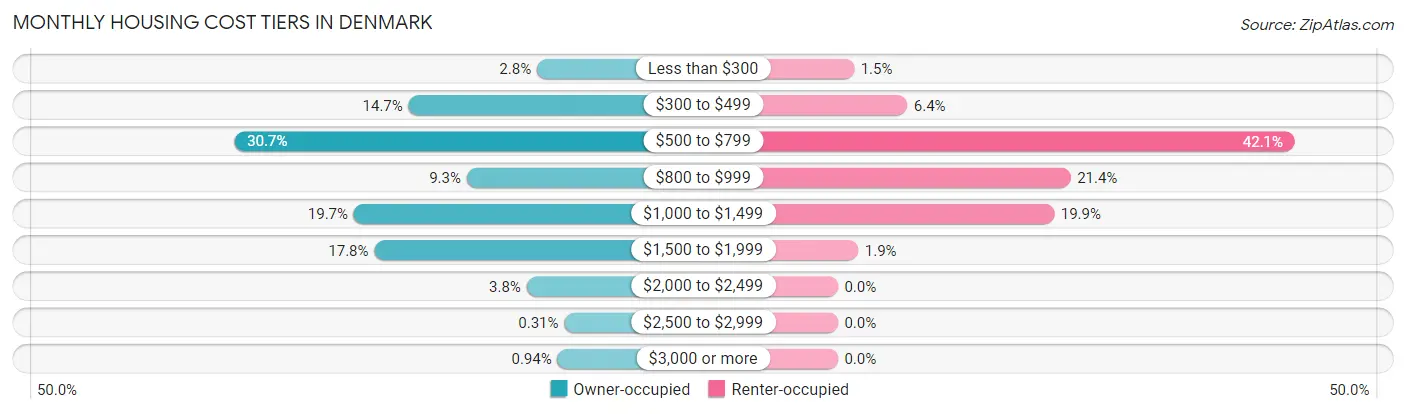
| Monthly Cost | Owner-occupied | Renter-occupied |
| Less than $300 | 18 (2.8%) | 4 (1.5%) |
| $300 to $499 | 93 (14.6%) | 17 (6.4%) |
| $500 to $799 | 195 (30.7%) | 112 (42.1%) |
| $800 to $999 | 59 (9.3%) | 57 (21.4%) |
| $1,000 to $1,499 | 125 (19.7%) | 53 (19.9%) |
| $1,500 to $1,999 | 113 (17.8%) | 5 (1.9%) |
| $2,000 to $2,499 | 24 (3.8%) | 0 (0.0%) |
| $2,500 to $2,999 | 2 (0.3%) | 0 (0.0%) |
| $3,000 or more | 6 (0.9%) | 0 (0.0%) |
| Total | 635 (100.0%) | 266 (100.0%) |
Physical Housing Characteristics in Denmark
Housing Structures in Denmark
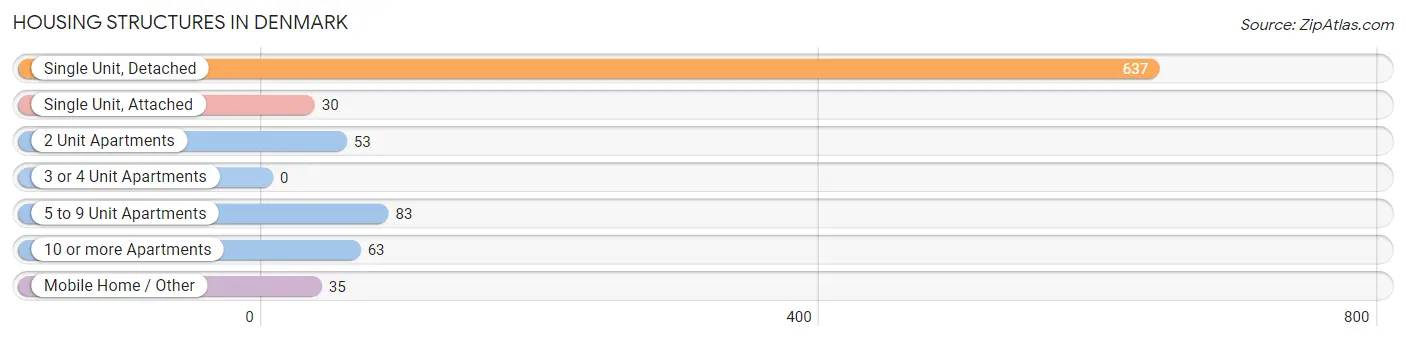
| Structure Type | # Housing Units | % Housing Units |
| Single Unit, Detached | 637 | 70.7% |
| Single Unit, Attached | 30 | 3.3% |
| 2 Unit Apartments | 53 | 5.9% |
| 3 or 4 Unit Apartments | 0 | 0.0% |
| 5 to 9 Unit Apartments | 83 | 9.2% |
| 10 or more Apartments | 63 | 7.0% |
| Mobile Home / Other | 35 | 3.9% |
| Total | 901 | 100.0% |
Housing Structures by Occupancy in Denmark
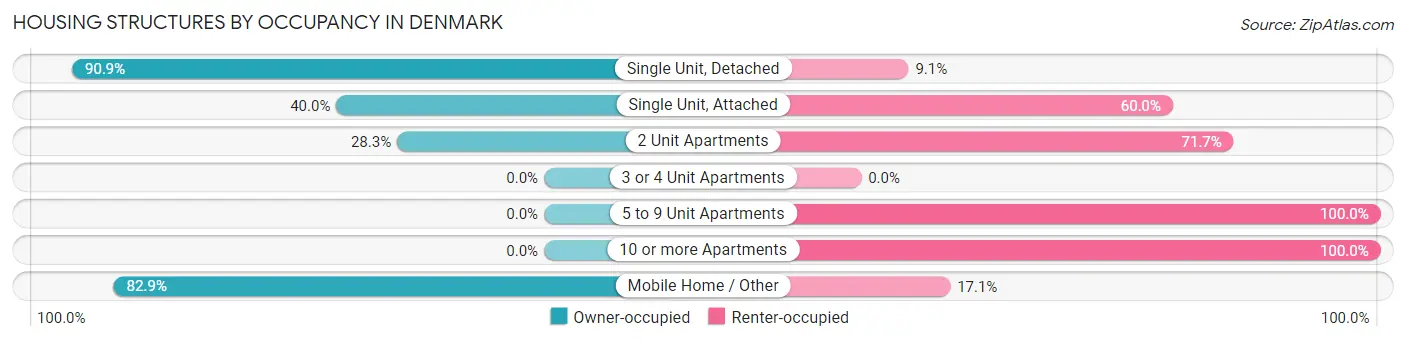
| Structure Type | Owner-occupied | Renter-occupied |
| Single Unit, Detached | 579 (90.9%) | 58 (9.1%) |
| Single Unit, Attached | 12 (40.0%) | 18 (60.0%) |
| 2 Unit Apartments | 15 (28.3%) | 38 (71.7%) |
| 3 or 4 Unit Apartments | 0 (0.0%) | 0 (0.0%) |
| 5 to 9 Unit Apartments | 0 (0.0%) | 83 (100.0%) |
| 10 or more Apartments | 0 (0.0%) | 63 (100.0%) |
| Mobile Home / Other | 29 (82.9%) | 6 (17.1%) |
| Total | 635 (70.5%) | 266 (29.5%) |
Housing Structures by Number of Rooms in Denmark
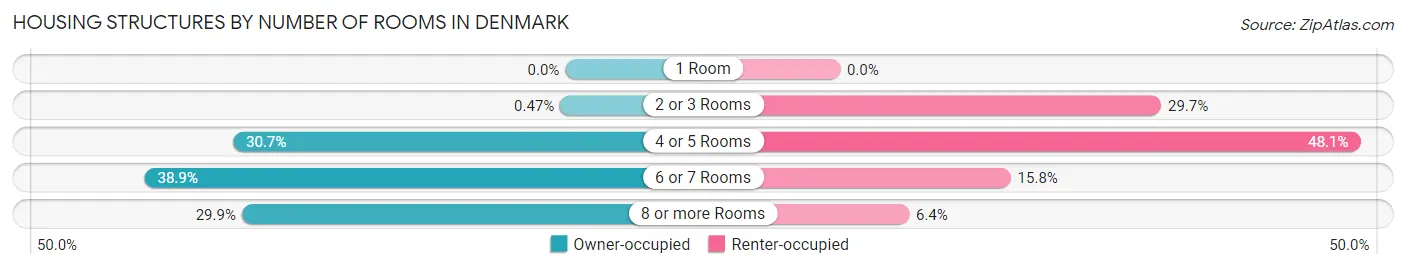
| Number of Rooms | Owner-occupied | Renter-occupied |
| 1 Room | 0 (0.0%) | 0 (0.0%) |
| 2 or 3 Rooms | 3 (0.5%) | 79 (29.7%) |
| 4 or 5 Rooms | 195 (30.7%) | 128 (48.1%) |
| 6 or 7 Rooms | 247 (38.9%) | 42 (15.8%) |
| 8 or more Rooms | 190 (29.9%) | 17 (6.4%) |
| Total | 635 (100.0%) | 266 (100.0%) |
Housing Structure by Heating Type in Denmark
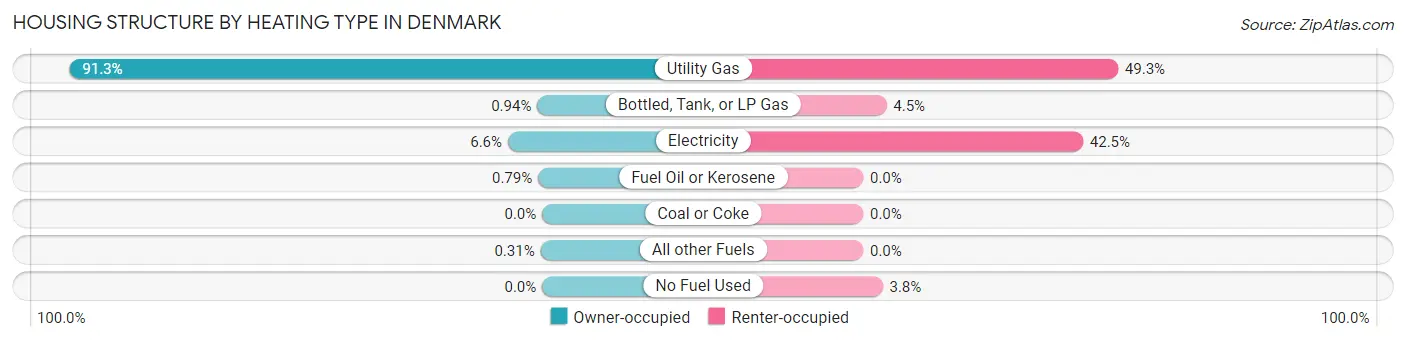
| Heating Type | Owner-occupied | Renter-occupied |
| Utility Gas | 580 (91.3%) | 131 (49.2%) |
| Bottled, Tank, or LP Gas | 6 (0.9%) | 12 (4.5%) |
| Electricity | 42 (6.6%) | 113 (42.5%) |
| Fuel Oil or Kerosene | 5 (0.8%) | 0 (0.0%) |
| Coal or Coke | 0 (0.0%) | 0 (0.0%) |
| All other Fuels | 2 (0.3%) | 0 (0.0%) |
| No Fuel Used | 0 (0.0%) | 10 (3.8%) |
| Total | 635 (100.0%) | 266 (100.0%) |
Household Vehicle Usage in Denmark
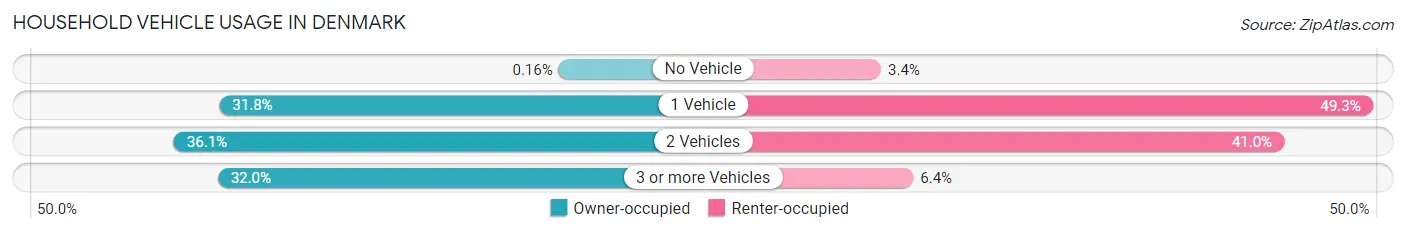
| Vehicles per Household | Owner-occupied | Renter-occupied |
| No Vehicle | 1 (0.2%) | 9 (3.4%) |
| 1 Vehicle | 202 (31.8%) | 131 (49.2%) |
| 2 Vehicles | 229 (36.1%) | 109 (41.0%) |
| 3 or more Vehicles | 203 (32.0%) | 17 (6.4%) |
| Total | 635 (100.0%) | 266 (100.0%) |
Real Estate & Mortgages in Denmark
Real Estate and Mortgage Overview in Denmark
| Characteristic | Without Mortgage | With Mortgage |
| Housing Units | 199 | 436 |
| Median Property Value | $159,200 | $165,100 |
| Median Household Income | $30,250 | $122 |
| Monthly Housing Costs | $497 | $6 |
| Real Estate Taxes | $2,586 | $6 |
Property Value by Mortgage Status in Denmark
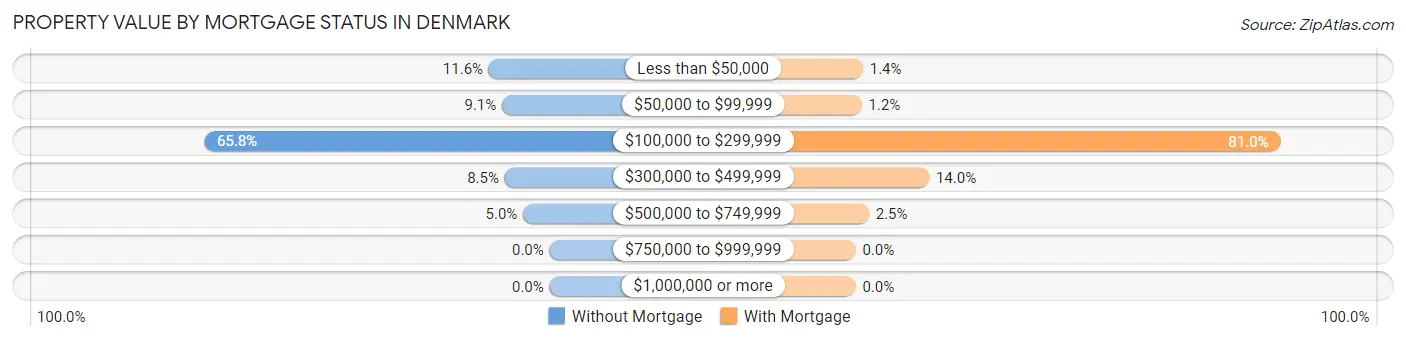
| Property Value | Without Mortgage | With Mortgage |
| Less than $50,000 | 23 (11.6%) | 6 (1.4%) |
| $50,000 to $99,999 | 18 (9.0%) | 5 (1.1%) |
| $100,000 to $299,999 | 131 (65.8%) | 353 (81.0%) |
| $300,000 to $499,999 | 17 (8.5%) | 61 (14.0%) |
| $500,000 to $749,999 | 10 (5.0%) | 11 (2.5%) |
| $750,000 to $999,999 | 0 (0.0%) | 0 (0.0%) |
| $1,000,000 or more | 0 (0.0%) | 0 (0.0%) |
| Total | 199 (100.0%) | 436 (100.0%) |
Household Income by Mortgage Status in Denmark
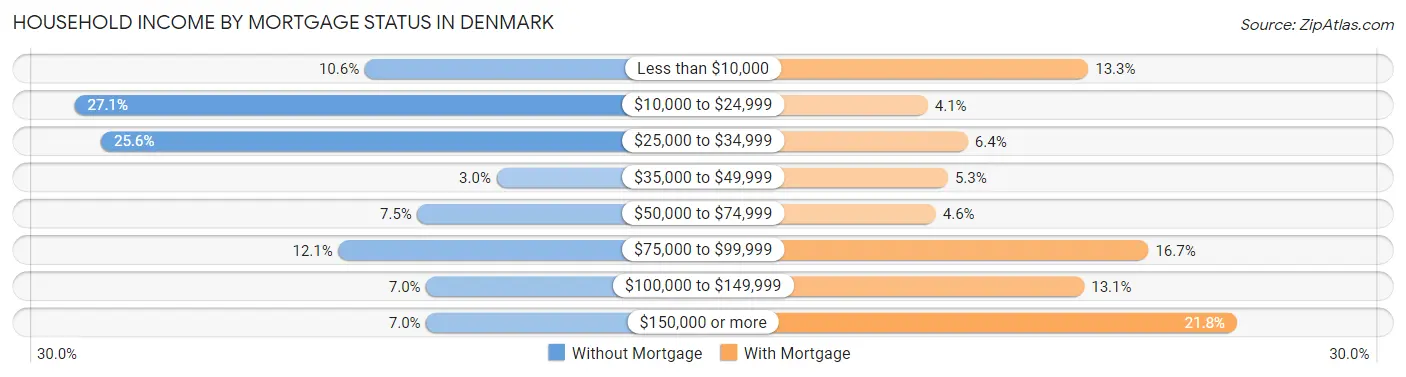
| Household Income | Without Mortgage | With Mortgage |
| Less than $10,000 | 21 (10.5%) | 58 (13.3%) |
| $10,000 to $24,999 | 54 (27.1%) | 18 (4.1%) |
| $25,000 to $34,999 | 51 (25.6%) | 28 (6.4%) |
| $35,000 to $49,999 | 6 (3.0%) | 23 (5.3%) |
| $50,000 to $74,999 | 15 (7.5%) | 20 (4.6%) |
| $75,000 to $99,999 | 24 (12.1%) | 73 (16.7%) |
| $100,000 to $149,999 | 14 (7.0%) | 57 (13.1%) |
| $150,000 or more | 14 (7.0%) | 95 (21.8%) |
| Total | 199 (100.0%) | 436 (100.0%) |
Property Value to Household Income Ratio in Denmark
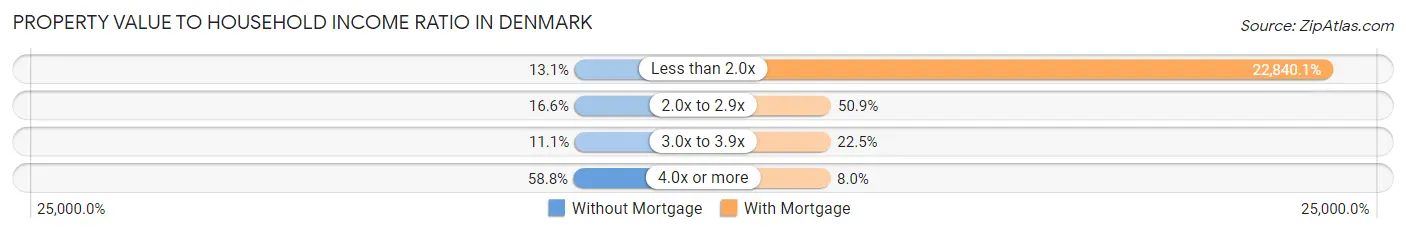
| Value-to-Income Ratio | Without Mortgage | With Mortgage |
| Less than 2.0x | 26 (13.1%) | 99,583 (22,840.1%) |
| 2.0x to 2.9x | 33 (16.6%) | 222 (50.9%) |
| 3.0x to 3.9x | 22 (11.1%) | 98 (22.5%) |
| 4.0x or more | 117 (58.8%) | 35 (8.0%) |
| Total | 199 (100.0%) | 436 (100.0%) |
Real Estate Taxes by Mortgage Status in Denmark
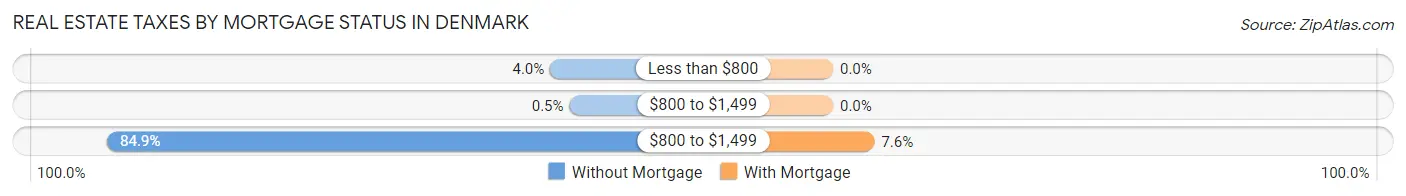
| Property Taxes | Without Mortgage | With Mortgage |
| Less than $800 | 8 (4.0%) | 0 (0.0%) |
| $800 to $1,499 | 1 (0.5%) | 0 (0.0%) |
| $800 to $1,499 | 169 (84.9%) | 33 (7.6%) |
| Total | 199 (100.0%) | 436 (100.0%) |
Health & Disability in Denmark
Health Insurance Coverage by Age in Denmark
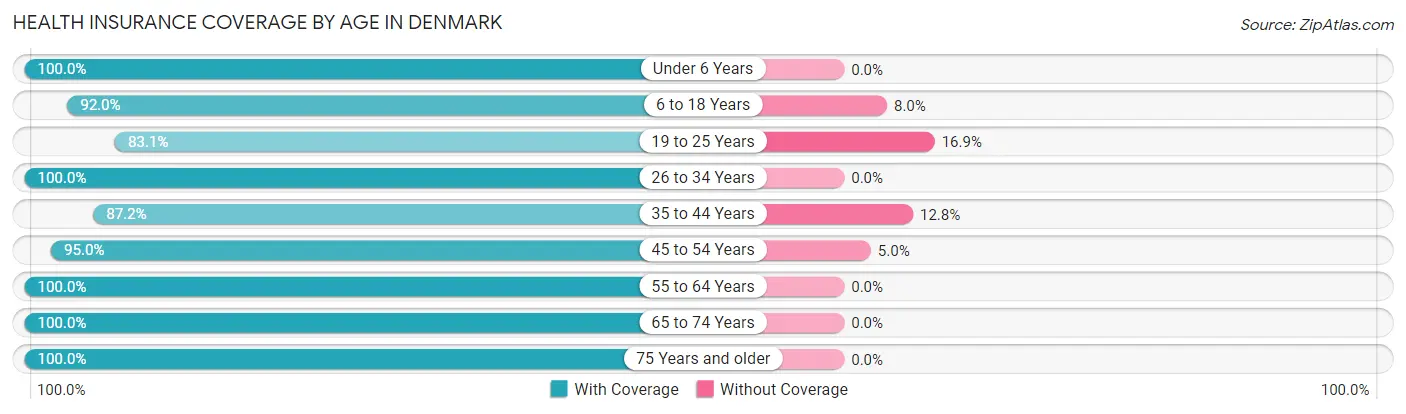
| Age Bracket | With Coverage | Without Coverage |
| Under 6 Years | 228 (100.0%) | 0 (0.0%) |
| 6 to 18 Years | 404 (92.0%) | 35 (8.0%) |
| 19 to 25 Years | 212 (83.1%) | 43 (16.9%) |
| 26 to 34 Years | 297 (100.0%) | 0 (0.0%) |
| 35 to 44 Years | 238 (87.2%) | 35 (12.8%) |
| 45 to 54 Years | 364 (95.0%) | 19 (5.0%) |
| 55 to 64 Years | 191 (100.0%) | 0 (0.0%) |
| 65 to 74 Years | 213 (100.0%) | 0 (0.0%) |
| 75 Years and older | 115 (100.0%) | 0 (0.0%) |
| Total | 2,262 (94.5%) | 132 (5.5%) |
Health Insurance Coverage by Citizenship Status in Denmark
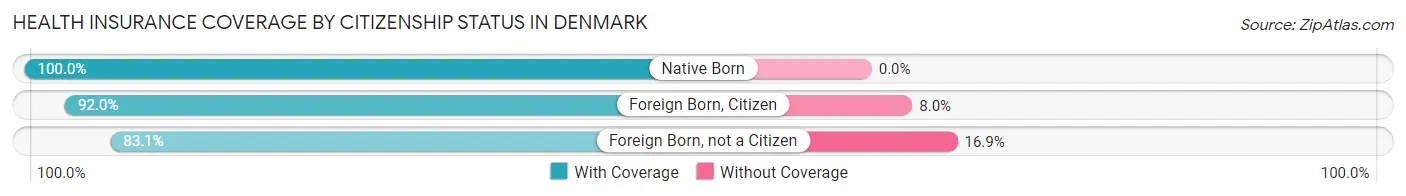
| Citizenship Status | With Coverage | Without Coverage |
| Native Born | 228 (100.0%) | 0 (0.0%) |
| Foreign Born, Citizen | 404 (92.0%) | 35 (8.0%) |
| Foreign Born, not a Citizen | 212 (83.1%) | 43 (16.9%) |
Health Insurance Coverage by Household Income in Denmark
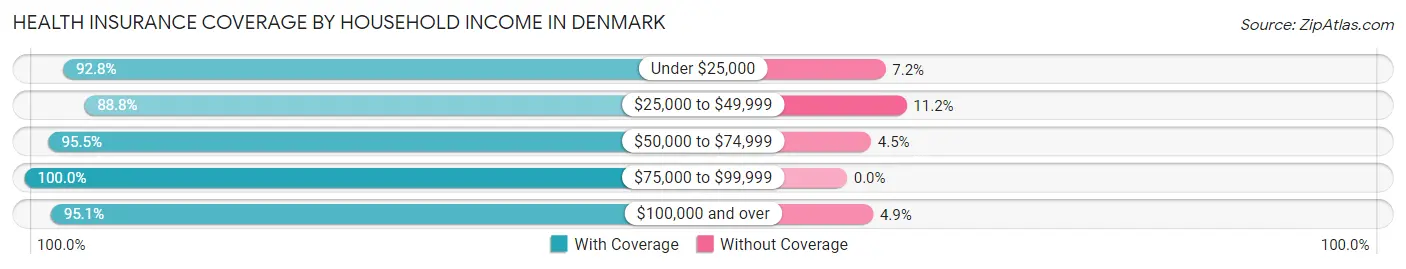
| Household Income | With Coverage | Without Coverage |
| Under $25,000 | 257 (92.8%) | 20 (7.2%) |
| $25,000 to $49,999 | 342 (88.8%) | 43 (11.2%) |
| $50,000 to $74,999 | 339 (95.5%) | 16 (4.5%) |
| $75,000 to $99,999 | 297 (100.0%) | 0 (0.0%) |
| $100,000 and over | 1,027 (95.1%) | 53 (4.9%) |
Public vs Private Health Insurance Coverage by Age in Denmark
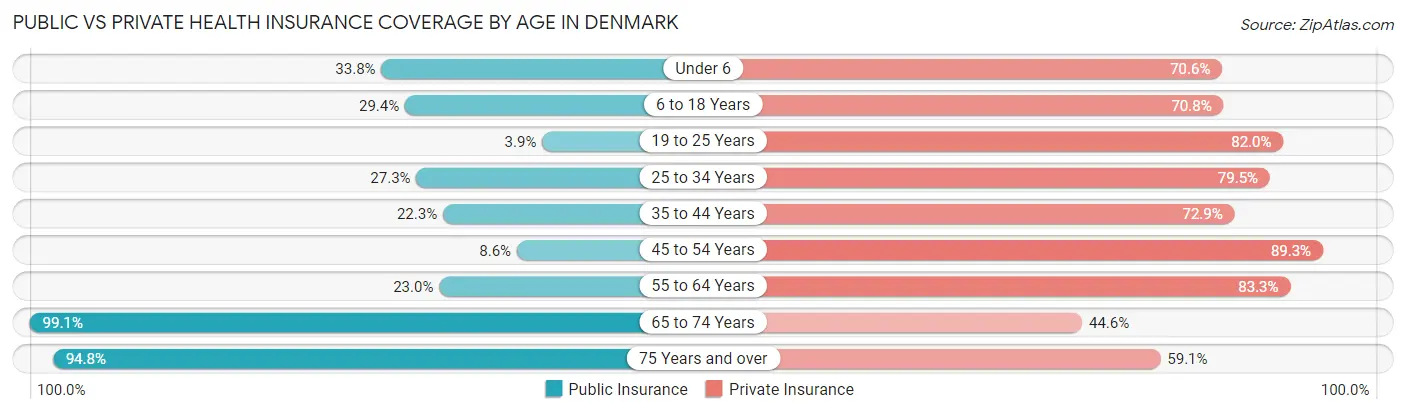
| Age Bracket | Public Insurance | Private Insurance |
| Under 6 | 77 (33.8%) | 161 (70.6%) |
| 6 to 18 Years | 129 (29.4%) | 311 (70.8%) |
| 19 to 25 Years | 10 (3.9%) | 209 (82.0%) |
| 25 to 34 Years | 81 (27.3%) | 236 (79.5%) |
| 35 to 44 Years | 61 (22.3%) | 199 (72.9%) |
| 45 to 54 Years | 33 (8.6%) | 342 (89.3%) |
| 55 to 64 Years | 44 (23.0%) | 159 (83.3%) |
| 65 to 74 Years | 211 (99.1%) | 95 (44.6%) |
| 75 Years and over | 109 (94.8%) | 68 (59.1%) |
| Total | 755 (31.5%) | 1,780 (74.4%) |
Disability Status by Sex by Age in Denmark
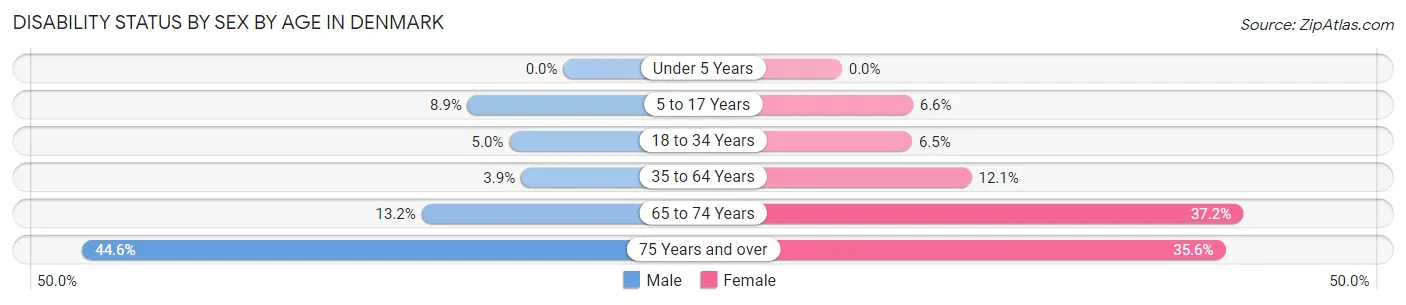
| Age Bracket | Male | Female |
| Under 5 Years | 0 (0.0%) | 0 (0.0%) |
| 5 to 17 Years | 27 (8.9%) | 11 (6.6%) |
| 18 to 34 Years | 16 (5.0%) | 17 (6.5%) |
| 35 to 64 Years | 16 (3.9%) | 53 (12.0%) |
| 65 to 74 Years | 10 (13.2%) | 51 (37.2%) |
| 75 Years and over | 25 (44.6%) | 21 (35.6%) |
Disability Class by Sex by Age in Denmark
Disability Class: Hearing Difficulty
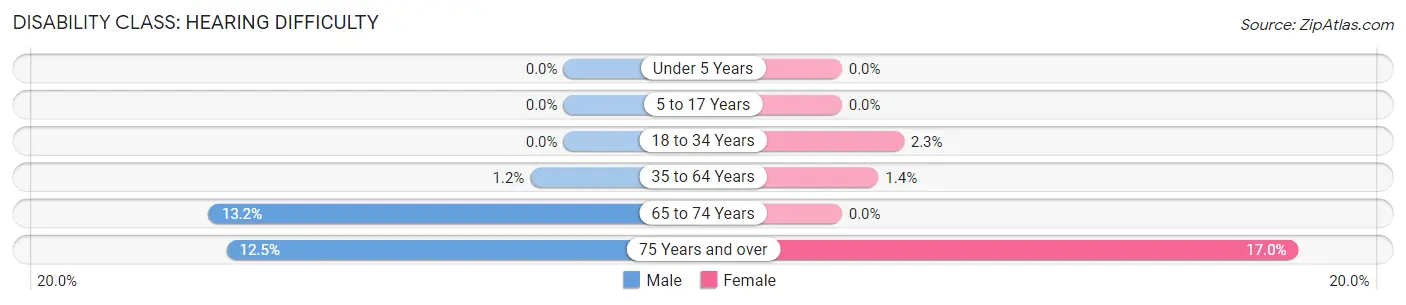
| Age Bracket | Male | Female |
| Under 5 Years | 0 (0.0%) | 0 (0.0%) |
| 5 to 17 Years | 0 (0.0%) | 0 (0.0%) |
| 18 to 34 Years | 0 (0.0%) | 6 (2.3%) |
| 35 to 64 Years | 5 (1.2%) | 6 (1.4%) |
| 65 to 74 Years | 10 (13.2%) | 0 (0.0%) |
| 75 Years and over | 7 (12.5%) | 10 (17.0%) |
Disability Class: Vision Difficulty
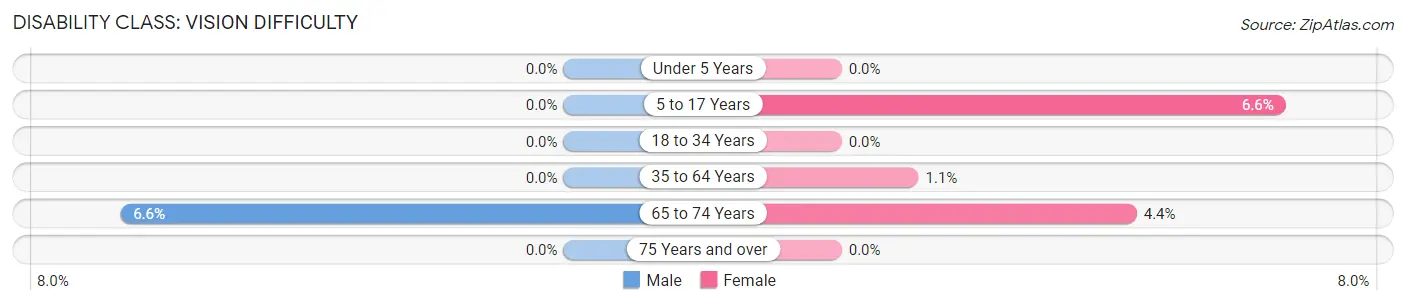
| Age Bracket | Male | Female |
| Under 5 Years | 0 (0.0%) | 0 (0.0%) |
| 5 to 17 Years | 0 (0.0%) | 11 (6.6%) |
| 18 to 34 Years | 0 (0.0%) | 0 (0.0%) |
| 35 to 64 Years | 0 (0.0%) | 5 (1.1%) |
| 65 to 74 Years | 5 (6.6%) | 6 (4.4%) |
| 75 Years and over | 0 (0.0%) | 0 (0.0%) |
Disability Class: Cognitive Difficulty
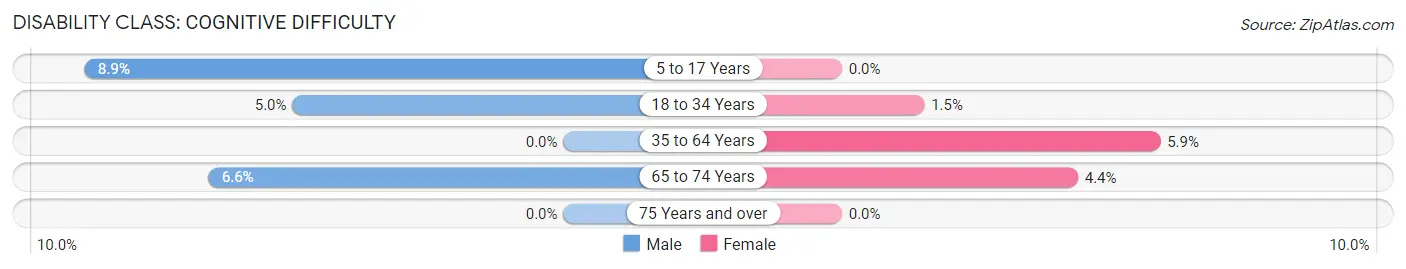
| Age Bracket | Male | Female |
| 5 to 17 Years | 27 (8.9%) | 0 (0.0%) |
| 18 to 34 Years | 16 (5.0%) | 4 (1.5%) |
| 35 to 64 Years | 0 (0.0%) | 26 (5.9%) |
| 65 to 74 Years | 5 (6.6%) | 6 (4.4%) |
| 75 Years and over | 0 (0.0%) | 0 (0.0%) |
Disability Class: Ambulatory Difficulty
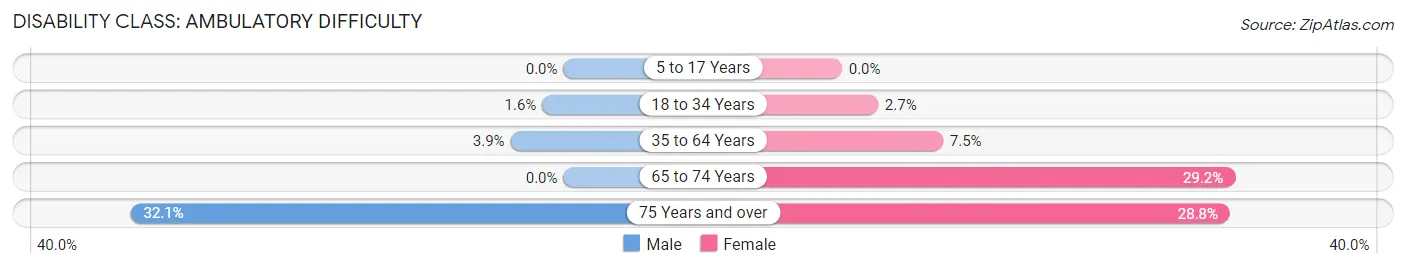
| Age Bracket | Male | Female |
| 5 to 17 Years | 0 (0.0%) | 0 (0.0%) |
| 18 to 34 Years | 5 (1.6%) | 7 (2.7%) |
| 35 to 64 Years | 16 (3.9%) | 33 (7.5%) |
| 65 to 74 Years | 0 (0.0%) | 40 (29.2%) |
| 75 Years and over | 18 (32.1%) | 17 (28.8%) |
Disability Class: Self-Care Difficulty
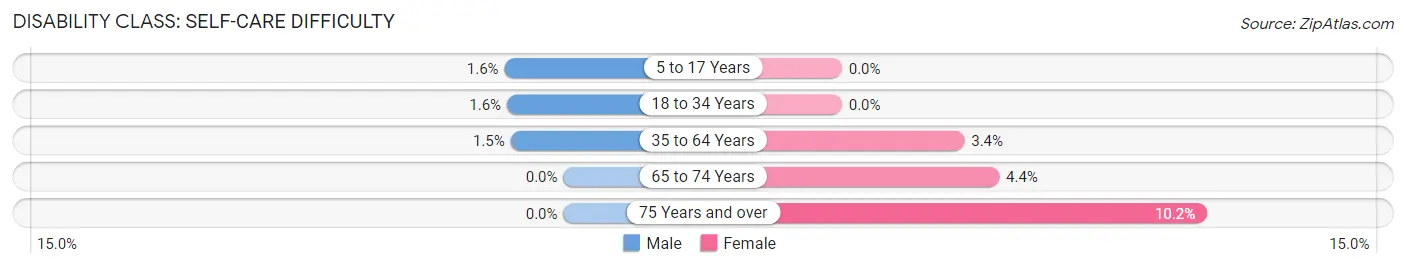
| Age Bracket | Male | Female |
| 5 to 17 Years | 5 (1.6%) | 0 (0.0%) |
| 18 to 34 Years | 5 (1.6%) | 0 (0.0%) |
| 35 to 64 Years | 6 (1.5%) | 15 (3.4%) |
| 65 to 74 Years | 0 (0.0%) | 6 (4.4%) |
| 75 Years and over | 0 (0.0%) | 6 (10.2%) |
Technology Access in Denmark
Computing Device Access in Denmark
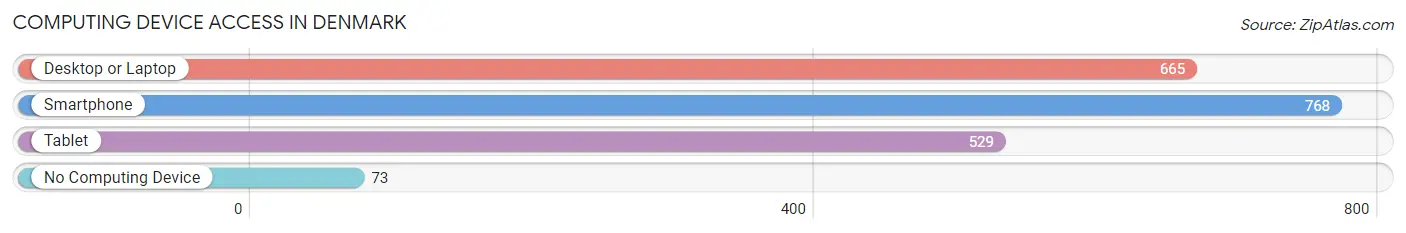
| Device Type | # Households | % Households |
| Desktop or Laptop | 665 | 73.8% |
| Smartphone | 768 | 85.2% |
| Tablet | 529 | 58.7% |
| No Computing Device | 73 | 8.1% |
| Total | 901 | 100.0% |
Internet Access in Denmark
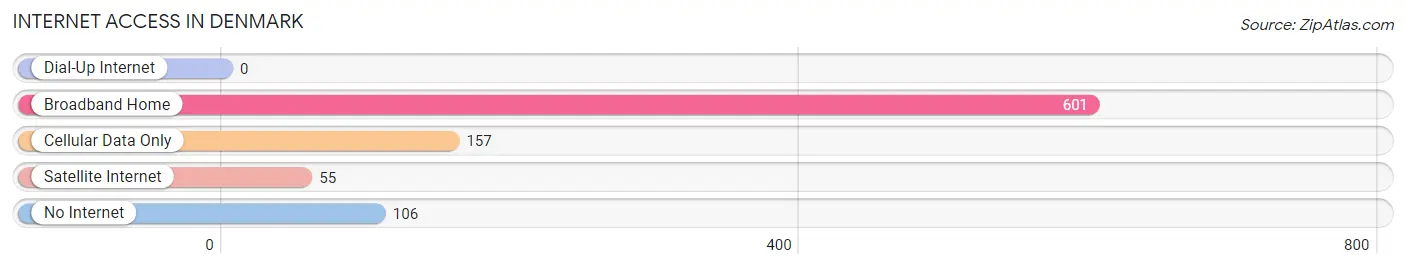
| Internet Type | # Households | % Households |
| Dial-Up Internet | 0 | 0.0% |
| Broadband Home | 601 | 66.7% |
| Cellular Data Only | 157 | 17.4% |
| Satellite Internet | 55 | 6.1% |
| No Internet | 106 | 11.8% |
| Total | 901 | 100.0% |
Denmark Summary
Denmark, Wisconsin is a small town located in the northeastern corner of the state, in Brown County. It is situated on the banks of the East Twin River, and is surrounded by rolling hills and lush forests. The town has a population of just over 2,000 people, and is known for its small-town charm and friendly atmosphere.
History
Denmark was first settled in 1848 by a group of German immigrants. The town was named after the country of Denmark, and the settlers were attracted to the area due to its abundance of natural resources. The town quickly grew, and by the late 1800s, it had become a thriving community.
In the early 1900s, Denmark was a major producer of lumber, and the town was home to several sawmills. The town also had a thriving dairy industry, and was home to several cheese factories. The town was also home to a number of small businesses, including a blacksmith, a general store, and a hotel.
Geography
Denmark is located in the northeastern corner of Wisconsin, in Brown County. The town is situated on the banks of the East Twin River, and is surrounded by rolling hills and lush forests. The town is located approximately 25 miles north of Green Bay, and is about an hour and a half drive from Milwaukee.
The town has a total area of 2.2 square miles, and has a population density of 945 people per square mile. The town is located at an elevation of 845 feet above sea level.
Economy
Denmark’s economy is largely based on agriculture and tourism. The town is home to several dairy farms, and is also home to a number of small businesses, including restaurants, shops, and a hotel. The town is also home to a number of manufacturing companies, including a paper mill and a furniture factory.
The town is also home to a number of recreational activities, including fishing, hunting, and camping. The town is also home to a number of festivals and events, including the Denmark Days Festival, which is held every summer.
Demographics
As of the 2010 census, the population of Denmark was 2,068. The town has a population density of 945 people per square mile. The median age of the population is 43.7 years, and the median household income is $50,945.
The town is predominantly white, with 92.3% of the population identifying as white. The town also has a small Hispanic population, with 4.2% of the population identifying as Hispanic or Latino. The town also has a small African American population, with 1.2% of the population identifying as African American.
The town is also home to a number of religious denominations, including Lutheran, Catholic, and Methodist. The town is also home to a number of churches, including the Denmark Lutheran Church, the Denmark Methodist Church, and the Denmark Catholic Church.
Common Questions
What is Per Capita Income in Denmark?
Per Capita income in Denmark is $32,928.
What is the Median Family Income in Denmark?
Median Family Income in Denmark is $94,150.
What is the Median Household income in Denmark?
Median Household Income in Denmark is $71,750.
What is Income or Wage Gap in Denmark?
Income or Wage Gap in Denmark is 22.5%.
Women in Denmark earn 77.5 cents for every dollar earned by a man.
What is Inequality or Gini Index in Denmark?
Inequality or Gini Index in Denmark is 0.45.
What is the Total Population of Denmark?
Total Population of Denmark is 2,400.
What is the Total Male Population of Denmark?
Total Male Population of Denmark is 1,261.
What is the Total Female Population of Denmark?
Total Female Population of Denmark is 1,139.
What is the Ratio of Males per 100 Females in Denmark?
There are 110.71 Males per 100 Females in Denmark.
What is the Ratio of Females per 100 Males in Denmark?
There are 90.33 Females per 100 Males in Denmark.
What is the Median Population Age in Denmark?
Median Population Age in Denmark is 34.6 Years.
What is the Average Family Size in Denmark
Average Family Size in Denmark is 3.5 People.
What is the Average Household Size in Denmark
Average Household Size in Denmark is 2.7 People.
How Large is the Labor Force in Denmark?
There are 1,402 People in the Labor Forcein in Denmark.
What is the Percentage of People in the Labor Force in Denmark?
75.2% of People are in the Labor Force in Denmark.
What is the Unemployment Rate in Denmark?
Unemployment Rate in Denmark is 1.7%.