Chenequa, WI Map & Demographics
Chenequa Map
Chenequa Overview
$477,831
PER CAPITA INCOME
$250,001
AVG FAMILY INCOME
$177,500
AVG HOUSEHOLD INCOME
71.9%
WAGE / INCOME GAP [ % ]
28.1¢/ $1
WAGE / INCOME GAP [ $ ]
0.55
INEQUALITY / GINI INDEX
783
TOTAL POPULATION
298
MALE POPULATION
485
FEMALE POPULATION
61.44
MALES / 100 FEMALES
162.75
FEMALES / 100 MALES
58.4
MEDIAN AGE
3.7
AVG FAMILY SIZE
3.2
AVG HOUSEHOLD SIZE
275
LABOR FORCE [ PEOPLE ]
40.0%
PERCENT IN LABOR FORCE
1.1%
UNEMPLOYMENT RATE
Income in Chenequa
Income Overview in Chenequa
Per Capita Income in Chenequa is $477,831, while median incomes of families and households are $250,001 and $177,500 respectively.
| Characteristic | Number | Measure |
| Per Capita Income | 783 | $477,831 |
| Median Family Income | 195 | $250,001 |
| Mean Family Income | 195 | $463,774 |
| Median Household Income | 242 | $177,500 |
| Mean Household Income | 242 | $397,324 |
| Income Deficit | 195 | $0 |
| Wage / Income Gap (%) | 783 | 71.85% |
| Wage / Income Gap ($) | 783 | 28.15¢ per $1 |
| Gini / Inequality Index | 783 | 0.55 |
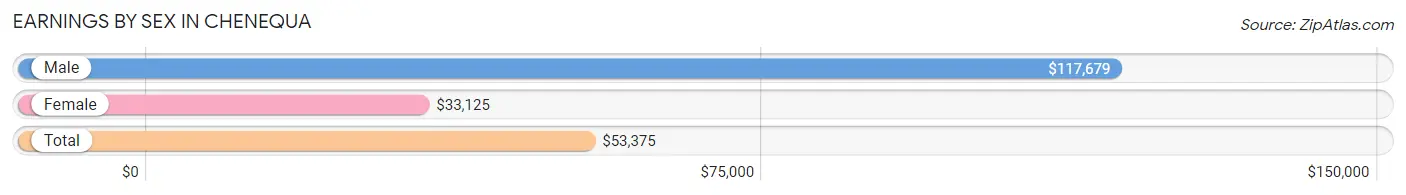
Earnings by Sex in Chenequa
Average Earnings in Chenequa are $53,375, $117,679 for men and $33,125 for women, a difference of 71.9%.
| Sex | Number | Average Earnings |
| Male | 185 (60.3%) | $117,679 |
| Female | 122 (39.7%) | $33,125 |
| Total | 307 (100.0%) | $53,375 |
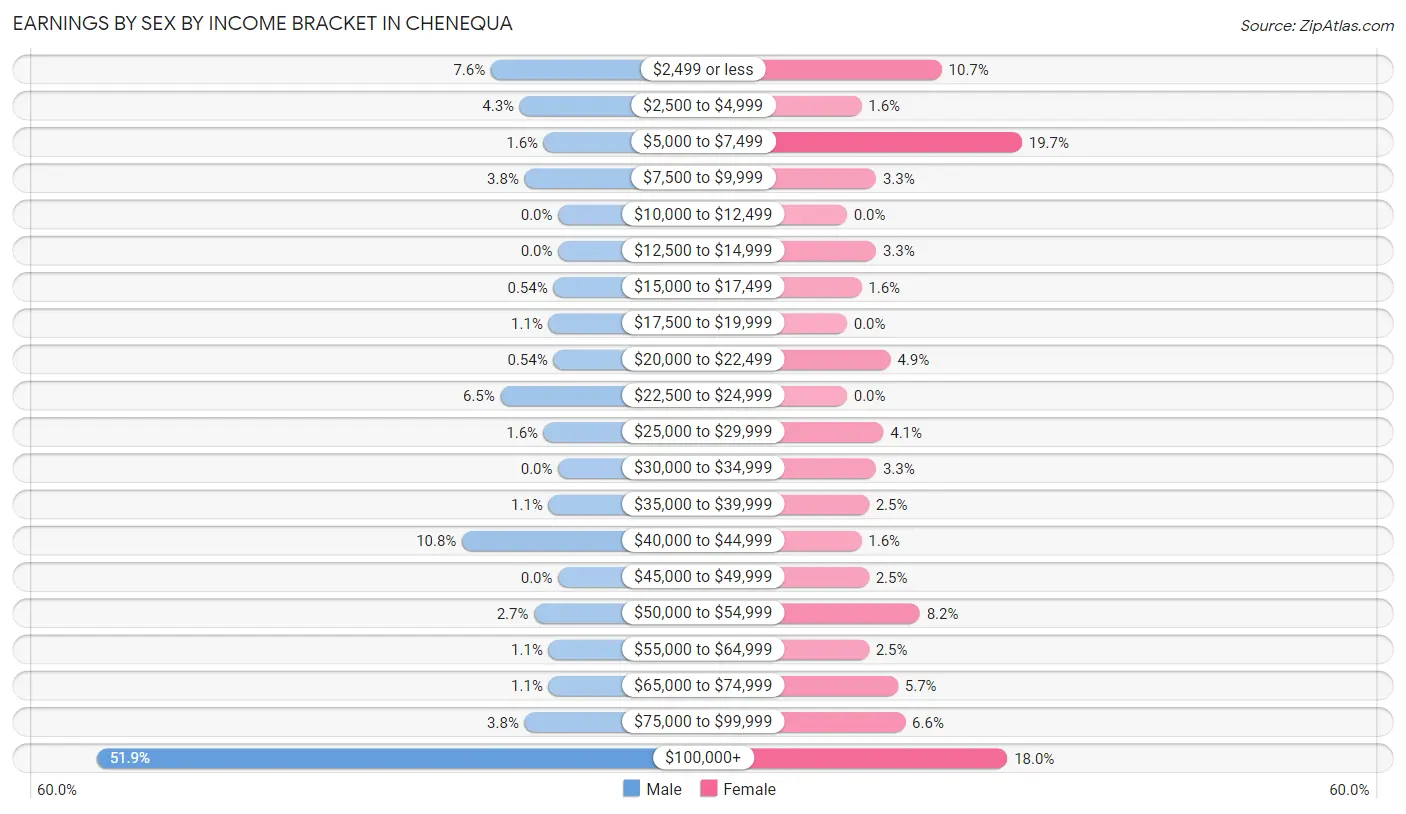
Earnings by Sex by Income Bracket in Chenequa
The most common earnings brackets in Chenequa are $100,000+ for men (96 | 51.9%) and $5,000 to $7,499 for women (24 | 19.7%).
| Income | Male | Female |
| $2,499 or less | 14 (7.6%) | 13 (10.7%) |
| $2,500 to $4,999 | 8 (4.3%) | 2 (1.6%) |
| $5,000 to $7,499 | 3 (1.6%) | 24 (19.7%) |
| $7,500 to $9,999 | 7 (3.8%) | 4 (3.3%) |
| $10,000 to $12,499 | 0 (0.0%) | 0 (0.0%) |
| $12,500 to $14,999 | 0 (0.0%) | 4 (3.3%) |
| $15,000 to $17,499 | 1 (0.5%) | 2 (1.6%) |
| $17,500 to $19,999 | 2 (1.1%) | 0 (0.0%) |
| $20,000 to $22,499 | 1 (0.5%) | 6 (4.9%) |
| $22,500 to $24,999 | 12 (6.5%) | 0 (0.0%) |
| $25,000 to $29,999 | 3 (1.6%) | 5 (4.1%) |
| $30,000 to $34,999 | 0 (0.0%) | 4 (3.3%) |
| $35,000 to $39,999 | 2 (1.1%) | 3 (2.5%) |
| $40,000 to $44,999 | 20 (10.8%) | 2 (1.6%) |
| $45,000 to $49,999 | 0 (0.0%) | 3 (2.5%) |
| $50,000 to $54,999 | 5 (2.7%) | 10 (8.2%) |
| $55,000 to $64,999 | 2 (1.1%) | 3 (2.5%) |
| $65,000 to $74,999 | 2 (1.1%) | 7 (5.7%) |
| $75,000 to $99,999 | 7 (3.8%) | 8 (6.6%) |
| $100,000+ | 96 (51.9%) | 22 (18.0%) |
| Total | 185 (100.0%) | 122 (100.0%) |
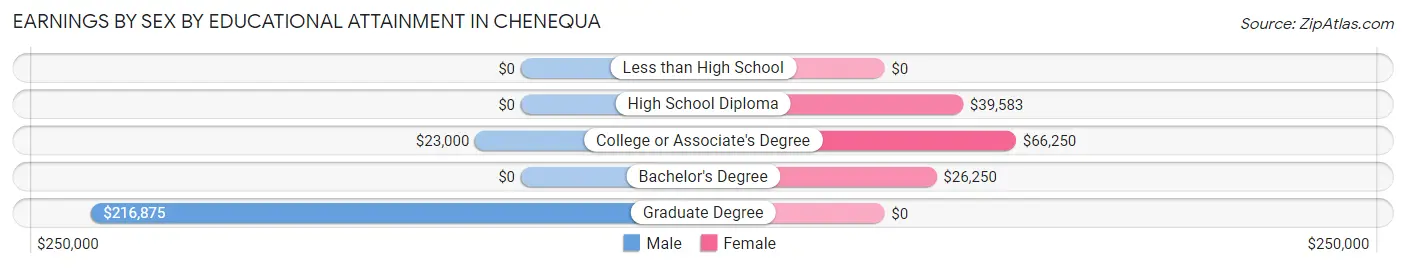
Earnings by Sex by Educational Attainment in Chenequa
Average earnings in Chenequa are $138,750 for men and $44,375 for women, a difference of 68.0%. Men with an educational attainment of graduate degree enjoy the highest average annual earnings of $216,875, while those with college or associate's degree education earn the least with $23,000. Women with an educational attainment of college or associate's degree earn the most with the average annual earnings of $66,250, while those with bachelor's degree education have the smallest earnings of $26,250.
| Educational Attainment | Male Income | Female Income |
| Less than High School | - | - |
| High School Diploma | - | - |
| College or Associate's Degree | $23,000 | $66,250 |
| Bachelor's Degree | - | - |
| Graduate Degree | $216,875 | $0 |
| Total | $138,750 | $44,375 |
Family Income in Chenequa
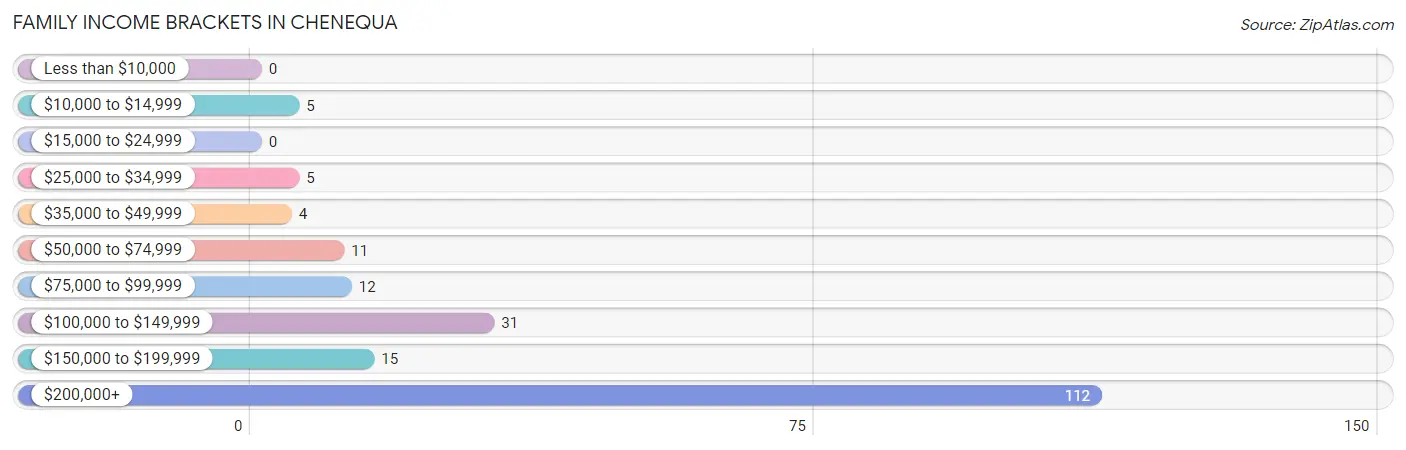
Family Income Brackets in Chenequa
According to the Chenequa family income data, there are 112 families falling into the $200,000+ income range, which is the most common income bracket and makes up 57.4% of all families.
| Income Bracket | # Families | % Families |
| Less than $10,000 | 0 | 0.0% |
| $10,000 to $14,999 | 5 | 2.6% |
| $15,000 to $24,999 | 0 | 0.0% |
| $25,000 to $34,999 | 5 | 2.6% |
| $35,000 to $49,999 | 4 | 2.1% |
| $50,000 to $74,999 | 11 | 5.6% |
| $75,000 to $99,999 | 12 | 6.2% |
| $100,000 to $149,999 | 31 | 15.9% |
| $150,000 to $199,999 | 15 | 7.7% |
| $200,000+ | 112 | 57.4% |
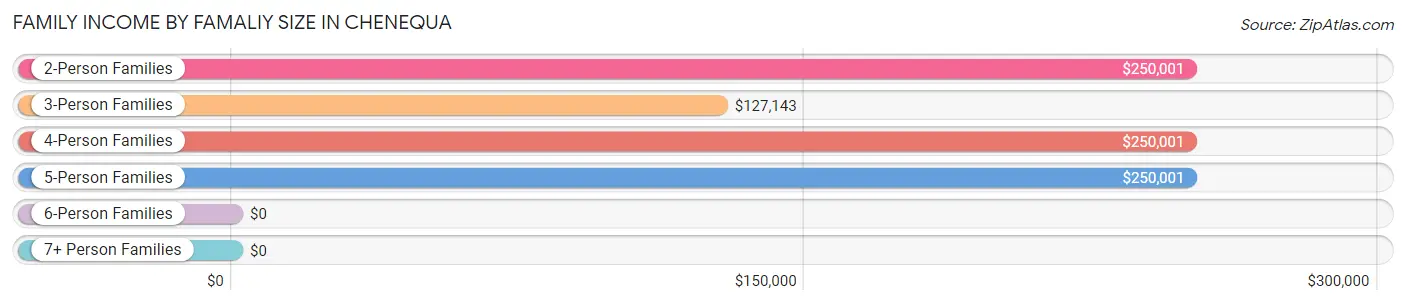
Family Income by Famaliy Size in Chenequa
2-person families (103 | 52.8%) account for the highest median family income in Chenequa with $250,001 per family, while 2-person families (103 | 52.8%) have the highest median income of $125,000 per family member.
| Income Bracket | # Families | Median Income |
| 2-Person Families | 103 (52.8%) | $250,001 |
| 3-Person Families | 44 (22.6%) | $127,143 |
| 4-Person Families | 36 (18.5%) | $250,001 |
| 5-Person Families | 9 (4.6%) | $250,001 |
| 6-Person Families | 3 (1.5%) | $0 |
| 7+ Person Families | 0 (0.0%) | $0 |
| Total | 195 (100.0%) | $250,001 |
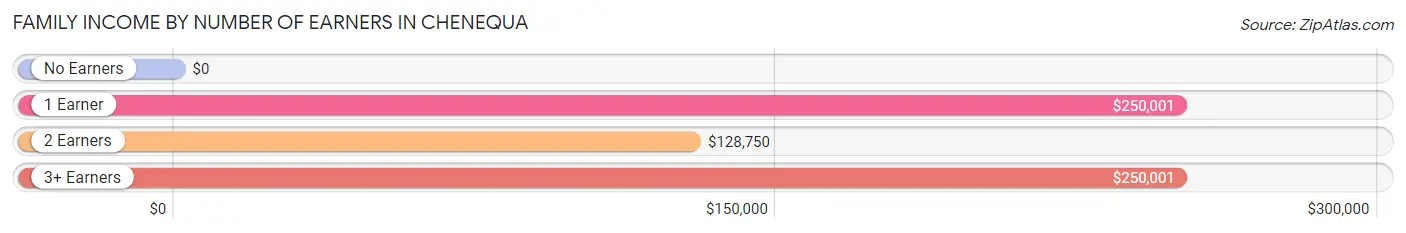
Family Income by Number of Earners in Chenequa
| Number of Earners | # Families | Median Income |
| No Earners | 29 (14.9%) | $0 |
| 1 Earner | 85 (43.6%) | $250,001 |
| 2 Earners | 66 (33.9%) | $128,750 |
| 3+ Earners | 15 (7.7%) | $250,001 |
| Total | 195 (100.0%) | $250,001 |
Household Income in Chenequa
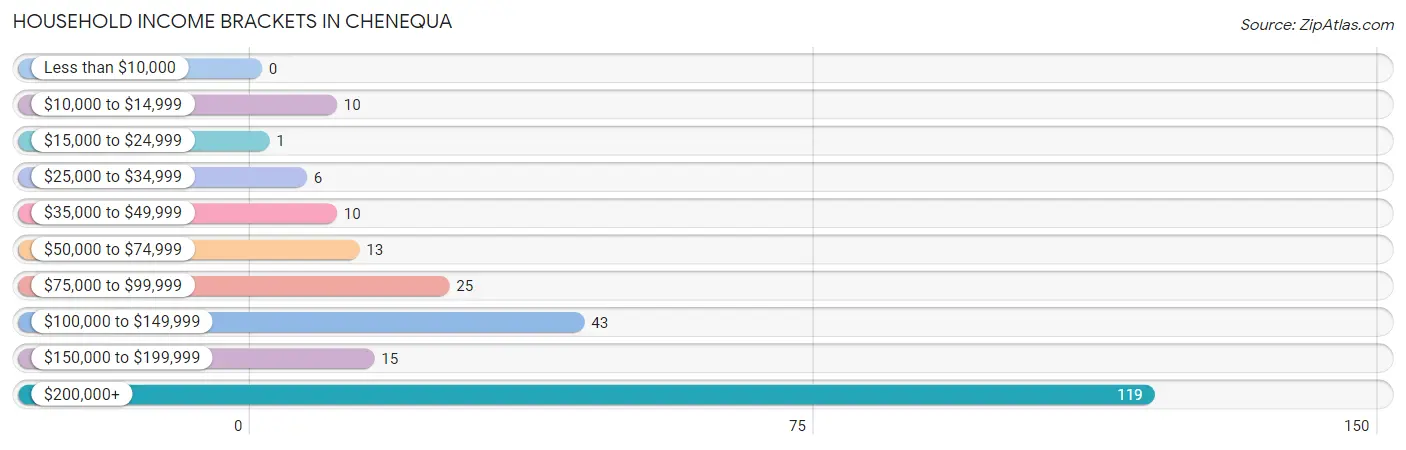
Household Income Brackets in Chenequa
With 119 households falling in the category, the $200,000+ income range is the most frequent in Chenequa, accounting for 49.2% of all households.
| Income Bracket | # Households | % Households |
| Less than $10,000 | 0 | 0.0% |
| $10,000 to $14,999 | 10 | 4.1% |
| $15,000 to $24,999 | 1 | 0.4% |
| $25,000 to $34,999 | 6 | 2.5% |
| $35,000 to $49,999 | 10 | 4.1% |
| $50,000 to $74,999 | 13 | 5.4% |
| $75,000 to $99,999 | 25 | 10.3% |
| $100,000 to $149,999 | 43 | 17.8% |
| $150,000 to $199,999 | 15 | 6.2% |
| $200,000+ | 119 | 49.2% |
Household Income by Householder Age in Chenequa
The median household income in Chenequa is $177,500, with the highest median household income of $250,001 found in the 25 to 44 years age bracket for the primary householder. A total of 38 households (15.7%) fall into this category.
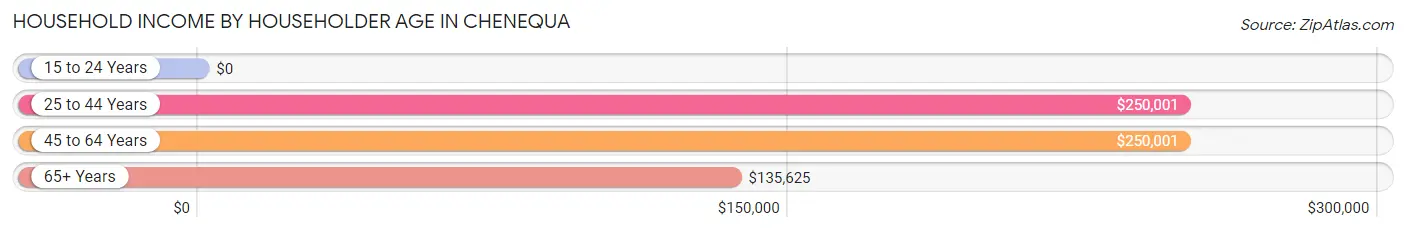
| Income Bracket | # Households | Median Income |
| 15 to 24 Years | 0 (0.0%) | $0 |
| 25 to 44 Years | 38 (15.7%) | $250,001 |
| 45 to 64 Years | 110 (45.5%) | $250,001 |
| 65+ Years | 94 (38.8%) | $135,625 |
| Total | 242 (100.0%) | $177,500 |
Poverty in Chenequa
Income Below Poverty by Sex and Age in Chenequa
With 2.4% poverty level for males and 2.5% for females among the residents of Chenequa, 18 to 24 year old males and 45 to 54 year old females are the most vulnerable to poverty, with 2 males (11.8%) and 7 females (13.7%) in their respective age groups living below the poverty level.
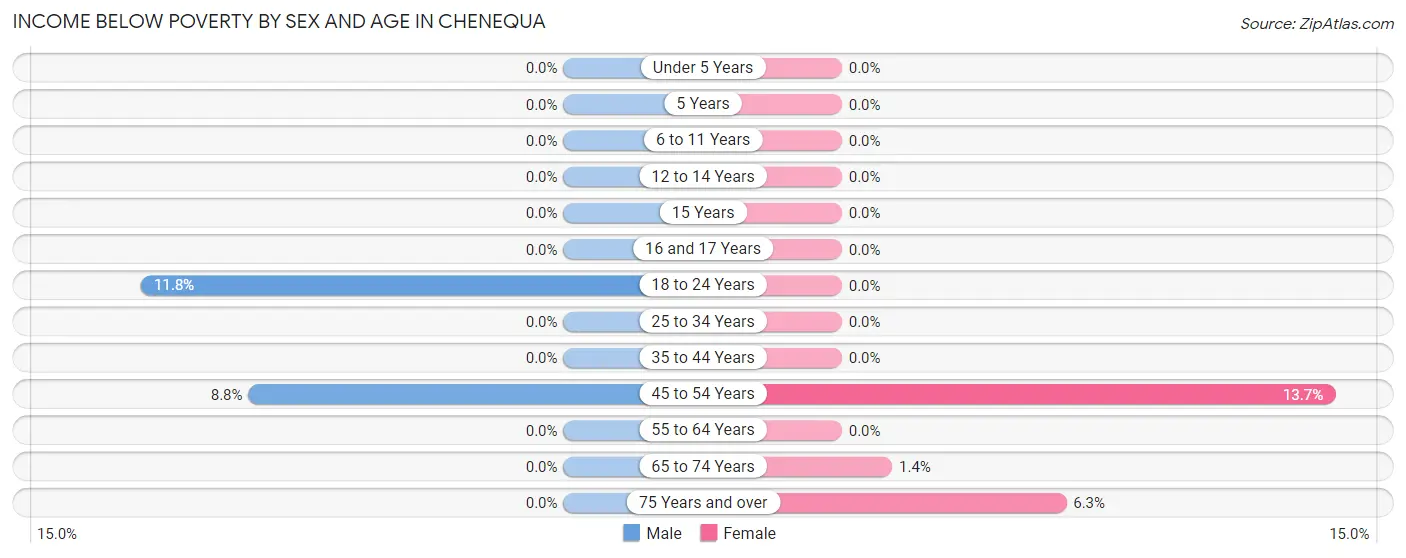
| Age Bracket | Male | Female |
| Under 5 Years | 0 (0.0%) | 0 (0.0%) |
| 5 Years | 0 (0.0%) | 0 (0.0%) |
| 6 to 11 Years | 0 (0.0%) | 0 (0.0%) |
| 12 to 14 Years | 0 (0.0%) | 0 (0.0%) |
| 15 Years | 0 (0.0%) | 0 (0.0%) |
| 16 and 17 Years | 0 (0.0%) | 0 (0.0%) |
| 18 to 24 Years | 2 (11.8%) | 0 (0.0%) |
| 25 to 34 Years | 0 (0.0%) | 0 (0.0%) |
| 35 to 44 Years | 0 (0.0%) | 0 (0.0%) |
| 45 to 54 Years | 5 (8.8%) | 7 (13.7%) |
| 55 to 64 Years | 0 (0.0%) | 0 (0.0%) |
| 65 to 74 Years | 0 (0.0%) | 3 (1.4%) |
| 75 Years and over | 0 (0.0%) | 2 (6.2%) |
| Total | 7 (2.4%) | 12 (2.5%) |
Income Above Poverty by Sex and Age in Chenequa
According to the poverty statistics in Chenequa, males aged under 5 years and females aged under 5 years are the age groups that are most secure financially, with 100.0% of males and 100.0% of females in these age groups living above the poverty line.
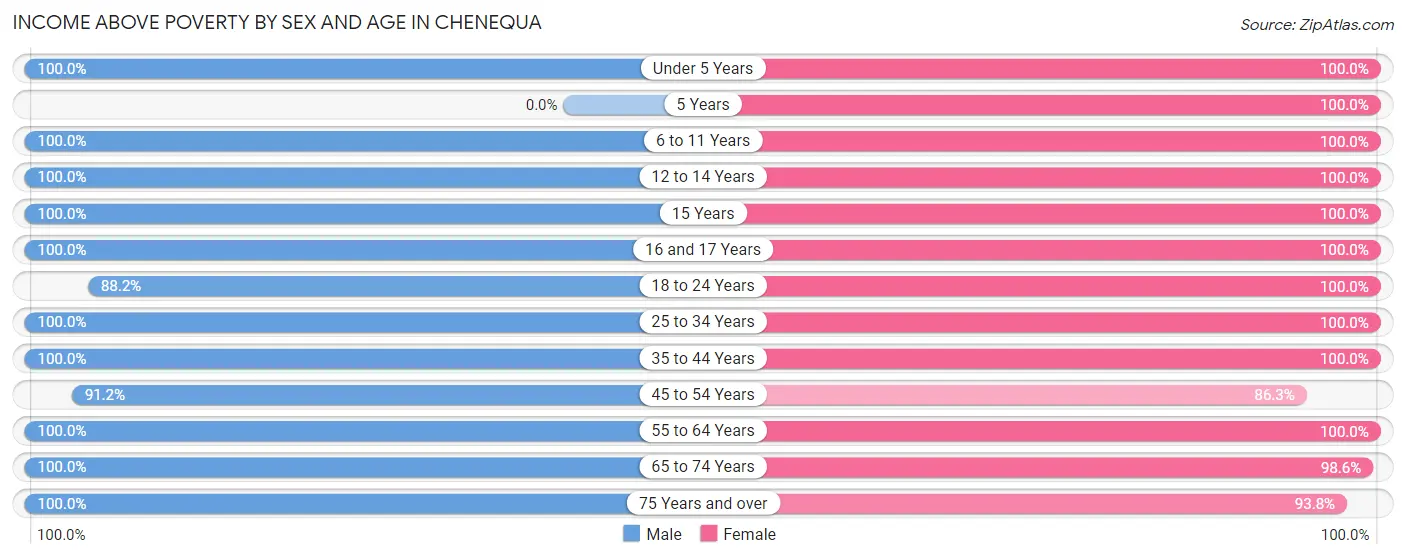
| Age Bracket | Male | Female |
| Under 5 Years | 11 (100.0%) | 11 (100.0%) |
| 5 Years | 0 (0.0%) | 3 (100.0%) |
| 6 to 11 Years | 10 (100.0%) | 28 (100.0%) |
| 12 to 14 Years | 13 (100.0%) | 10 (100.0%) |
| 15 Years | 4 (100.0%) | 6 (100.0%) |
| 16 and 17 Years | 16 (100.0%) | 4 (100.0%) |
| 18 to 24 Years | 15 (88.2%) | 15 (100.0%) |
| 25 to 34 Years | 8 (100.0%) | 16 (100.0%) |
| 35 to 44 Years | 31 (100.0%) | 38 (100.0%) |
| 45 to 54 Years | 52 (91.2%) | 44 (86.3%) |
| 55 to 64 Years | 53 (100.0%) | 57 (100.0%) |
| 65 to 74 Years | 55 (100.0%) | 211 (98.6%) |
| 75 Years and over | 23 (100.0%) | 30 (93.8%) |
| Total | 291 (97.7%) | 473 (97.5%) |
Income Below Poverty Among Married-Couple Families in Chenequa
The poverty statistics for married-couple families in Chenequa show that 2.8% or 5 of the total 178 families live below the poverty line. Families with no children have the highest poverty rate of 4.3%, comprising of 5 families. On the other hand, families with 1 or 2 children have the lowest poverty rate of 0.0%, which includes 0 families.
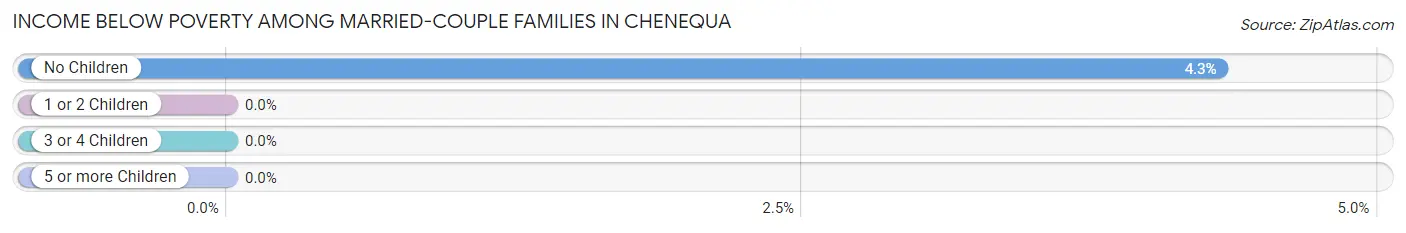
| Children | Above Poverty | Below Poverty |
| No Children | 111 (95.7%) | 5 (4.3%) |
| 1 or 2 Children | 53 (100.0%) | 0 (0.0%) |
| 3 or 4 Children | 9 (100.0%) | 0 (0.0%) |
| 5 or more Children | 0 (0.0%) | 0 (0.0%) |
| Total | 173 (97.2%) | 5 (2.8%) |
Income Below Poverty Among Single-Parent Households in Chenequa
| Children | Single Father | Single Mother |
| No Children | 0 (0.0%) | 0 (0.0%) |
| 1 or 2 Children | 0 (0.0%) | 0 (0.0%) |
| 3 or 4 Children | 0 (0.0%) | 0 (0.0%) |
| 5 or more Children | 0 (0.0%) | 0 (0.0%) |
| Total | 0 (0.0%) | 0 (0.0%) |
Income Below Poverty Among Married-Couple vs Single-Parent Households in Chenequa
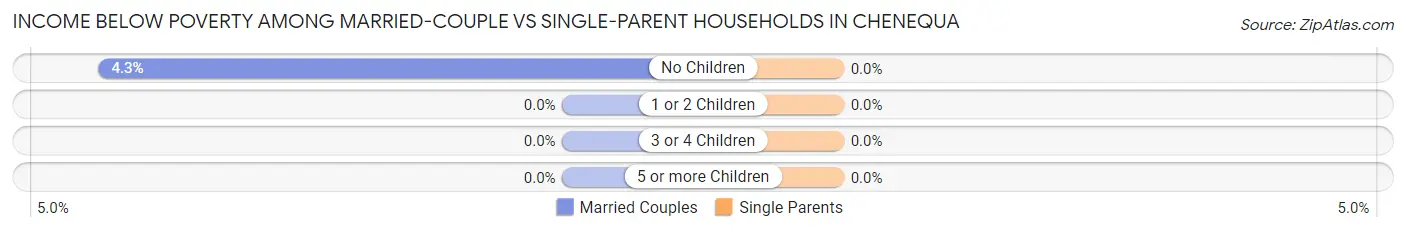
| Children | Married-Couple Families | Single-Parent Households |
| No Children | 5 (4.3%) | 0 (0.0%) |
| 1 or 2 Children | 0 (0.0%) | 0 (0.0%) |
| 3 or 4 Children | 0 (0.0%) | 0 (0.0%) |
| 5 or more Children | 0 (0.0%) | 0 (0.0%) |
| Total | 5 (2.8%) | 0 (0.0%) |
Race in Chenequa
The most populous races in Chenequa are White / Caucasian (729 | 93.1%), Two or more Races (36 | 4.6%), and Hispanic or Latino (20 | 2.5%).
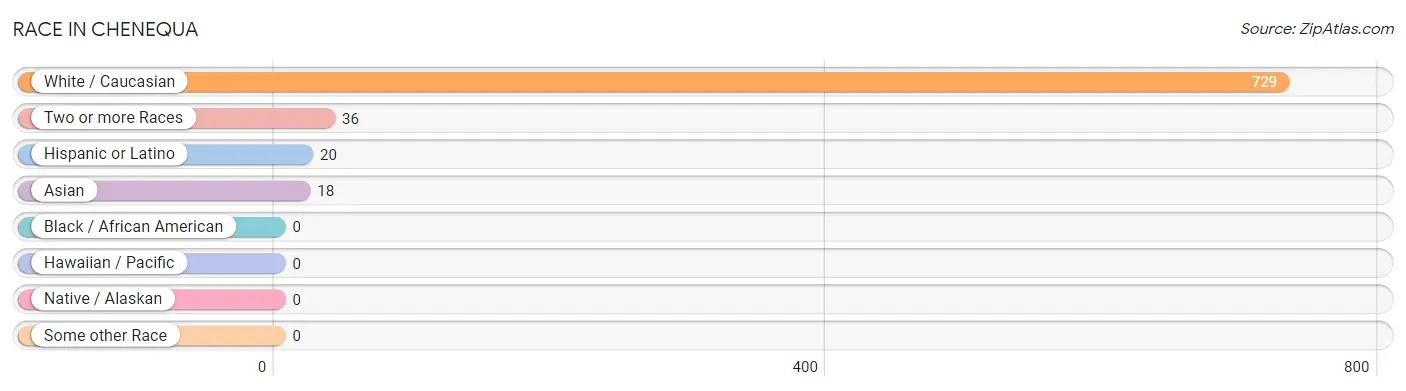
| Race | # Population | % Population |
| Asian | 18 | 2.3% |
| Black / African American | 0 | 0.0% |
| Hawaiian / Pacific | 0 | 0.0% |
| Hispanic or Latino | 20 | 2.5% |
| Native / Alaskan | 0 | 0.0% |
| White / Caucasian | 729 | 93.1% |
| Two or more Races | 36 | 4.6% |
| Some other Race | 0 | 0.0% |
| Total | 783 | 100.0% |
Ancestry in Chenequa
The most populous ancestries reported in Chenequa are Irish (290 | 37.0%), German (268 | 34.2%), English (93 | 11.9%), Norwegian (47 | 6.0%), and Italian (37 | 4.7%), together accounting for 93.9% of all Chenequa residents.
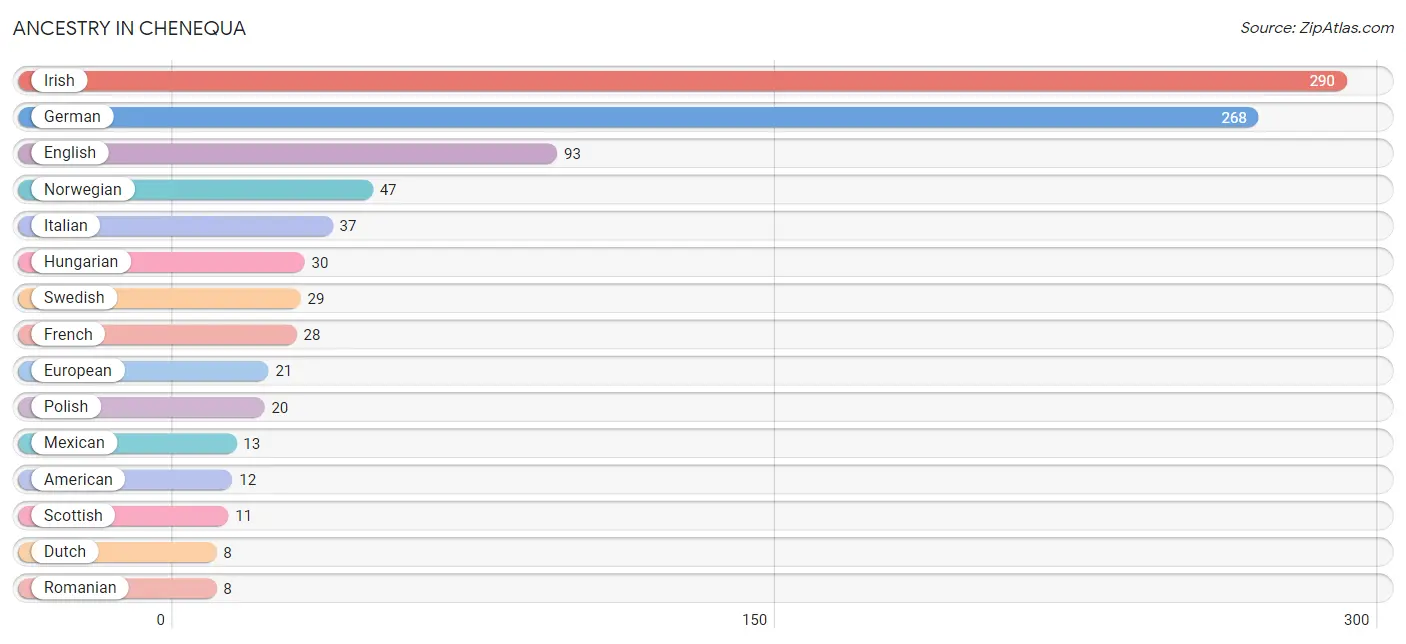
| Ancestry | # Population | % Population |
| American | 12 | 1.5% |
| Australian | 2 | 0.3% |
| Austrian | 5 | 0.6% |
| Cuban | 7 | 0.9% |
| Czech | 2 | 0.3% |
| Danish | 6 | 0.8% |
| Dutch | 8 | 1.0% |
| English | 93 | 11.9% |
| European | 21 | 2.7% |
| French | 28 | 3.6% |
| French Canadian | 7 | 0.9% |
| German | 268 | 34.2% |
| Hungarian | 30 | 3.8% |
| Indian (Asian) | 2 | 0.3% |
| Irish | 290 | 37.0% |
| Italian | 37 | 4.7% |
| Korean | 1 | 0.1% |
| Mexican | 13 | 1.7% |
| Northern European | 3 | 0.4% |
| Norwegian | 47 | 6.0% |
| Polish | 20 | 2.5% |
| Romanian | 8 | 1.0% |
| Russian | 2 | 0.3% |
| Scandinavian | 5 | 0.6% |
| Scotch-Irish | 1 | 0.1% |
| Scottish | 11 | 1.4% |
| Serbian | 7 | 0.9% |
| Slovene | 4 | 0.5% |
| Swedish | 29 | 3.7% |
| Swiss | 7 | 0.9% |
| Welsh | 8 | 1.0% | View All 31 Rows |
Immigrants in Chenequa
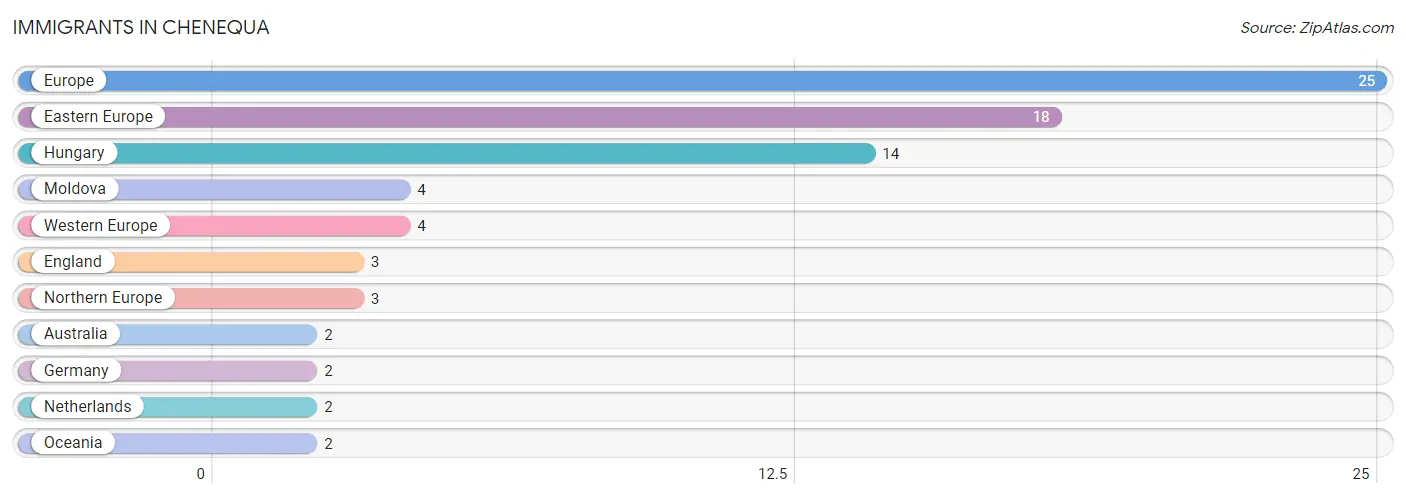
The most numerous immigrant groups reported in Chenequa came from Europe (25 | 3.2%), Eastern Europe (18 | 2.3%), Hungary (14 | 1.8%), Moldova (4 | 0.5%), and Western Europe (4 | 0.5%), together accounting for 8.3% of all Chenequa residents.
| Immigration Origin | # Population | % Population |
| Australia | 2 | 0.3% |
| Eastern Europe | 18 | 2.3% |
| England | 3 | 0.4% |
| Europe | 25 | 3.2% |
| Germany | 2 | 0.3% |
| Hungary | 14 | 1.8% |
| Moldova | 4 | 0.5% |
| Netherlands | 2 | 0.3% |
| Northern Europe | 3 | 0.4% |
| Oceania | 2 | 0.3% |
| Western Europe | 4 | 0.5% | View All 11 Rows |
Sex and Age in Chenequa
Sex and Age in Chenequa
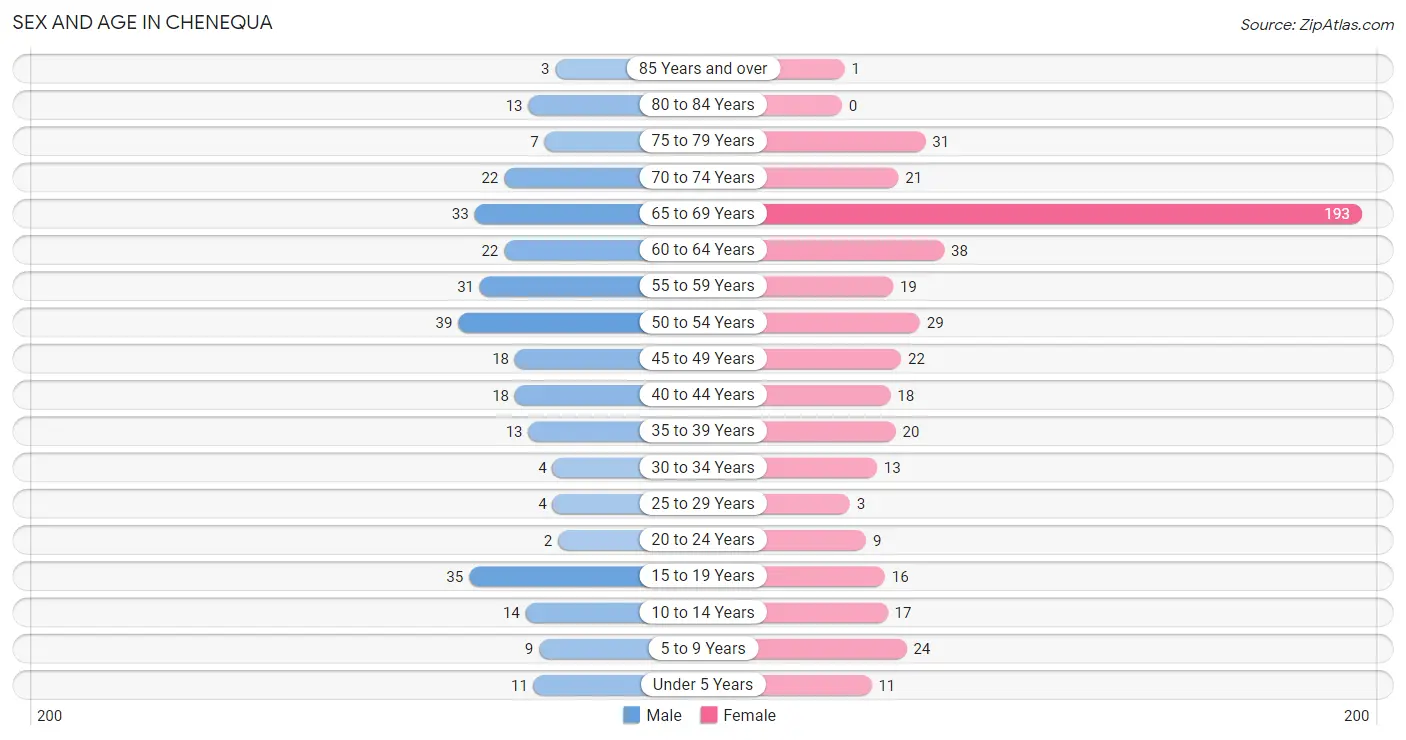
The most populous age groups in Chenequa are 50 to 54 Years (39 | 13.1%) for men and 65 to 69 Years (193 | 39.8%) for women.
| Age Bracket | Male | Female |
| Under 5 Years | 11 (3.7%) | 11 (2.3%) |
| 5 to 9 Years | 9 (3.0%) | 24 (5.0%) |
| 10 to 14 Years | 14 (4.7%) | 17 (3.5%) |
| 15 to 19 Years | 35 (11.7%) | 16 (3.3%) |
| 20 to 24 Years | 2 (0.7%) | 9 (1.9%) |
| 25 to 29 Years | 4 (1.3%) | 3 (0.6%) |
| 30 to 34 Years | 4 (1.3%) | 13 (2.7%) |
| 35 to 39 Years | 13 (4.4%) | 20 (4.1%) |
| 40 to 44 Years | 18 (6.0%) | 18 (3.7%) |
| 45 to 49 Years | 18 (6.0%) | 22 (4.5%) |
| 50 to 54 Years | 39 (13.1%) | 29 (6.0%) |
| 55 to 59 Years | 31 (10.4%) | 19 (3.9%) |
| 60 to 64 Years | 22 (7.4%) | 38 (7.8%) |
| 65 to 69 Years | 33 (11.1%) | 193 (39.8%) |
| 70 to 74 Years | 22 (7.4%) | 21 (4.3%) |
| 75 to 79 Years | 7 (2.4%) | 31 (6.4%) |
| 80 to 84 Years | 13 (4.4%) | 0 (0.0%) |
| 85 Years and over | 3 (1.0%) | 1 (0.2%) |
| Total | 298 (100.0%) | 485 (100.0%) |
Families and Households in Chenequa
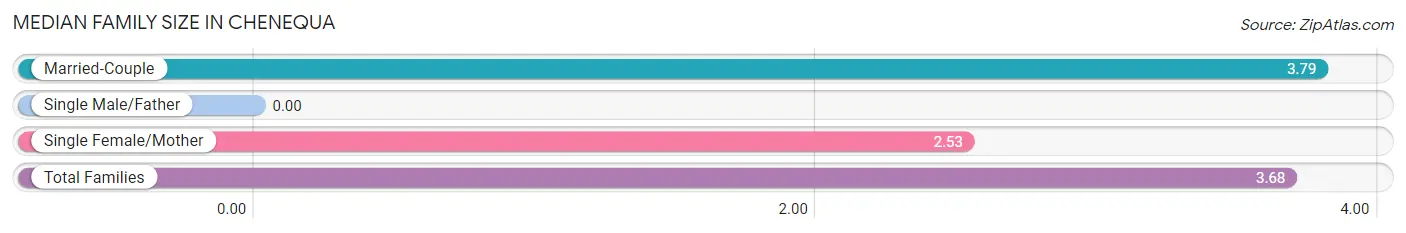
Median Family Size in Chenequa
| Family Type | # Families | Family Size |
| Married-Couple | 178 (91.3%) | 3.79 |
| Single Male/Father | 0 (0.0%) | - |
| Single Female/Mother | 17 (8.7%) | 2.53 |
| Total Families | 195 (100.0%) | 3.68 |
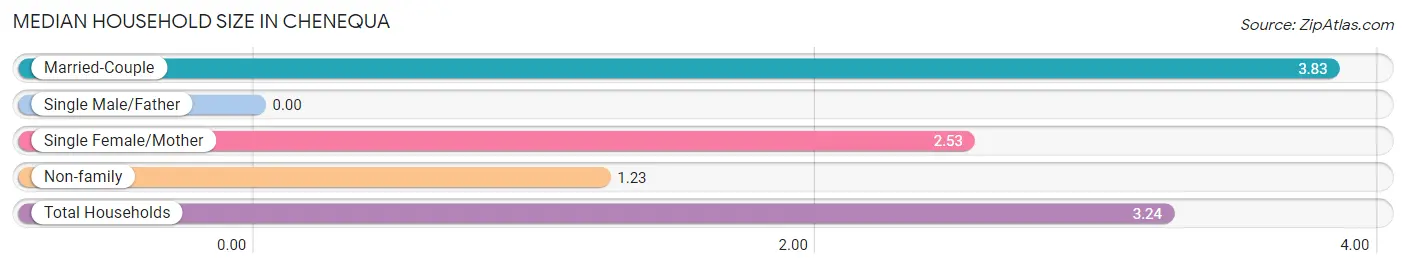
Median Household Size in Chenequa
| Household Type | # Households | Household Size |
| Married-Couple | 178 (73.6%) | 3.83 |
| Single Male/Father | 0 (0.0%) | - |
| Single Female/Mother | 17 (7.0%) | 2.53 |
| Non-family | 47 (19.4%) | 1.23 |
| Total Households | 242 (100.0%) | 3.24 |
Household Size by Marriage Status in Chenequa
Out of a total of 242 households in Chenequa, 195 (80.6%) are family households, while 47 (19.4%) are nonfamily households. The most numerous type of family households are 2-person households, comprising 98, and the most common type of nonfamily households are 1-person households, comprising 36.
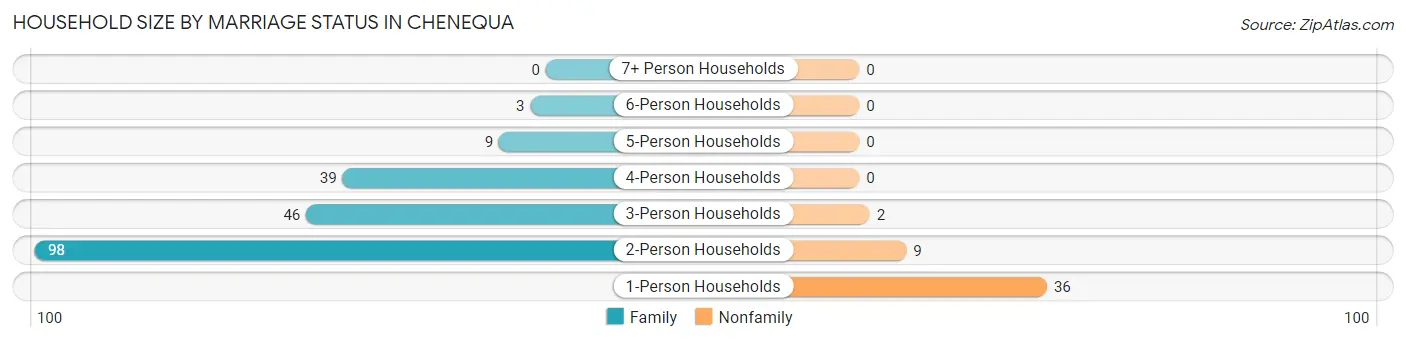
| Household Size | Family Households | Nonfamily Households |
| 1-Person Households | - | 36 (14.9%) |
| 2-Person Households | 98 (40.5%) | 9 (3.7%) |
| 3-Person Households | 46 (19.0%) | 2 (0.8%) |
| 4-Person Households | 39 (16.1%) | 0 (0.0%) |
| 5-Person Households | 9 (3.7%) | 0 (0.0%) |
| 6-Person Households | 3 (1.2%) | 0 (0.0%) |
| 7+ Person Households | 0 (0.0%) | 0 (0.0%) |
| Total | 195 (80.6%) | 47 (19.4%) |
Female Fertility in Chenequa
Fertility by Age in Chenequa
Average fertility rate in Chenequa is 48.0 births per 1,000 women. Women in the age bracket of 20 to 34 years have the highest fertility rate with 80.0 births per 1,000 women. Women in the age bracket of 35 to 50 years acount for 60.0% of all women with births.
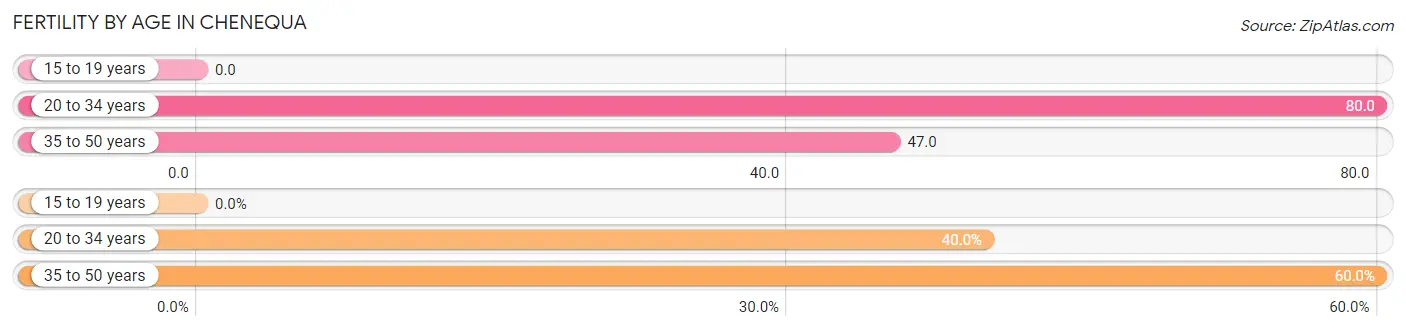
| Age Bracket | Women with Births | Births / 1,000 Women |
| 15 to 19 years | 0 (0.0%) | 0.0 |
| 20 to 34 years | 2 (40.0%) | 80.0 |
| 35 to 50 years | 3 (60.0%) | 47.0 |
| Total | 5 (100.0%) | 48.0 |
Fertility by Age by Marriage Status in Chenequa
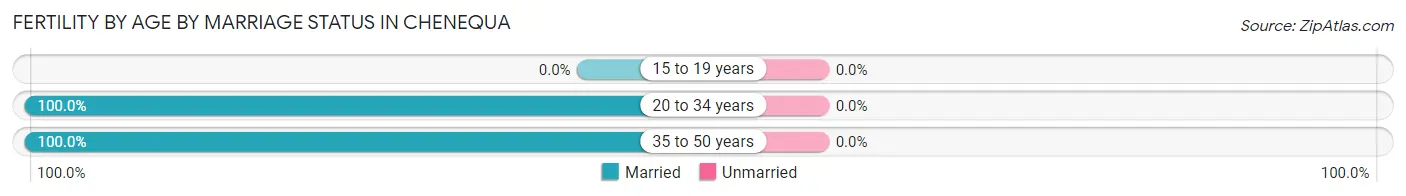
| Age Bracket | Married | Unmarried |
| 15 to 19 years | 0 (0.0%) | 0 (0.0%) |
| 20 to 34 years | 2 (100.0%) | 0 (0.0%) |
| 35 to 50 years | 3 (100.0%) | 0 (0.0%) |
| Total | 5 (100.0%) | 0 (0.0%) |
Fertility by Education in Chenequa
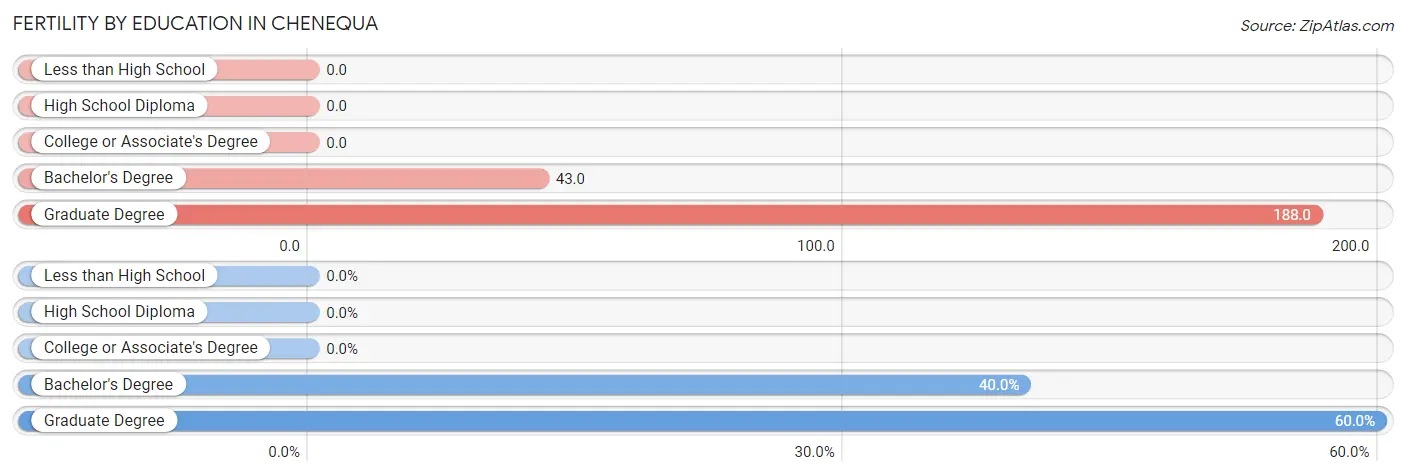
| Educational Attainment | Women with Births | Births / 1,000 Women |
| Less than High School | 0 (0.0%) | 0.0 |
| High School Diploma | 0 (0.0%) | 0.0 |
| College or Associate's Degree | 0 (0.0%) | 0.0 |
| Bachelor's Degree | 2 (40.0%) | 43.0 |
| Graduate Degree | 3 (60.0%) | 188.0 |
| Total | 5 (100.0%) | 48.0 |
Fertility by Education by Marriage Status in Chenequa
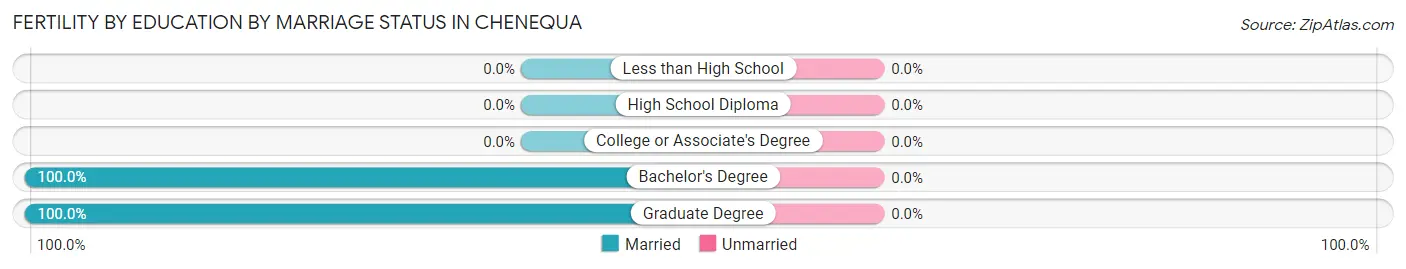
| Educational Attainment | Married | Unmarried |
| Less than High School | 0 (0.0%) | 0 (0.0%) |
| High School Diploma | 0 (0.0%) | 0 (0.0%) |
| College or Associate's Degree | 0 (0.0%) | 0 (0.0%) |
| Bachelor's Degree | 2 (100.0%) | 0 (0.0%) |
| Graduate Degree | 3 (100.0%) | 0 (0.0%) |
| Total | 5 (100.0%) | 0 (0.0%) |
Employment Characteristics in Chenequa
Employment by Class of Employer in Chenequa
Among the 265 employed individuals in Chenequa, private company employees (149 | 56.2%), self-employed (not incorporated) (57 | 21.5%), and not-for-profit organizations (27 | 10.2%) make up the most common classes of employment.
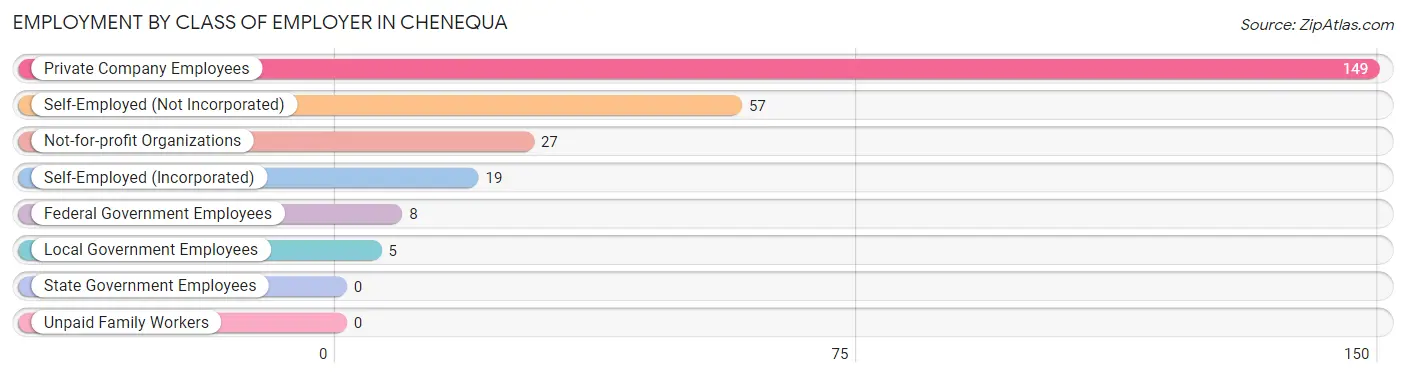
| Employer Class | # Employees | % Employees |
| Private Company Employees | 149 | 56.2% |
| Self-Employed (Incorporated) | 19 | 7.2% |
| Self-Employed (Not Incorporated) | 57 | 21.5% |
| Not-for-profit Organizations | 27 | 10.2% |
| Local Government Employees | 5 | 1.9% |
| State Government Employees | 0 | 0.0% |
| Federal Government Employees | 8 | 3.0% |
| Unpaid Family Workers | 0 | 0.0% |
| Total | 265 | 100.0% |
Employment Status by Age in Chenequa
According to the labor force statistics for Chenequa, out of the total population over 16 years of age (687), 40.0% or 275 individuals are in the labor force, with 1.1% or 3 of them unemployed. The age group with the highest labor force participation rate is 25 to 29 years, with 100.0% or 7 individuals in the labor force. Within the labor force, the 35 to 44 years age range has the highest percentage of unemployed individuals, with 3.4% or 2 of them being unemployed.
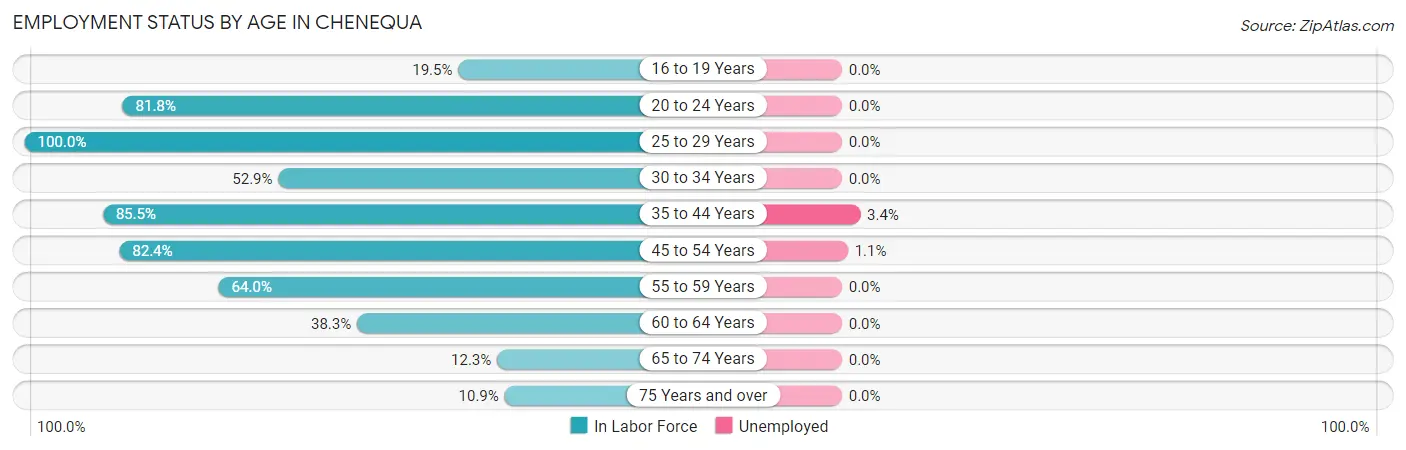
| Age Bracket | In Labor Force | Unemployed |
| 16 to 19 Years | 8 (19.5%) | 0 (0.0%) |
| 20 to 24 Years | 9 (81.8%) | 0 (0.0%) |
| 25 to 29 Years | 7 (100.0%) | 0 (0.0%) |
| 30 to 34 Years | 9 (52.9%) | 0 (0.0%) |
| 35 to 44 Years | 59 (85.5%) | 2 (3.4%) |
| 45 to 54 Years | 89 (82.4%) | 1 (1.1%) |
| 55 to 59 Years | 32 (64.0%) | 0 (0.0%) |
| 60 to 64 Years | 23 (38.3%) | 0 (0.0%) |
| 65 to 74 Years | 33 (12.3%) | 0 (0.0%) |
| 75 Years and over | 6 (10.9%) | 0 (0.0%) |
| Total | 275 (40.0%) | 3 (1.1%) |
Employment Status by Educational Attainment in Chenequa
According to labor force statistics for Chenequa, 70.4% of individuals (219) out of the total population between 25 and 64 years of age (311) are in the labor force, with 1.4% or 3 of them being unemployed. The group with the highest labor force participation rate are those with the educational attainment of college / associate degree, with 77.3% or 34 individuals in the labor force. Within the labor force, individuals with college / associate degree education have the highest percentage of unemployment, with 5.9% or 2 of them being unemployed.
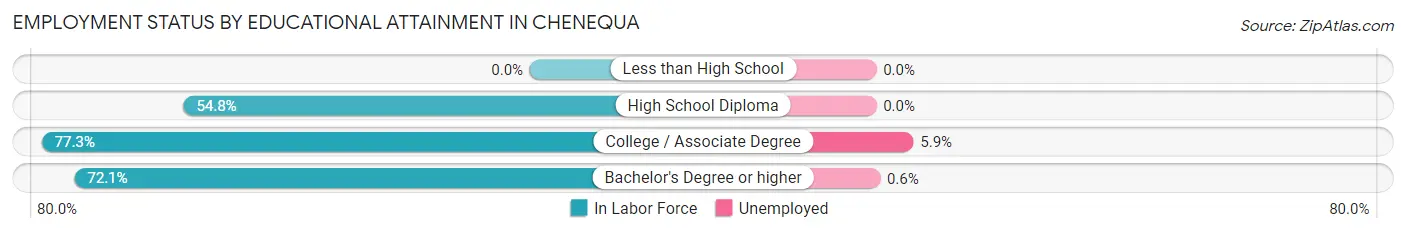
| Educational Attainment | In Labor Force | Unemployed |
| Less than High School | 0 (0.0%) | 0 (0.0%) |
| High School Diploma | 17 (54.8%) | 0 (0.0%) |
| College / Associate Degree | 34 (77.3%) | 3 (5.9%) |
| Bachelor's Degree or higher | 168 (72.1%) | 1 (0.6%) |
| Total | 219 (70.4%) | 4 (1.4%) |
Employment Occupations by Sex in Chenequa
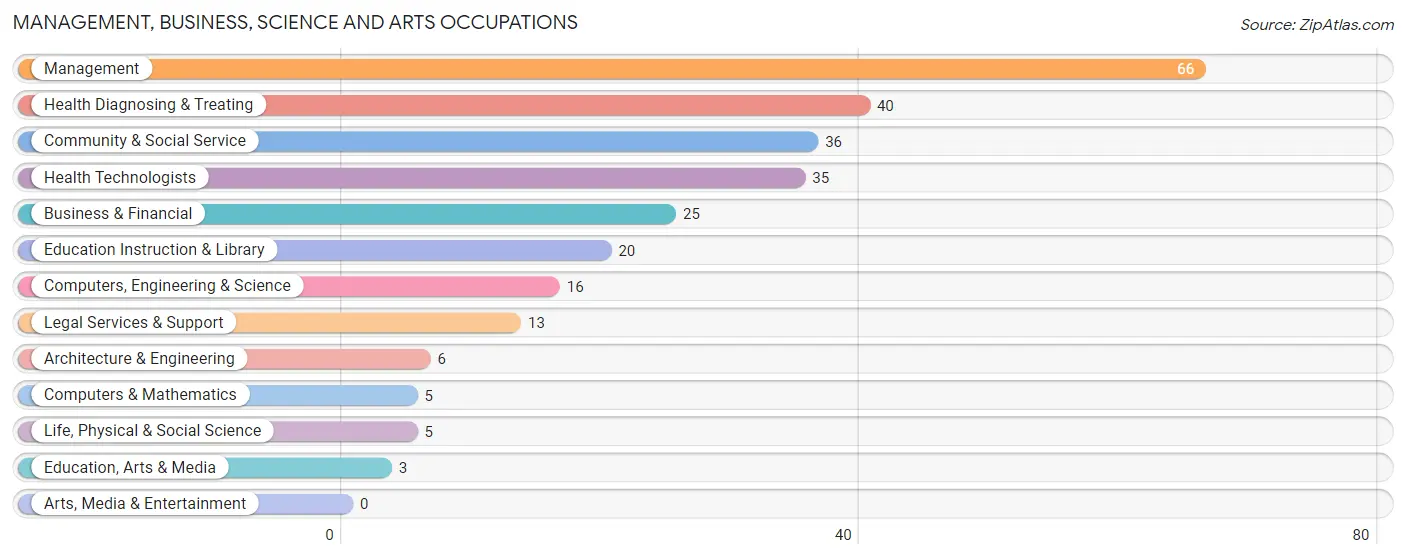
Management, Business, Science and Arts Occupations
The most common Management, Business, Science and Arts occupations in Chenequa are Management (66 | 24.3%), Health Diagnosing & Treating (40 | 14.7%), Community & Social Service (36 | 13.2%), Health Technologists (35 | 12.9%), and Business & Financial (25 | 9.2%).
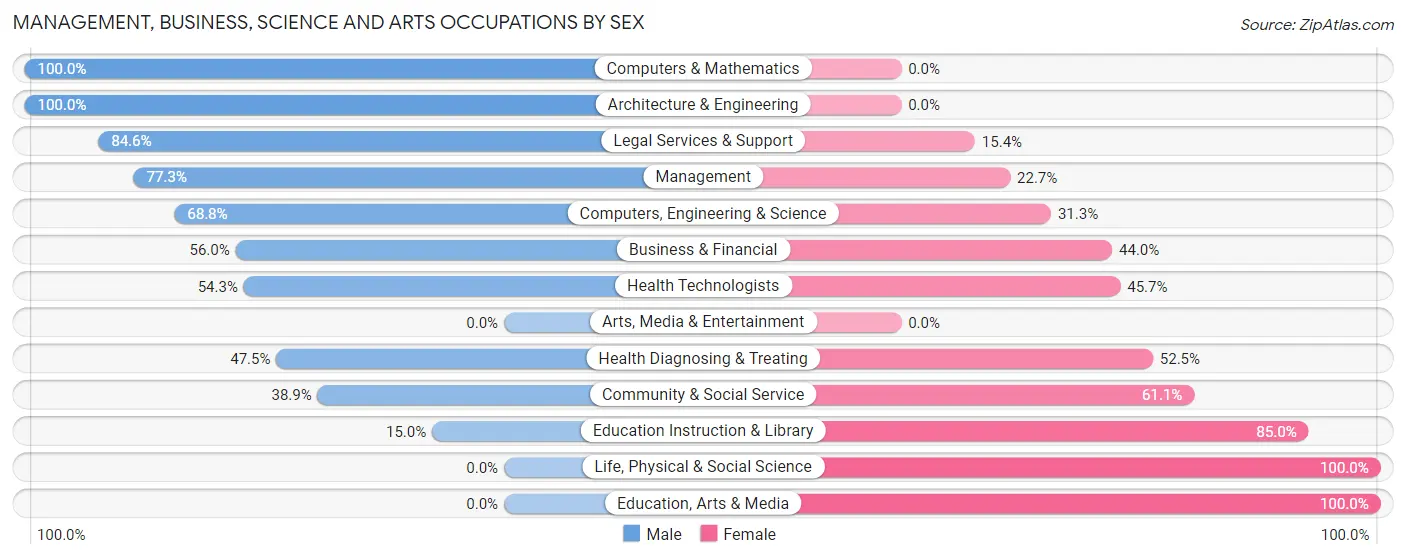
Management, Business, Science and Arts Occupations by Sex
Within the Management, Business, Science and Arts occupations in Chenequa, the most male-oriented occupations are Computers & Mathematics (100.0%), Architecture & Engineering (100.0%), and Legal Services & Support (84.6%), while the most female-oriented occupations are Life, Physical & Social Science (100.0%), Education, Arts & Media (100.0%), and Education Instruction & Library (85.0%).
| Occupation | Male | Female |
| Management | 51 (77.3%) | 15 (22.7%) |
| Business & Financial | 14 (56.0%) | 11 (44.0%) |
| Computers, Engineering & Science | 11 (68.8%) | 5 (31.2%) |
| Computers & Mathematics | 5 (100.0%) | 0 (0.0%) |
| Architecture & Engineering | 6 (100.0%) | 0 (0.0%) |
| Life, Physical & Social Science | 0 (0.0%) | 5 (100.0%) |
| Community & Social Service | 14 (38.9%) | 22 (61.1%) |
| Education, Arts & Media | 0 (0.0%) | 3 (100.0%) |
| Legal Services & Support | 11 (84.6%) | 2 (15.4%) |
| Education Instruction & Library | 3 (15.0%) | 17 (85.0%) |
| Arts, Media & Entertainment | 0 (0.0%) | 0 (0.0%) |
| Health Diagnosing & Treating | 19 (47.5%) | 21 (52.5%) |
| Health Technologists | 19 (54.3%) | 16 (45.7%) |
| Total (Category) | 109 (59.6%) | 74 (40.4%) |
| Total (Overall) | 158 (58.1%) | 114 (41.9%) |
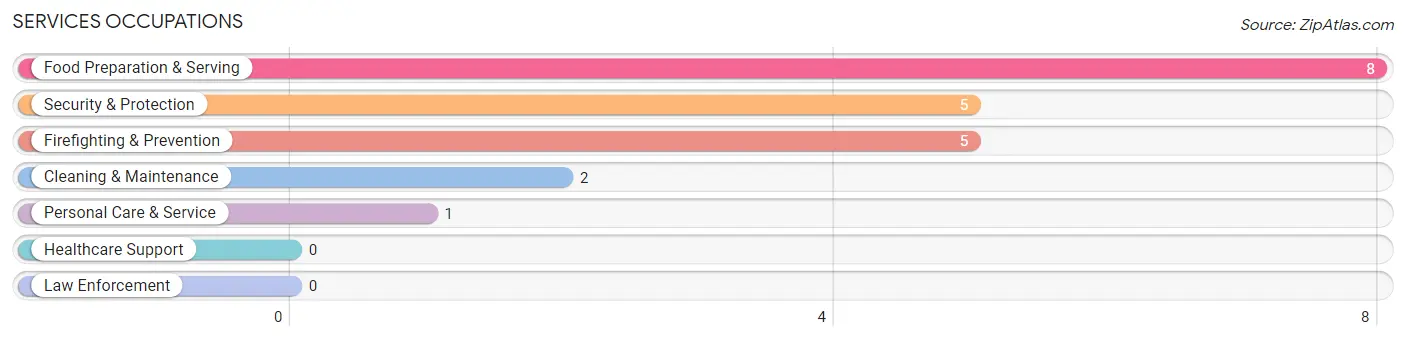
Services Occupations
The most common Services occupations in Chenequa are Food Preparation & Serving (8 | 2.9%), Security & Protection (5 | 1.8%), Firefighting & Prevention (5 | 1.8%), Cleaning & Maintenance (2 | 0.7%), and Personal Care & Service (1 | 0.4%).
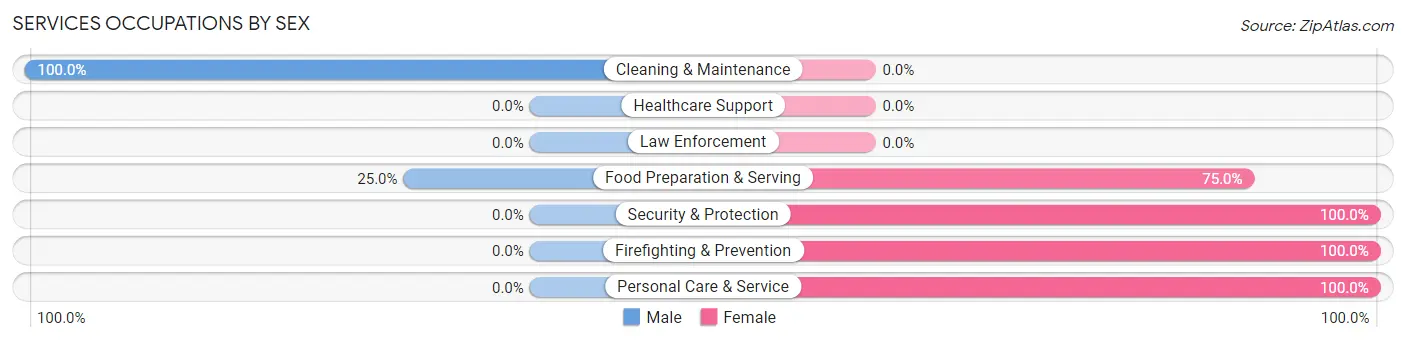
Services Occupations by Sex
Within the Services occupations in Chenequa, the most male-oriented occupations are Cleaning & Maintenance (100.0%), and Food Preparation & Serving (25.0%), while the most female-oriented occupations are Security & Protection (100.0%), Firefighting & Prevention (100.0%), and Personal Care & Service (100.0%).
| Occupation | Male | Female |
| Healthcare Support | 0 (0.0%) | 0 (0.0%) |
| Security & Protection | 0 (0.0%) | 5 (100.0%) |
| Firefighting & Prevention | 0 (0.0%) | 5 (100.0%) |
| Law Enforcement | 0 (0.0%) | 0 (0.0%) |
| Food Preparation & Serving | 2 (25.0%) | 6 (75.0%) |
| Cleaning & Maintenance | 2 (100.0%) | 0 (0.0%) |
| Personal Care & Service | 0 (0.0%) | 1 (100.0%) |
| Total (Category) | 4 (25.0%) | 12 (75.0%) |
| Total (Overall) | 158 (58.1%) | 114 (41.9%) |
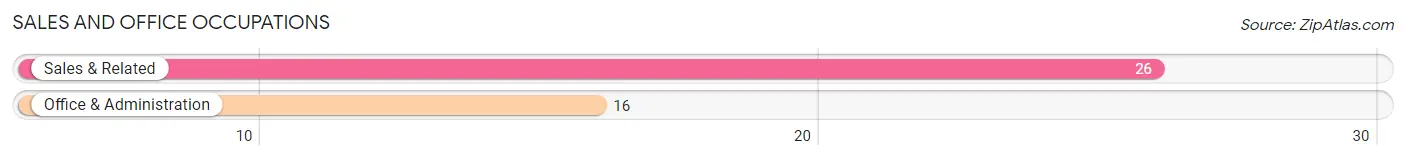
Sales and Office Occupations
The most common Sales and Office occupations in Chenequa are Sales & Related (26 | 9.6%), and Office & Administration (16 | 5.9%).
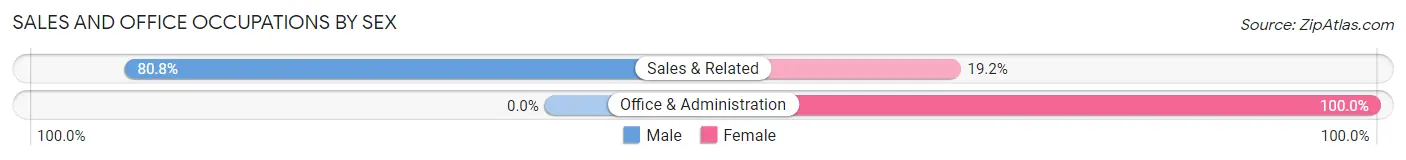
Sales and Office Occupations by Sex
| Occupation | Male | Female |
| Sales & Related | 21 (80.8%) | 5 (19.2%) |
| Office & Administration | 0 (0.0%) | 16 (100.0%) |
| Total (Category) | 21 (50.0%) | 21 (50.0%) |
| Total (Overall) | 158 (58.1%) | 114 (41.9%) |
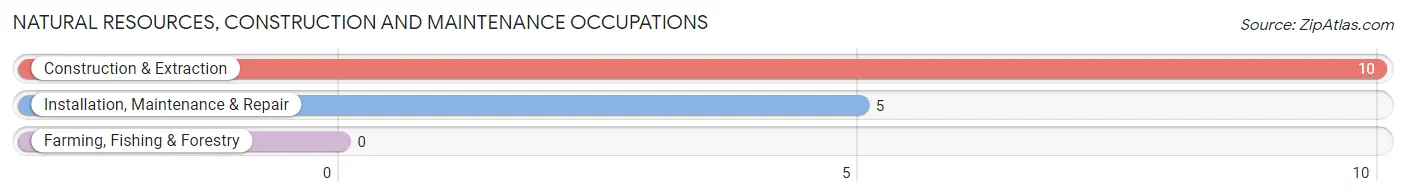
Natural Resources, Construction and Maintenance Occupations
The most common Natural Resources, Construction and Maintenance occupations in Chenequa are Construction & Extraction (10 | 3.7%), and Installation, Maintenance & Repair (5 | 1.8%).
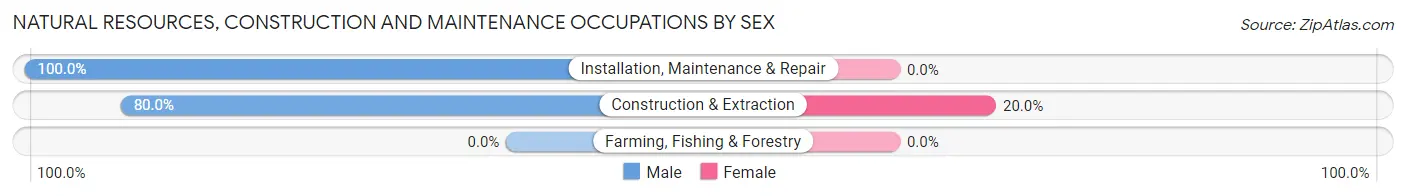
Natural Resources, Construction and Maintenance Occupations by Sex
| Occupation | Male | Female |
| Farming, Fishing & Forestry | 0 (0.0%) | 0 (0.0%) |
| Construction & Extraction | 8 (80.0%) | 2 (20.0%) |
| Installation, Maintenance & Repair | 5 (100.0%) | 0 (0.0%) |
| Total (Category) | 13 (86.7%) | 2 (13.3%) |
| Total (Overall) | 158 (58.1%) | 114 (41.9%) |
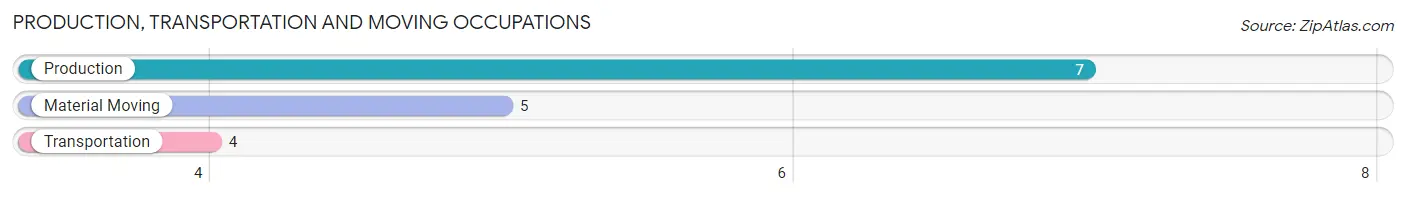
Production, Transportation and Moving Occupations
The most common Production, Transportation and Moving occupations in Chenequa are Production (7 | 2.6%), Material Moving (5 | 1.8%), and Transportation (4 | 1.5%).
Production, Transportation and Moving Occupations by Sex
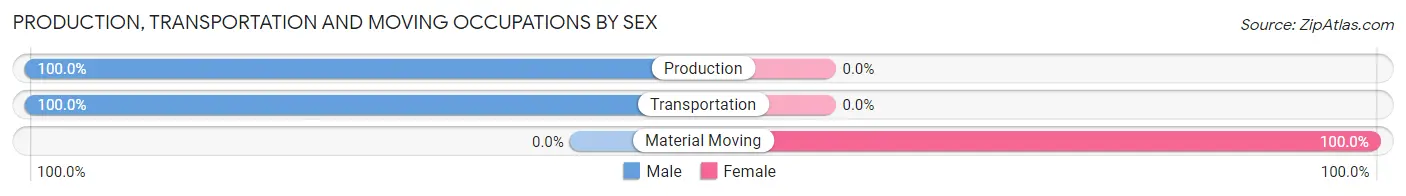
| Occupation | Male | Female |
| Production | 7 (100.0%) | 0 (0.0%) |
| Transportation | 4 (100.0%) | 0 (0.0%) |
| Material Moving | 0 (0.0%) | 5 (100.0%) |
| Total (Category) | 11 (68.8%) | 5 (31.2%) |
| Total (Overall) | 158 (58.1%) | 114 (41.9%) |
Employment Industries by Sex in Chenequa
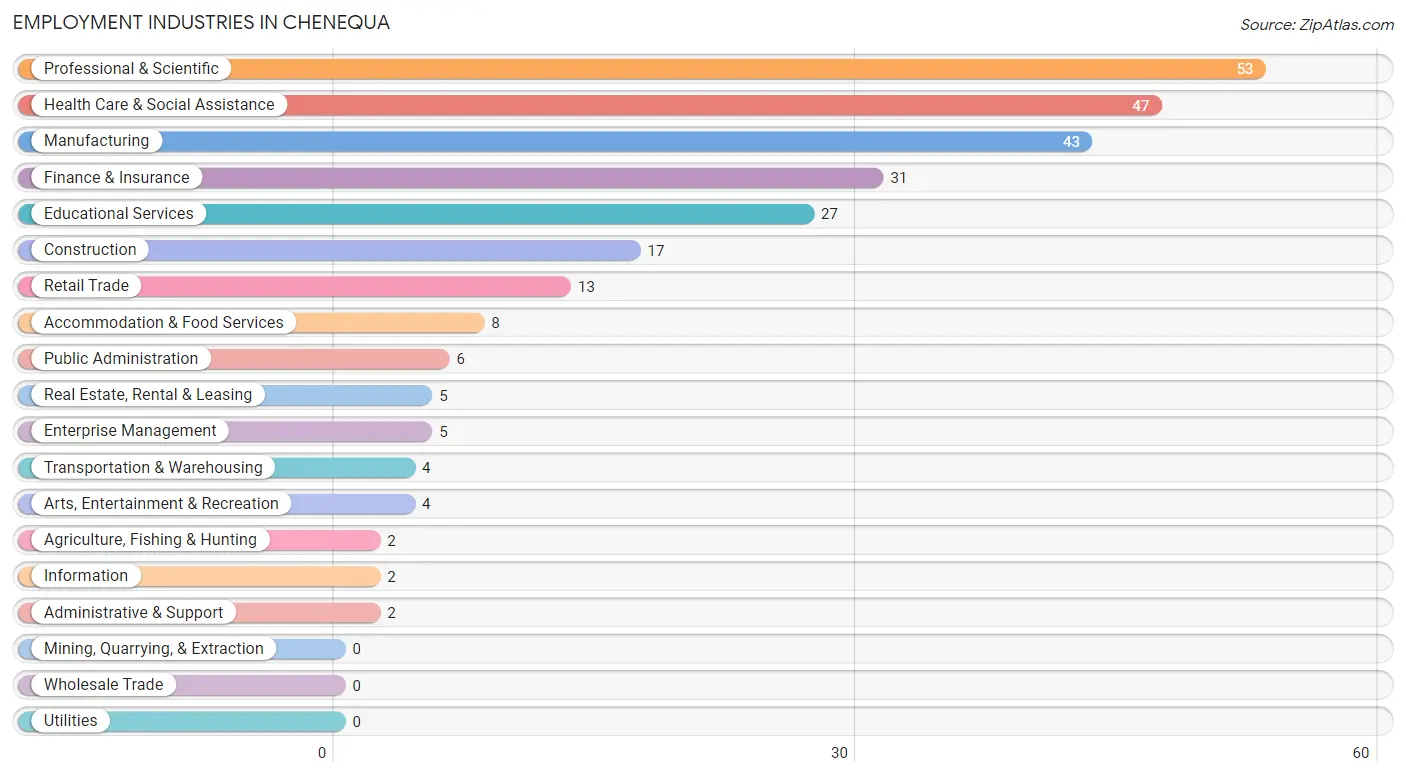
Employment Industries in Chenequa
The major employment industries in Chenequa include Professional & Scientific (53 | 19.5%), Health Care & Social Assistance (47 | 17.3%), Manufacturing (43 | 15.8%), Finance & Insurance (31 | 11.4%), and Educational Services (27 | 9.9%).
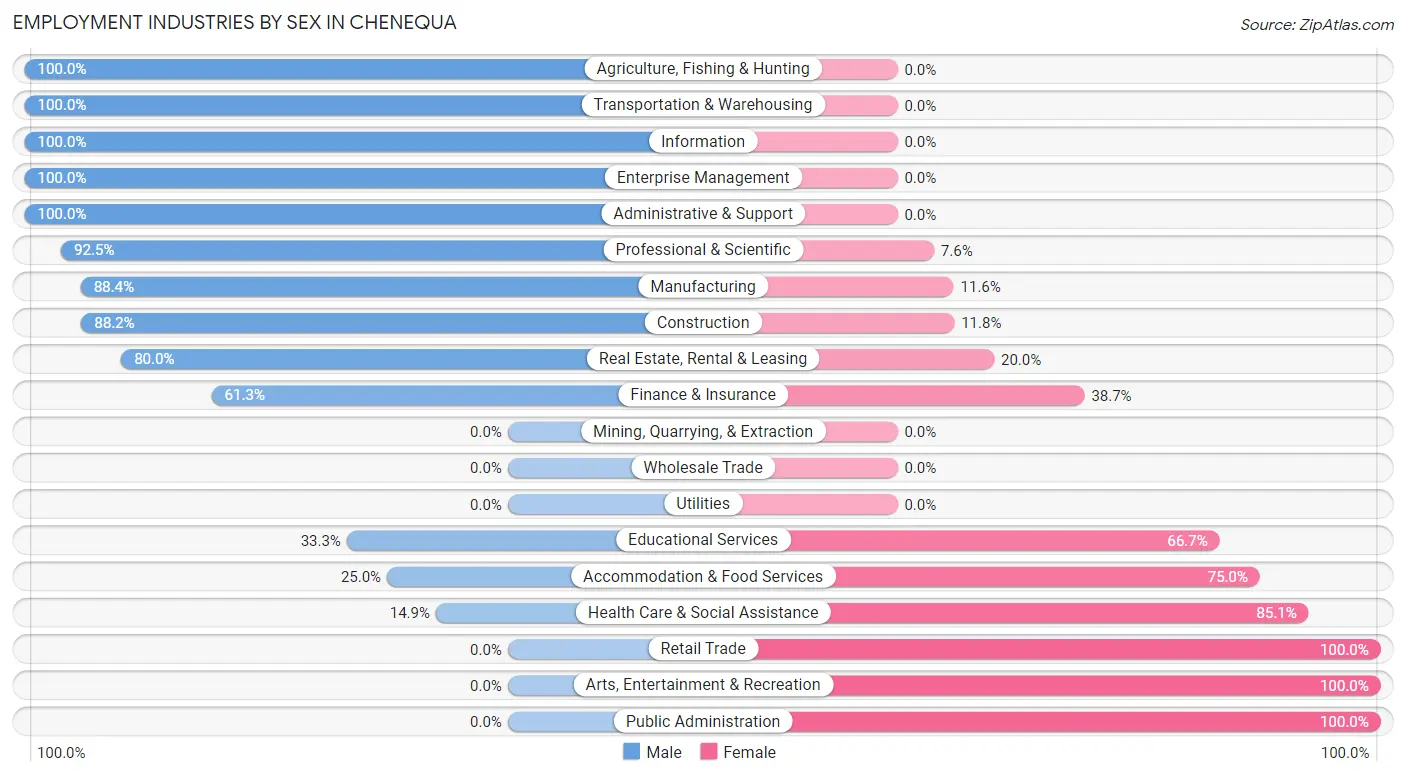
Employment Industries by Sex in Chenequa
The Chenequa industries that see more men than women are Agriculture, Fishing & Hunting (100.0%), Transportation & Warehousing (100.0%), and Information (100.0%), whereas the industries that tend to have a higher number of women are Retail Trade (100.0%), Arts, Entertainment & Recreation (100.0%), and Public Administration (100.0%).
| Industry | Male | Female |
| Agriculture, Fishing & Hunting | 2 (100.0%) | 0 (0.0%) |
| Mining, Quarrying, & Extraction | 0 (0.0%) | 0 (0.0%) |
| Construction | 15 (88.2%) | 2 (11.8%) |
| Manufacturing | 38 (88.4%) | 5 (11.6%) |
| Wholesale Trade | 0 (0.0%) | 0 (0.0%) |
| Retail Trade | 0 (0.0%) | 13 (100.0%) |
| Transportation & Warehousing | 4 (100.0%) | 0 (0.0%) |
| Utilities | 0 (0.0%) | 0 (0.0%) |
| Information | 2 (100.0%) | 0 (0.0%) |
| Finance & Insurance | 19 (61.3%) | 12 (38.7%) |
| Real Estate, Rental & Leasing | 4 (80.0%) | 1 (20.0%) |
| Professional & Scientific | 49 (92.4%) | 4 (7.5%) |
| Enterprise Management | 5 (100.0%) | 0 (0.0%) |
| Administrative & Support | 2 (100.0%) | 0 (0.0%) |
| Educational Services | 9 (33.3%) | 18 (66.7%) |
| Health Care & Social Assistance | 7 (14.9%) | 40 (85.1%) |
| Arts, Entertainment & Recreation | 0 (0.0%) | 4 (100.0%) |
| Accommodation & Food Services | 2 (25.0%) | 6 (75.0%) |
| Public Administration | 0 (0.0%) | 6 (100.0%) |
| Total | 158 (58.1%) | 114 (41.9%) |
Education in Chenequa
School Enrollment in Chenequa
The most common levels of schooling among the 142 students in Chenequa are high school (36 | 25.4%), elementary school (31 | 21.8%), and middle school (28 | 19.7%).
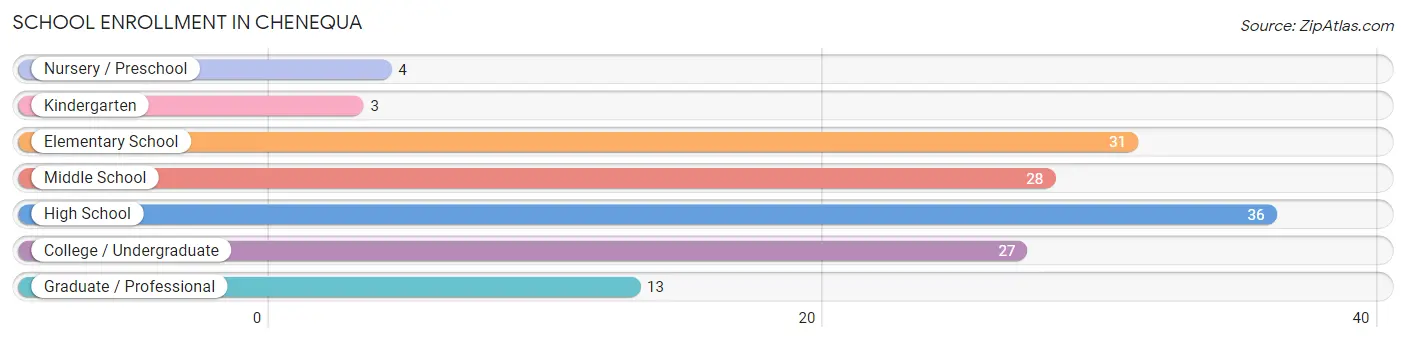
| School Level | # Students | % Students |
| Nursery / Preschool | 4 | 2.8% |
| Kindergarten | 3 | 2.1% |
| Elementary School | 31 | 21.8% |
| Middle School | 28 | 19.7% |
| High School | 36 | 25.4% |
| College / Undergraduate | 27 | 19.0% |
| Graduate / Professional | 13 | 9.1% |
| Total | 142 | 100.0% |
School Enrollment by Age by Funding Source in Chenequa
Out of a total of 142 students who are enrolled in schools in Chenequa, 53 (37.3%) attend a private institution, while the remaining 89 (62.7%) are enrolled in public schools. The age group of 20 to 24 year olds has the highest likelihood of being enrolled in private schools, with 9 (100.0% in the age bracket) enrolled. Conversely, the age group of 35 years and over has the lowest likelihood of being enrolled in a private school, with 19 (100.0% in the age bracket) attending a public institution.
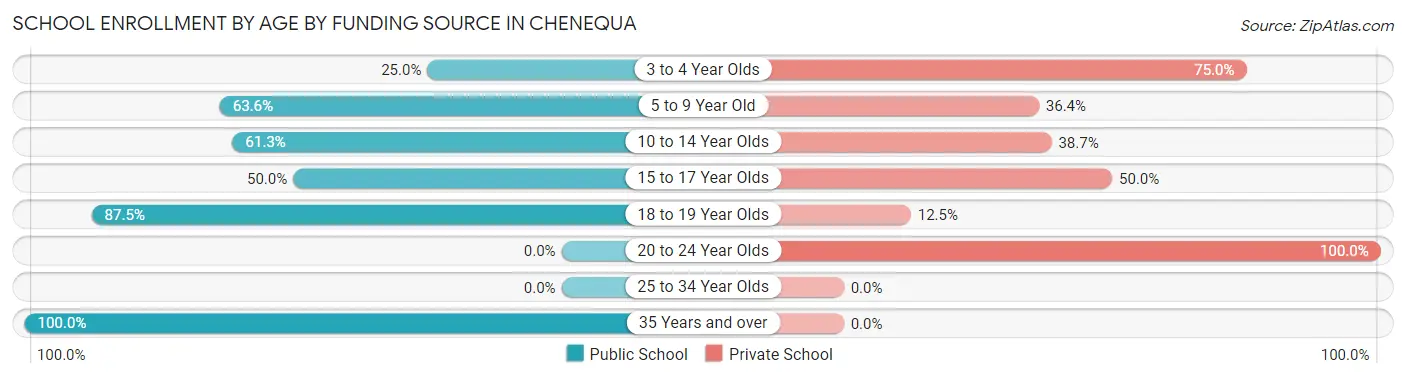
| Age Bracket | Public School | Private School |
| 3 to 4 Year Olds | 1 (25.0%) | 3 (75.0%) |
| 5 to 9 Year Old | 21 (63.6%) | 12 (36.4%) |
| 10 to 14 Year Olds | 19 (61.3%) | 12 (38.7%) |
| 15 to 17 Year Olds | 15 (50.0%) | 15 (50.0%) |
| 18 to 19 Year Olds | 14 (87.5%) | 2 (12.5%) |
| 20 to 24 Year Olds | 0 (0.0%) | 9 (100.0%) |
| 25 to 34 Year Olds | 0 (0.0%) | 0 (0.0%) |
| 35 Years and over | 19 (100.0%) | 0 (0.0%) |
| Total | 89 (62.7%) | 53 (37.3%) |
Educational Attainment by Field of Study in Chenequa
Business (70 | 17.7%), bio, nature & agricultural (48 | 12.1%), education (38 | 9.6%), social sciences (34 | 8.6%), and communications (32 | 8.1%) are the most common fields of study among 396 individuals in Chenequa who have obtained a bachelor's degree or higher.
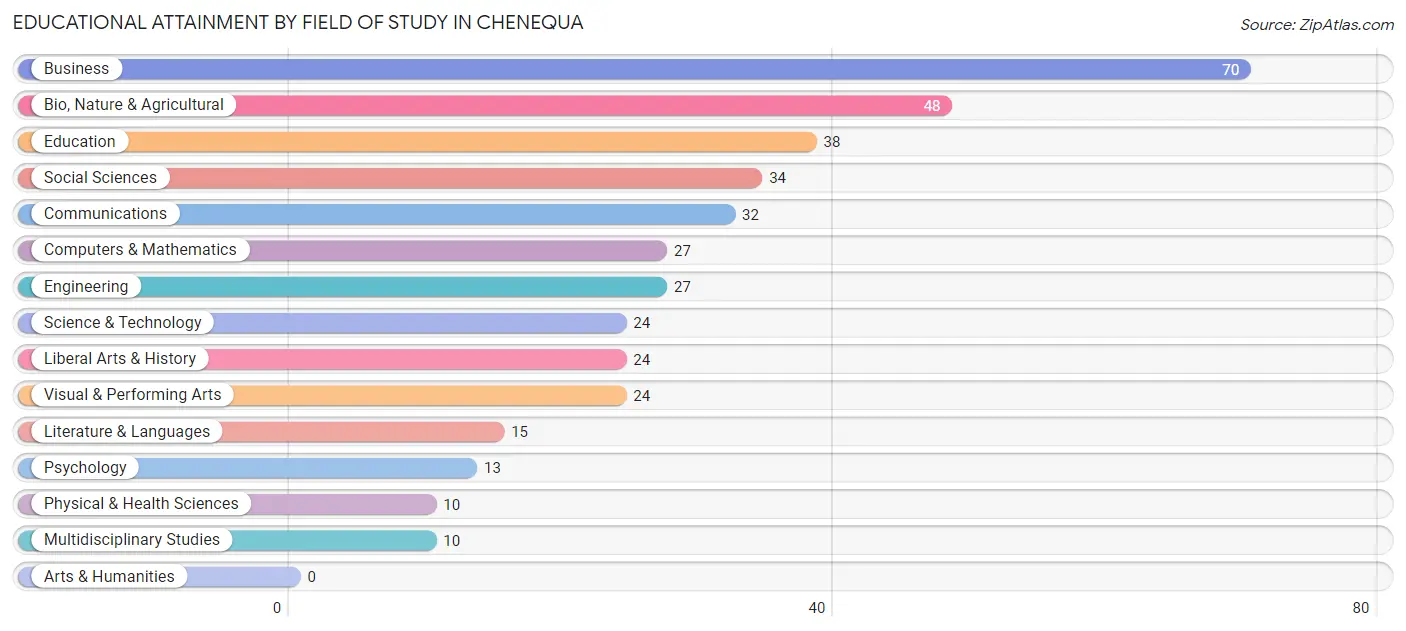
| Field of Study | # Graduates | % Graduates |
| Computers & Mathematics | 27 | 6.8% |
| Bio, Nature & Agricultural | 48 | 12.1% |
| Physical & Health Sciences | 10 | 2.5% |
| Psychology | 13 | 3.3% |
| Social Sciences | 34 | 8.6% |
| Engineering | 27 | 6.8% |
| Multidisciplinary Studies | 10 | 2.5% |
| Science & Technology | 24 | 6.1% |
| Business | 70 | 17.7% |
| Education | 38 | 9.6% |
| Literature & Languages | 15 | 3.8% |
| Liberal Arts & History | 24 | 6.1% |
| Visual & Performing Arts | 24 | 6.1% |
| Communications | 32 | 8.1% |
| Arts & Humanities | 0 | 0.0% |
| Total | 396 | 100.0% |
Transportation & Commute in Chenequa
Vehicle Availability by Sex in Chenequa
The most prevalent vehicle ownership categories in Chenequa are males with 2 vehicles (57, accounting for 36.1%) and females with 2 vehicles (47, making up 53.3%).
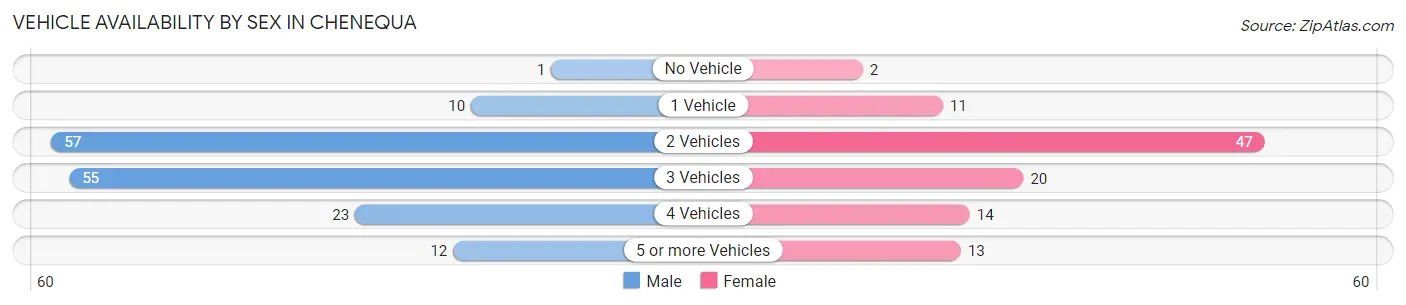
| Vehicles Available | Male | Female |
| No Vehicle | 1 (0.6%) | 2 (1.9%) |
| 1 Vehicle | 10 (6.3%) | 11 (10.3%) |
| 2 Vehicles | 57 (36.1%) | 47 (43.9%) |
| 3 Vehicles | 55 (34.8%) | 20 (18.7%) |
| 4 Vehicles | 23 (14.6%) | 14 (13.1%) |
| 5 or more Vehicles | 12 (7.6%) | 13 (12.1%) |
| Total | 158 (100.0%) | 107 (100.0%) |
Commute Time in Chenequa
The most frequently occuring commute durations in Chenequa are 15 to 19 minutes (35 commuters, 14.6%), 25 to 29 minutes (31 commuters, 12.9%), and 10 to 14 minutes (29 commuters, 12.1%).
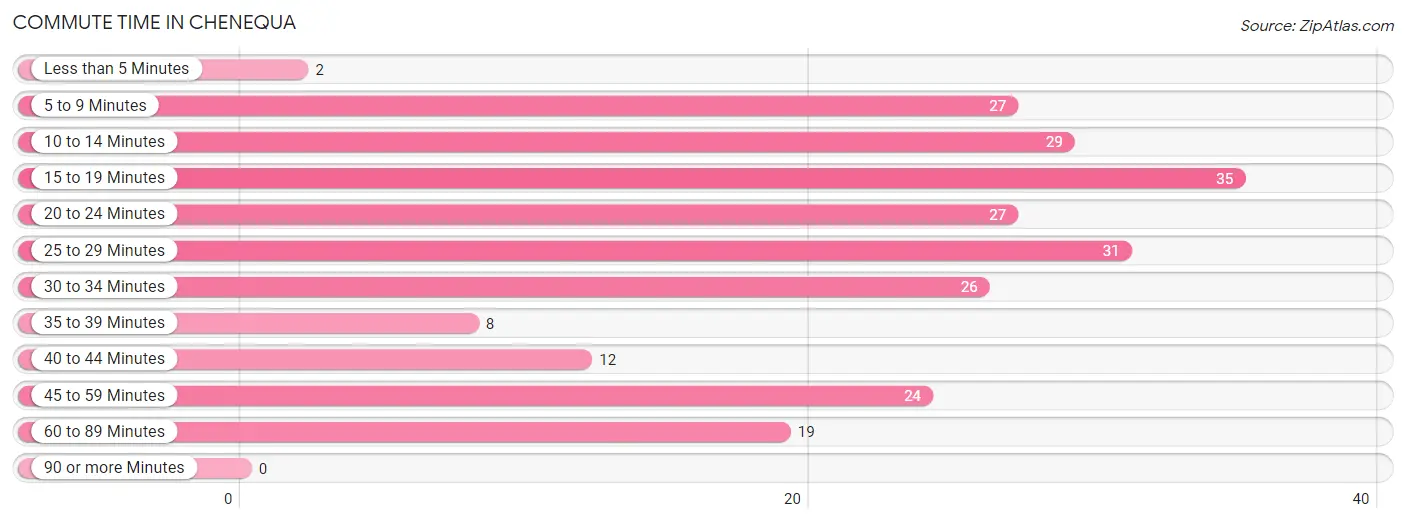
| Commute Time | # Commuters | % Commuters |
| Less than 5 Minutes | 2 | 0.8% |
| 5 to 9 Minutes | 27 | 11.3% |
| 10 to 14 Minutes | 29 | 12.1% |
| 15 to 19 Minutes | 35 | 14.6% |
| 20 to 24 Minutes | 27 | 11.3% |
| 25 to 29 Minutes | 31 | 12.9% |
| 30 to 34 Minutes | 26 | 10.8% |
| 35 to 39 Minutes | 8 | 3.3% |
| 40 to 44 Minutes | 12 | 5.0% |
| 45 to 59 Minutes | 24 | 10.0% |
| 60 to 89 Minutes | 19 | 7.9% |
| 90 or more Minutes | 0 | 0.0% |
Commute Time by Sex in Chenequa
The most common commute times in Chenequa are 25 to 29 minutes (23 commuters, 15.4%) for males and 15 to 19 minutes (18 commuters, 19.8%) for females.
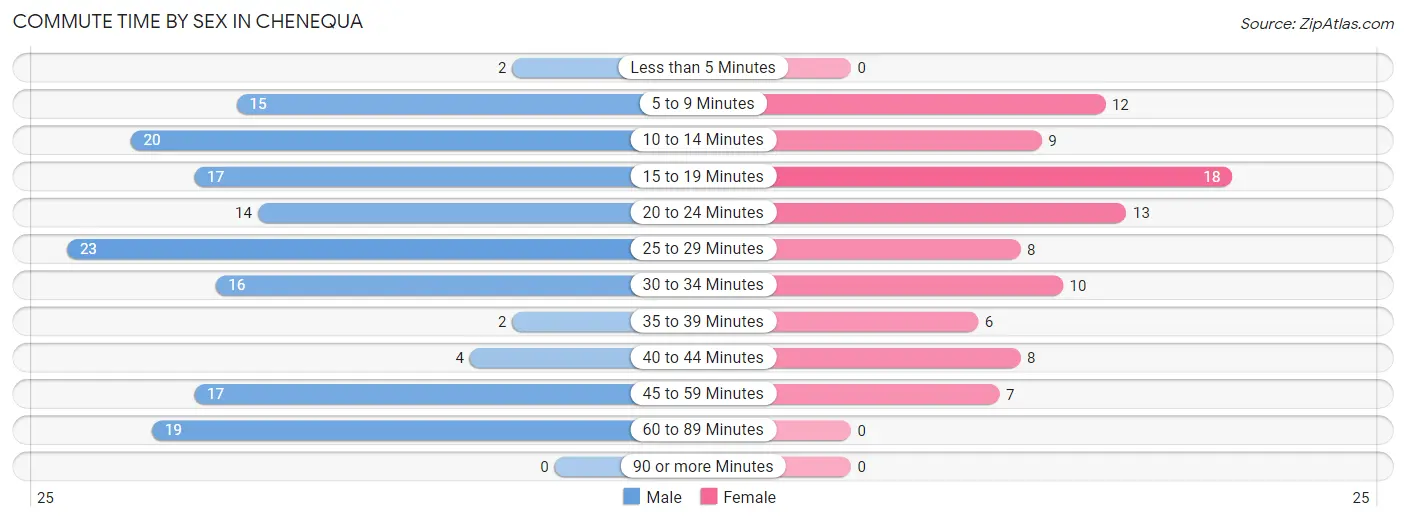
| Commute Time | Male | Female |
| Less than 5 Minutes | 2 (1.3%) | 0 (0.0%) |
| 5 to 9 Minutes | 15 (10.1%) | 12 (13.2%) |
| 10 to 14 Minutes | 20 (13.4%) | 9 (9.9%) |
| 15 to 19 Minutes | 17 (11.4%) | 18 (19.8%) |
| 20 to 24 Minutes | 14 (9.4%) | 13 (14.3%) |
| 25 to 29 Minutes | 23 (15.4%) | 8 (8.8%) |
| 30 to 34 Minutes | 16 (10.7%) | 10 (11.0%) |
| 35 to 39 Minutes | 2 (1.3%) | 6 (6.6%) |
| 40 to 44 Minutes | 4 (2.7%) | 8 (8.8%) |
| 45 to 59 Minutes | 17 (11.4%) | 7 (7.7%) |
| 60 to 89 Minutes | 19 (12.8%) | 0 (0.0%) |
| 90 or more Minutes | 0 (0.0%) | 0 (0.0%) |
Time of Departure to Work by Sex in Chenequa
The most frequent times of departure to work in Chenequa are 7:00 AM to 7:29 AM (45, 30.2%) for males and 7:00 AM to 7:29 AM (16, 17.6%) for females.
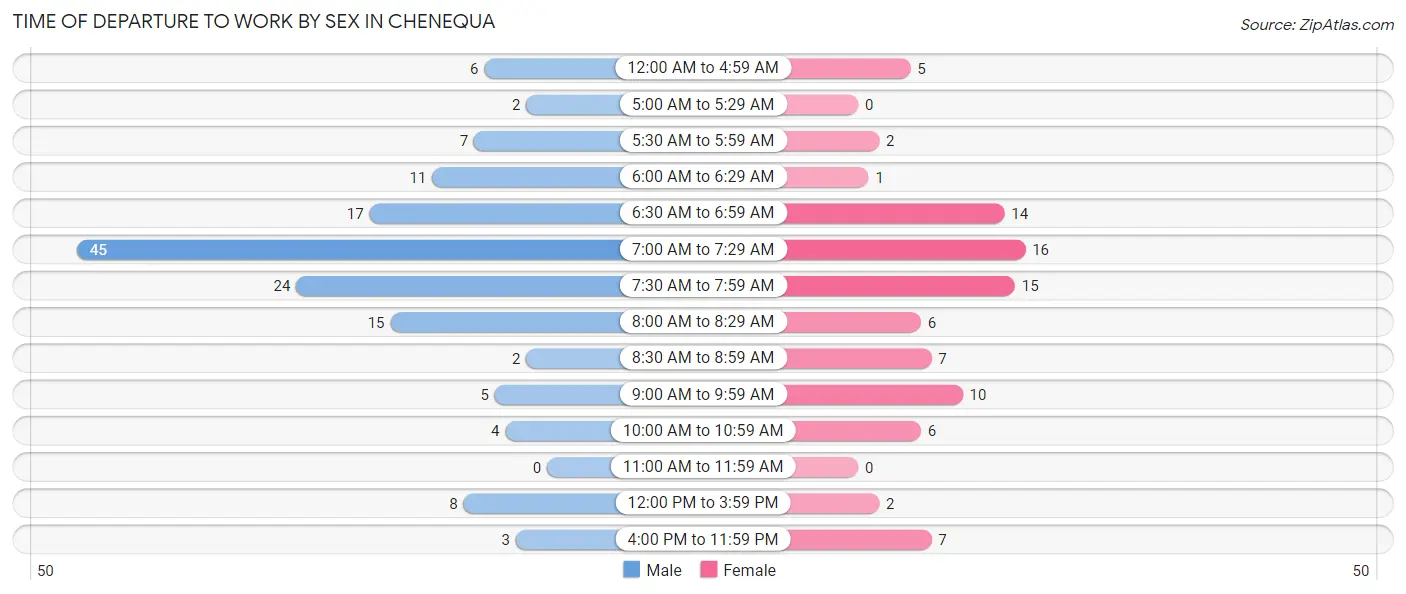
| Time of Departure | Male | Female |
| 12:00 AM to 4:59 AM | 6 (4.0%) | 5 (5.5%) |
| 5:00 AM to 5:29 AM | 2 (1.3%) | 0 (0.0%) |
| 5:30 AM to 5:59 AM | 7 (4.7%) | 2 (2.2%) |
| 6:00 AM to 6:29 AM | 11 (7.4%) | 1 (1.1%) |
| 6:30 AM to 6:59 AM | 17 (11.4%) | 14 (15.4%) |
| 7:00 AM to 7:29 AM | 45 (30.2%) | 16 (17.6%) |
| 7:30 AM to 7:59 AM | 24 (16.1%) | 15 (16.5%) |
| 8:00 AM to 8:29 AM | 15 (10.1%) | 6 (6.6%) |
| 8:30 AM to 8:59 AM | 2 (1.3%) | 7 (7.7%) |
| 9:00 AM to 9:59 AM | 5 (3.4%) | 10 (11.0%) |
| 10:00 AM to 10:59 AM | 4 (2.7%) | 6 (6.6%) |
| 11:00 AM to 11:59 AM | 0 (0.0%) | 0 (0.0%) |
| 12:00 PM to 3:59 PM | 8 (5.4%) | 2 (2.2%) |
| 4:00 PM to 11:59 PM | 3 (2.0%) | 7 (7.7%) |
| Total | 149 (100.0%) | 91 (100.0%) |
Housing Occupancy in Chenequa
Occupancy by Ownership in Chenequa
Of the total 242 dwellings in Chenequa, owner-occupied units account for 218 (90.1%), while renter-occupied units make up 24 (9.9%).
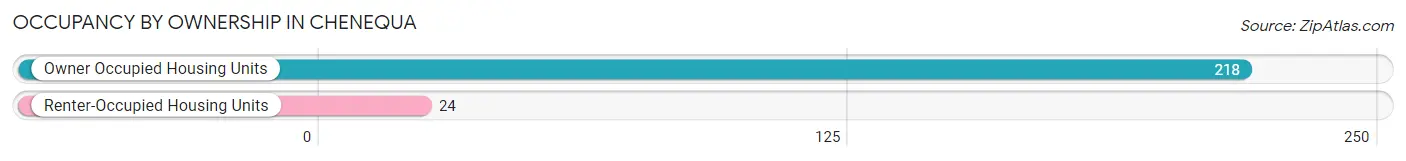
| Occupancy | # Housing Units | % Housing Units |
| Owner Occupied Housing Units | 218 | 90.1% |
| Renter-Occupied Housing Units | 24 | 9.9% |
| Total Occupied Housing Units | 242 | 100.0% |
Occupancy by Household Size in Chenequa
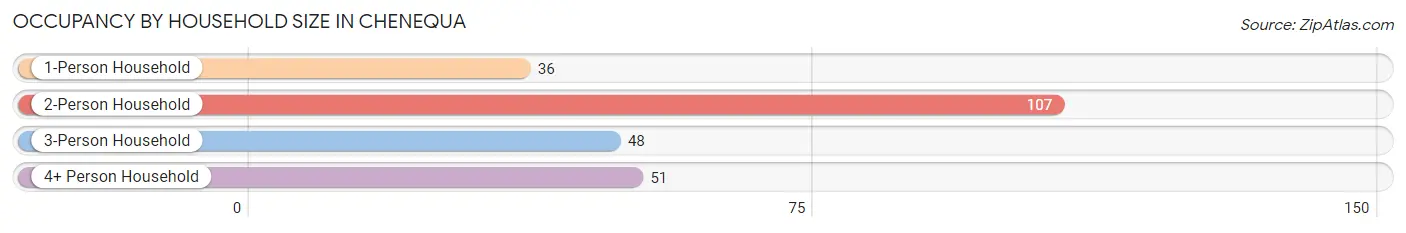
| Household Size | # Housing Units | % Housing Units |
| 1-Person Household | 36 | 14.9% |
| 2-Person Household | 107 | 44.2% |
| 3-Person Household | 48 | 19.8% |
| 4+ Person Household | 51 | 21.1% |
| Total Housing Units | 242 | 100.0% |
Occupancy by Ownership by Household Size in Chenequa
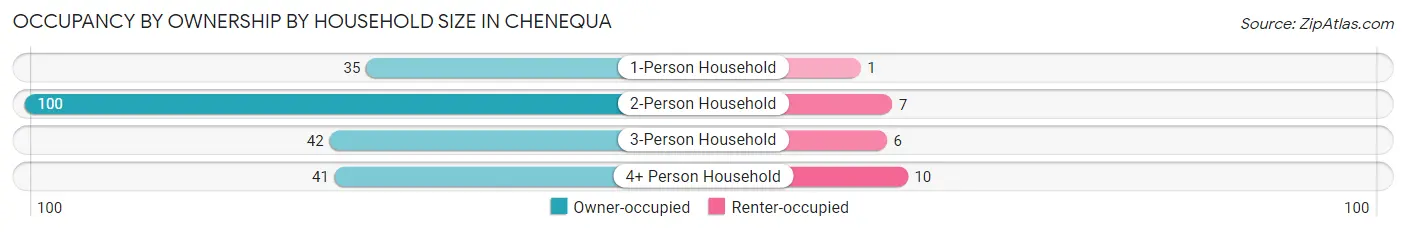
| Household Size | Owner-occupied | Renter-occupied |
| 1-Person Household | 35 (97.2%) | 1 (2.8%) |
| 2-Person Household | 100 (93.5%) | 7 (6.5%) |
| 3-Person Household | 42 (87.5%) | 6 (12.5%) |
| 4+ Person Household | 41 (80.4%) | 10 (19.6%) |
| Total Housing Units | 218 (90.1%) | 24 (9.9%) |
Occupancy by Educational Attainment in Chenequa
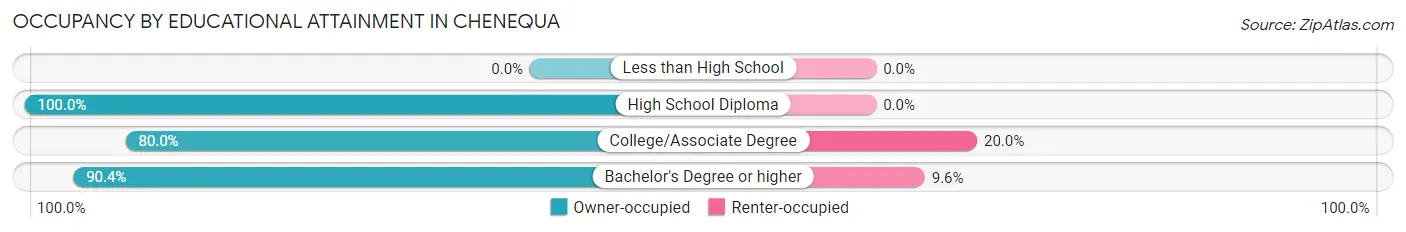
| Household Size | Owner-occupied | Renter-occupied |
| Less than High School | 0 (0.0%) | 0 (0.0%) |
| High School Diploma | 20 (100.0%) | 0 (0.0%) |
| College/Associate Degree | 20 (80.0%) | 5 (20.0%) |
| Bachelor's Degree or higher | 178 (90.4%) | 19 (9.6%) |
Occupancy by Age of Householder in Chenequa
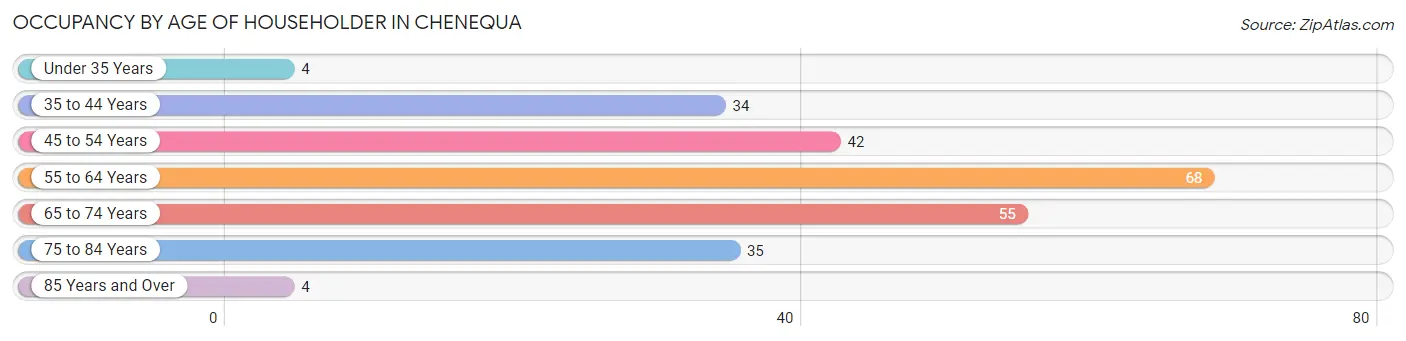
| Age Bracket | # Households | % Households |
| Under 35 Years | 4 | 1.7% |
| 35 to 44 Years | 34 | 14.1% |
| 45 to 54 Years | 42 | 17.4% |
| 55 to 64 Years | 68 | 28.1% |
| 65 to 74 Years | 55 | 22.7% |
| 75 to 84 Years | 35 | 14.5% |
| 85 Years and Over | 4 | 1.7% |
| Total | 242 | 100.0% |
Housing Finances in Chenequa
Median Income by Occupancy in Chenequa
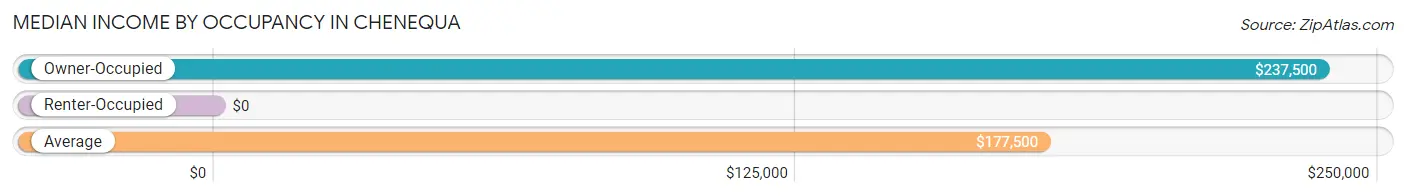
| Occupancy Type | # Households | Median Income |
| Owner-Occupied | 218 (90.1%) | $237,500 |
| Renter-Occupied | 24 (9.9%) | $0 |
| Average | 242 (100.0%) | $177,500 |
Occupancy by Householder Income Bracket in Chenequa
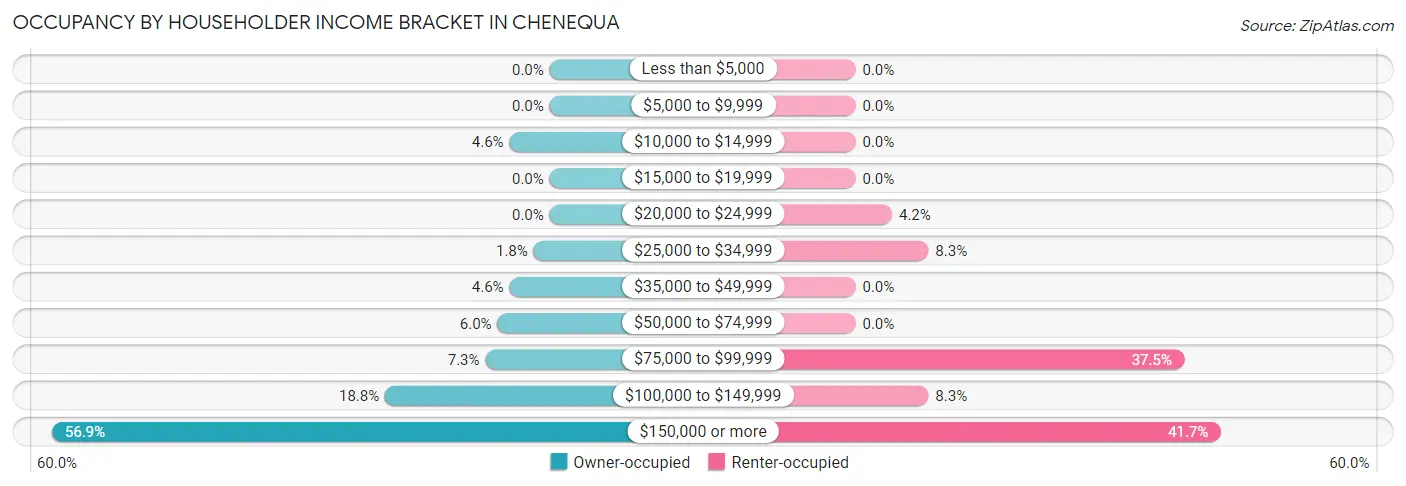
| Income Bracket | Owner-occupied | Renter-occupied |
| Less than $5,000 | 0 (0.0%) | 0 (0.0%) |
| $5,000 to $9,999 | 0 (0.0%) | 0 (0.0%) |
| $10,000 to $14,999 | 10 (4.6%) | 0 (0.0%) |
| $15,000 to $19,999 | 0 (0.0%) | 0 (0.0%) |
| $20,000 to $24,999 | 0 (0.0%) | 1 (4.2%) |
| $25,000 to $34,999 | 4 (1.8%) | 2 (8.3%) |
| $35,000 to $49,999 | 10 (4.6%) | 0 (0.0%) |
| $50,000 to $74,999 | 13 (6.0%) | 0 (0.0%) |
| $75,000 to $99,999 | 16 (7.3%) | 9 (37.5%) |
| $100,000 to $149,999 | 41 (18.8%) | 2 (8.3%) |
| $150,000 or more | 124 (56.9%) | 10 (41.7%) |
| Total | 218 (100.0%) | 24 (100.0%) |
Monthly Housing Cost Tiers in Chenequa
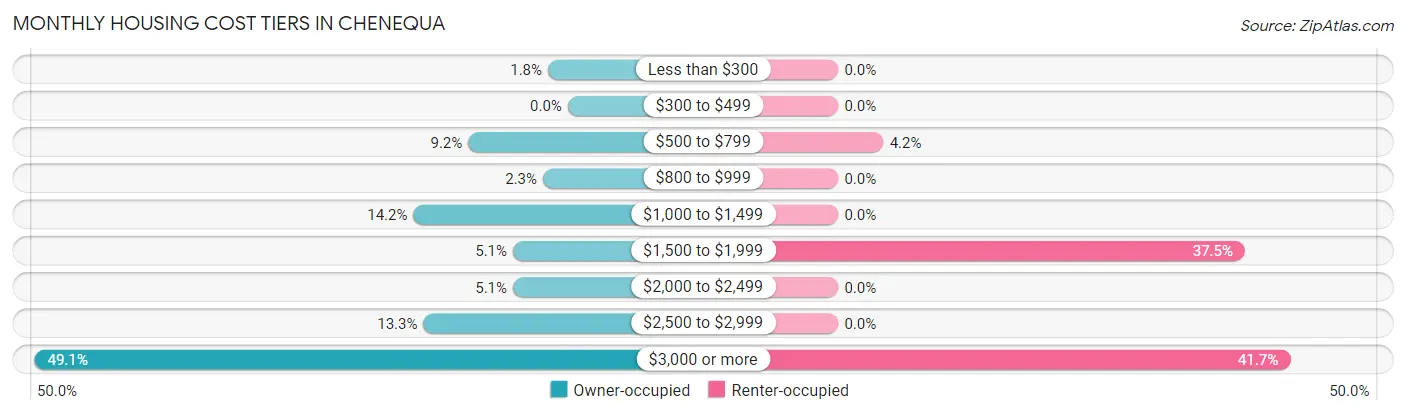
| Monthly Cost | Owner-occupied | Renter-occupied |
| Less than $300 | 4 (1.8%) | 0 (0.0%) |
| $300 to $499 | 0 (0.0%) | 0 (0.0%) |
| $500 to $799 | 20 (9.2%) | 1 (4.2%) |
| $800 to $999 | 5 (2.3%) | 0 (0.0%) |
| $1,000 to $1,499 | 31 (14.2%) | 0 (0.0%) |
| $1,500 to $1,999 | 11 (5.1%) | 9 (37.5%) |
| $2,000 to $2,499 | 11 (5.1%) | 0 (0.0%) |
| $2,500 to $2,999 | 29 (13.3%) | 0 (0.0%) |
| $3,000 or more | 107 (49.1%) | 10 (41.7%) |
| Total | 218 (100.0%) | 24 (100.0%) |
Physical Housing Characteristics in Chenequa
Housing Structures in Chenequa
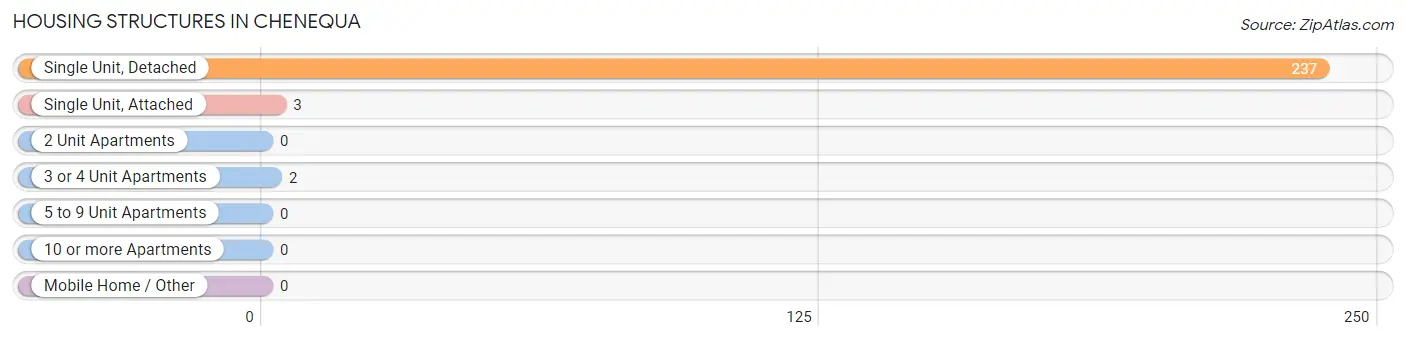
| Structure Type | # Housing Units | % Housing Units |
| Single Unit, Detached | 237 | 97.9% |
| Single Unit, Attached | 3 | 1.2% |
| 2 Unit Apartments | 0 | 0.0% |
| 3 or 4 Unit Apartments | 2 | 0.8% |
| 5 to 9 Unit Apartments | 0 | 0.0% |
| 10 or more Apartments | 0 | 0.0% |
| Mobile Home / Other | 0 | 0.0% |
| Total | 242 | 100.0% |
Housing Structures by Occupancy in Chenequa
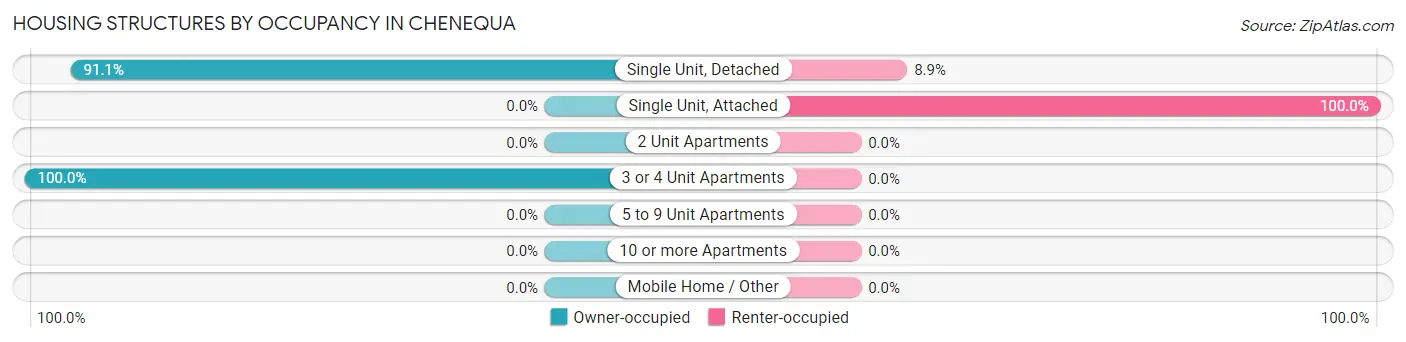
| Structure Type | Owner-occupied | Renter-occupied |
| Single Unit, Detached | 216 (91.1%) | 21 (8.9%) |
| Single Unit, Attached | 0 (0.0%) | 3 (100.0%) |
| 2 Unit Apartments | 0 (0.0%) | 0 (0.0%) |
| 3 or 4 Unit Apartments | 2 (100.0%) | 0 (0.0%) |
| 5 to 9 Unit Apartments | 0 (0.0%) | 0 (0.0%) |
| 10 or more Apartments | 0 (0.0%) | 0 (0.0%) |
| Mobile Home / Other | 0 (0.0%) | 0 (0.0%) |
| Total | 218 (90.1%) | 24 (9.9%) |
Housing Structures by Number of Rooms in Chenequa
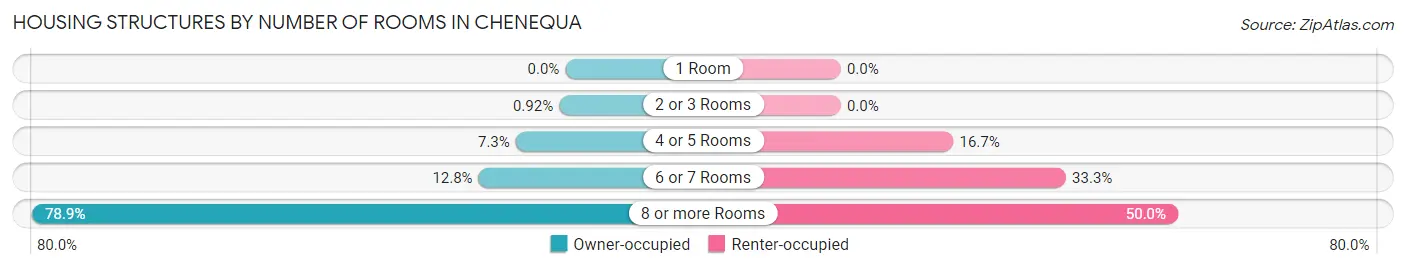
| Number of Rooms | Owner-occupied | Renter-occupied |
| 1 Room | 0 (0.0%) | 0 (0.0%) |
| 2 or 3 Rooms | 2 (0.9%) | 0 (0.0%) |
| 4 or 5 Rooms | 16 (7.3%) | 4 (16.7%) |
| 6 or 7 Rooms | 28 (12.8%) | 8 (33.3%) |
| 8 or more Rooms | 172 (78.9%) | 12 (50.0%) |
| Total | 218 (100.0%) | 24 (100.0%) |
Housing Structure by Heating Type in Chenequa
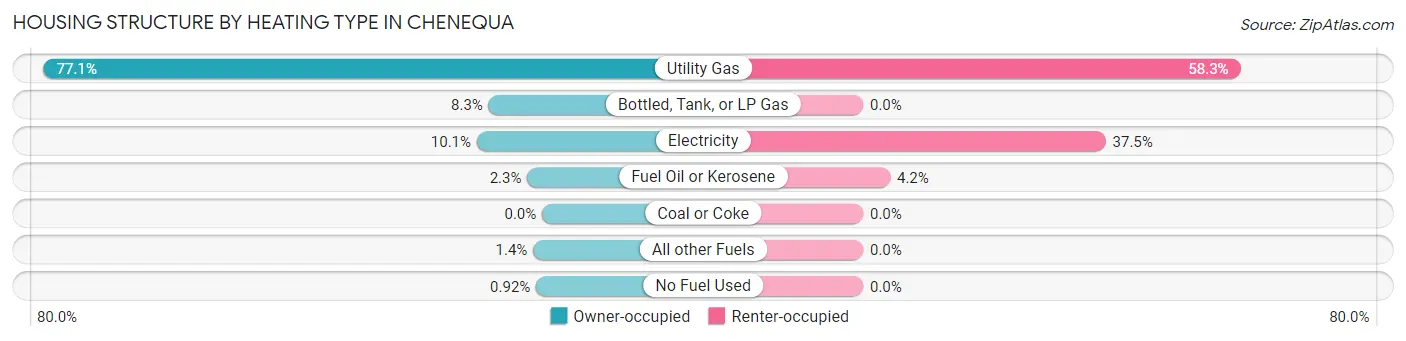
| Heating Type | Owner-occupied | Renter-occupied |
| Utility Gas | 168 (77.1%) | 14 (58.3%) |
| Bottled, Tank, or LP Gas | 18 (8.3%) | 0 (0.0%) |
| Electricity | 22 (10.1%) | 9 (37.5%) |
| Fuel Oil or Kerosene | 5 (2.3%) | 1 (4.2%) |
| Coal or Coke | 0 (0.0%) | 0 (0.0%) |
| All other Fuels | 3 (1.4%) | 0 (0.0%) |
| No Fuel Used | 2 (0.9%) | 0 (0.0%) |
| Total | 218 (100.0%) | 24 (100.0%) |
Household Vehicle Usage in Chenequa
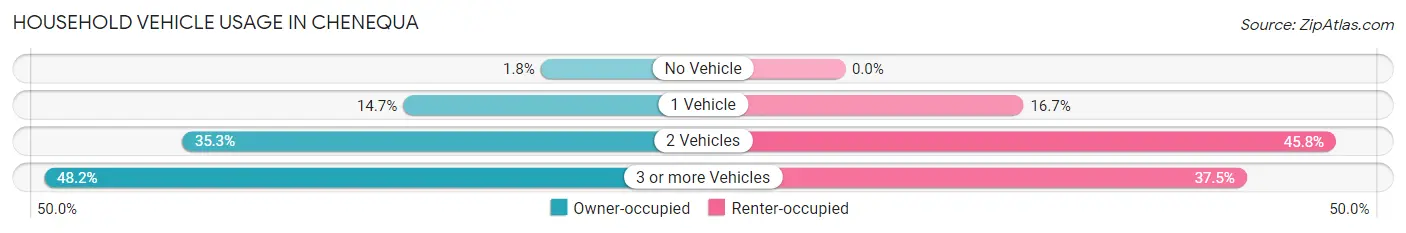
| Vehicles per Household | Owner-occupied | Renter-occupied |
| No Vehicle | 4 (1.8%) | 0 (0.0%) |
| 1 Vehicle | 32 (14.7%) | 4 (16.7%) |
| 2 Vehicles | 77 (35.3%) | 11 (45.8%) |
| 3 or more Vehicles | 105 (48.2%) | 9 (37.5%) |
| Total | 218 (100.0%) | 24 (100.0%) |
Real Estate & Mortgages in Chenequa
Real Estate and Mortgage Overview in Chenequa
| Characteristic | Without Mortgage | With Mortgage |
| Housing Units | 145 | 73 |
| Median Property Value | $1,517,900 | $1,117,200 |
| Median Household Income | $146,250 | $54 |
| Monthly Housing Costs | $1,501 | $61 |
| Real Estate Taxes | $10,001 | $0 |
Property Value by Mortgage Status in Chenequa
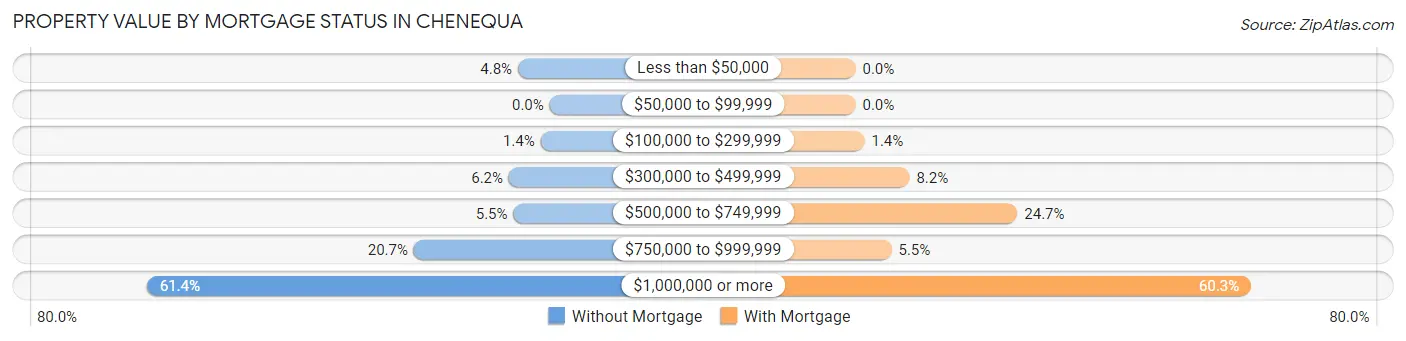
| Property Value | Without Mortgage | With Mortgage |
| Less than $50,000 | 7 (4.8%) | 0 (0.0%) |
| $50,000 to $99,999 | 0 (0.0%) | 0 (0.0%) |
| $100,000 to $299,999 | 2 (1.4%) | 1 (1.4%) |
| $300,000 to $499,999 | 9 (6.2%) | 6 (8.2%) |
| $500,000 to $749,999 | 8 (5.5%) | 18 (24.7%) |
| $750,000 to $999,999 | 30 (20.7%) | 4 (5.5%) |
| $1,000,000 or more | 89 (61.4%) | 44 (60.3%) |
| Total | 145 (100.0%) | 73 (100.0%) |
Household Income by Mortgage Status in Chenequa
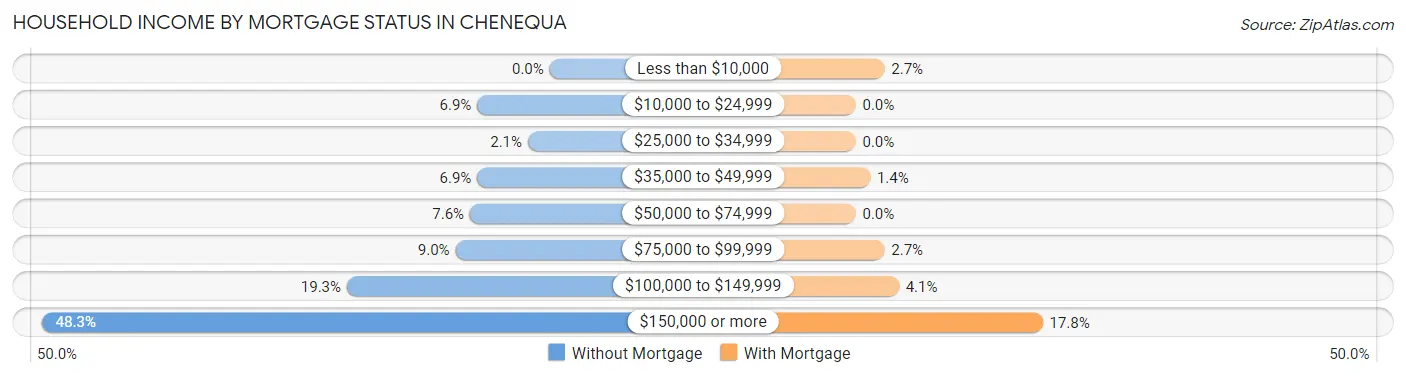
| Household Income | Without Mortgage | With Mortgage |
| Less than $10,000 | 0 (0.0%) | 2 (2.7%) |
| $10,000 to $24,999 | 10 (6.9%) | 0 (0.0%) |
| $25,000 to $34,999 | 3 (2.1%) | 0 (0.0%) |
| $35,000 to $49,999 | 10 (6.9%) | 1 (1.4%) |
| $50,000 to $74,999 | 11 (7.6%) | 0 (0.0%) |
| $75,000 to $99,999 | 13 (9.0%) | 2 (2.7%) |
| $100,000 to $149,999 | 28 (19.3%) | 3 (4.1%) |
| $150,000 or more | 70 (48.3%) | 13 (17.8%) |
| Total | 145 (100.0%) | 73 (100.0%) |
Property Value to Household Income Ratio in Chenequa
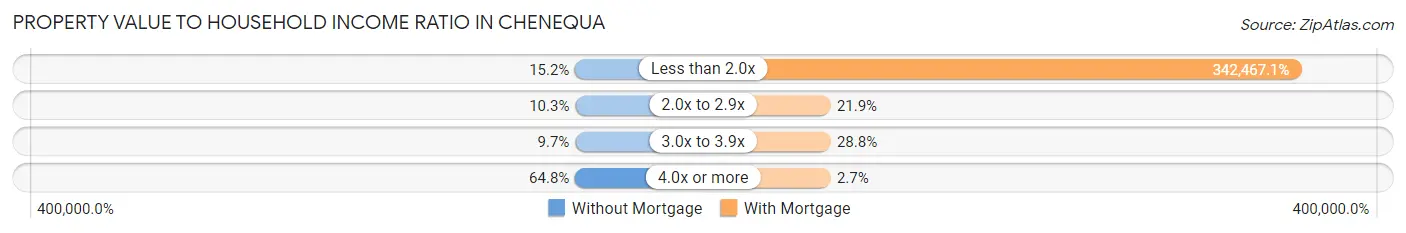
| Value-to-Income Ratio | Without Mortgage | With Mortgage |
| Less than 2.0x | 22 (15.2%) | 250,001 (342,467.1%) |
| 2.0x to 2.9x | 15 (10.3%) | 16 (21.9%) |
| 3.0x to 3.9x | 14 (9.7%) | 21 (28.8%) |
| 4.0x or more | 94 (64.8%) | 2 (2.7%) |
| Total | 145 (100.0%) | 73 (100.0%) |
Real Estate Taxes by Mortgage Status in Chenequa
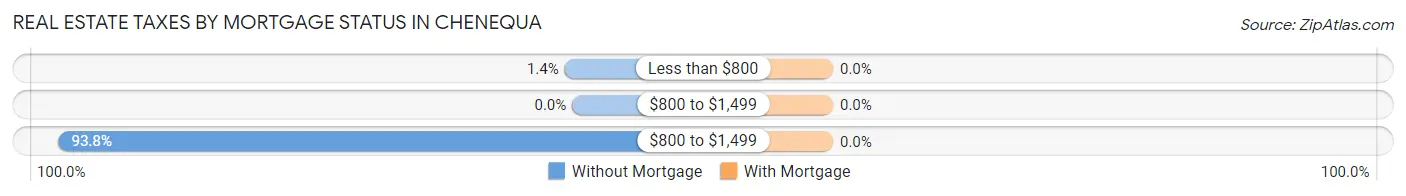
| Property Taxes | Without Mortgage | With Mortgage |
| Less than $800 | 2 (1.4%) | 0 (0.0%) |
| $800 to $1,499 | 0 (0.0%) | 0 (0.0%) |
| $800 to $1,499 | 136 (93.8%) | 0 (0.0%) |
| Total | 145 (100.0%) | 73 (100.0%) |
Health & Disability in Chenequa
Health Insurance Coverage by Age in Chenequa
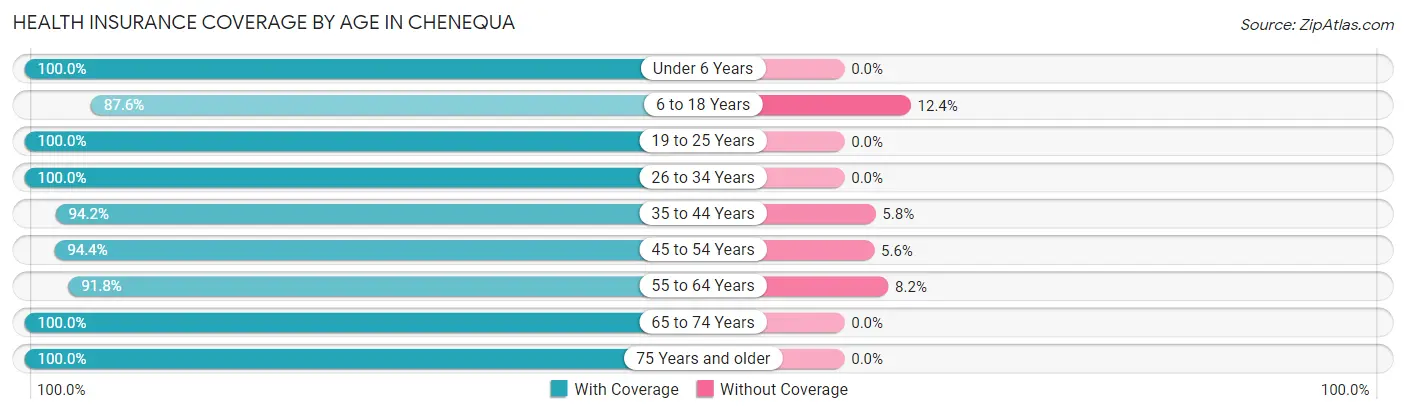
| Age Bracket | With Coverage | Without Coverage |
| Under 6 Years | 25 (100.0%) | 0 (0.0%) |
| 6 to 18 Years | 85 (87.6%) | 12 (12.4%) |
| 19 to 25 Years | 28 (100.0%) | 0 (0.0%) |
| 26 to 34 Years | 22 (100.0%) | 0 (0.0%) |
| 35 to 44 Years | 65 (94.2%) | 4 (5.8%) |
| 45 to 54 Years | 102 (94.4%) | 6 (5.6%) |
| 55 to 64 Years | 101 (91.8%) | 9 (8.2%) |
| 65 to 74 Years | 269 (100.0%) | 0 (0.0%) |
| 75 Years and older | 55 (100.0%) | 0 (0.0%) |
| Total | 752 (96.0%) | 31 (4.0%) |
Health Insurance Coverage by Citizenship Status in Chenequa
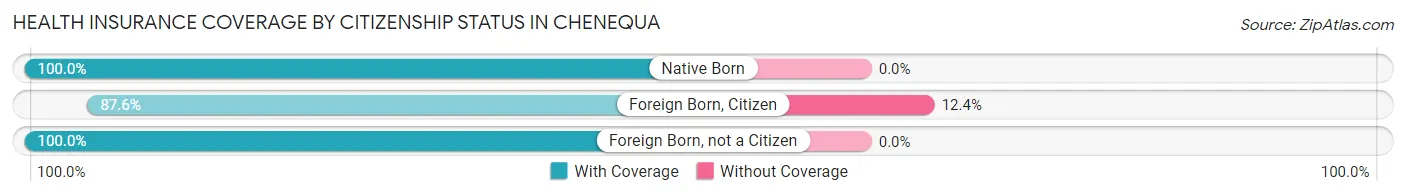
| Citizenship Status | With Coverage | Without Coverage |
| Native Born | 25 (100.0%) | 0 (0.0%) |
| Foreign Born, Citizen | 85 (87.6%) | 12 (12.4%) |
| Foreign Born, not a Citizen | 28 (100.0%) | 0 (0.0%) |
Health Insurance Coverage by Household Income in Chenequa
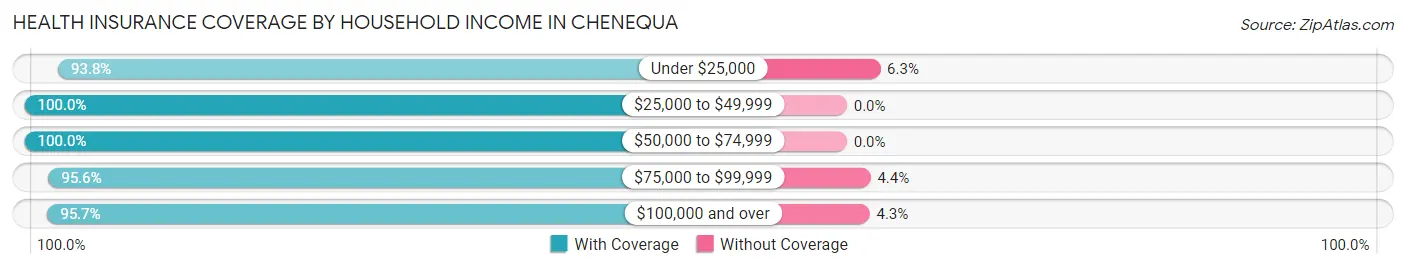
| Household Income | With Coverage | Without Coverage |
| Under $25,000 | 15 (93.8%) | 1 (6.2%) |
| $25,000 to $49,999 | 41 (100.0%) | 0 (0.0%) |
| $50,000 to $74,999 | 24 (100.0%) | 0 (0.0%) |
| $75,000 to $99,999 | 43 (95.6%) | 2 (4.4%) |
| $100,000 and over | 629 (95.7%) | 28 (4.3%) |
Public vs Private Health Insurance Coverage by Age in Chenequa
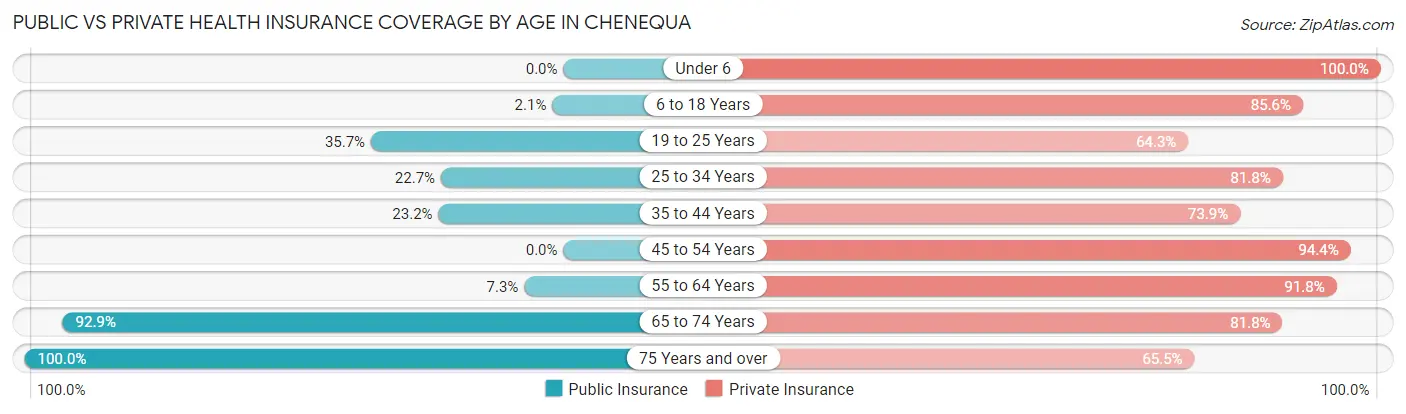
| Age Bracket | Public Insurance | Private Insurance |
| Under 6 | 0 (0.0%) | 25 (100.0%) |
| 6 to 18 Years | 2 (2.1%) | 83 (85.6%) |
| 19 to 25 Years | 10 (35.7%) | 18 (64.3%) |
| 25 to 34 Years | 5 (22.7%) | 18 (81.8%) |
| 35 to 44 Years | 16 (23.2%) | 51 (73.9%) |
| 45 to 54 Years | 0 (0.0%) | 102 (94.4%) |
| 55 to 64 Years | 8 (7.3%) | 101 (91.8%) |
| 65 to 74 Years | 250 (92.9%) | 220 (81.8%) |
| 75 Years and over | 55 (100.0%) | 36 (65.4%) |
| Total | 346 (44.2%) | 654 (83.5%) |
Disability Status by Sex by Age in Chenequa
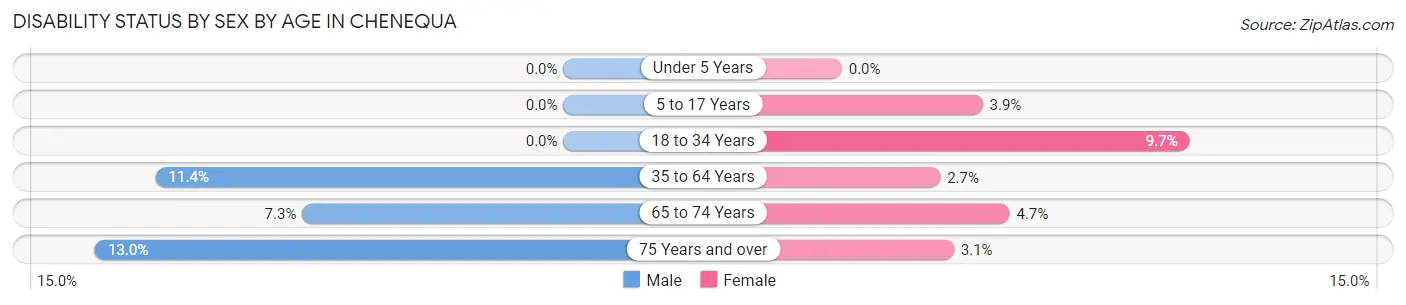
| Age Bracket | Male | Female |
| Under 5 Years | 0 (0.0%) | 0 (0.0%) |
| 5 to 17 Years | 0 (0.0%) | 2 (3.9%) |
| 18 to 34 Years | 0 (0.0%) | 3 (9.7%) |
| 35 to 64 Years | 16 (11.4%) | 4 (2.7%) |
| 65 to 74 Years | 4 (7.3%) | 10 (4.7%) |
| 75 Years and over | 3 (13.0%) | 1 (3.1%) |
Disability Class by Sex by Age in Chenequa
Disability Class: Hearing Difficulty
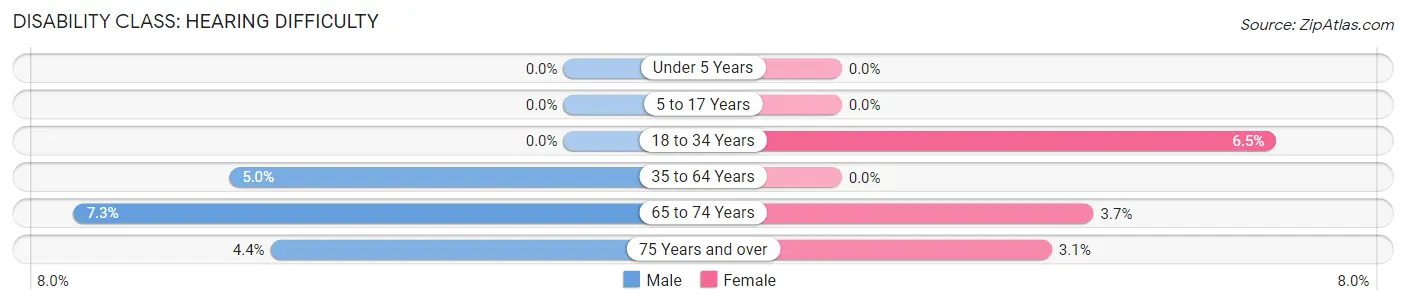
| Age Bracket | Male | Female |
| Under 5 Years | 0 (0.0%) | 0 (0.0%) |
| 5 to 17 Years | 0 (0.0%) | 0 (0.0%) |
| 18 to 34 Years | 0 (0.0%) | 2 (6.5%) |
| 35 to 64 Years | 7 (5.0%) | 0 (0.0%) |
| 65 to 74 Years | 4 (7.3%) | 8 (3.7%) |
| 75 Years and over | 1 (4.3%) | 1 (3.1%) |
Disability Class: Vision Difficulty
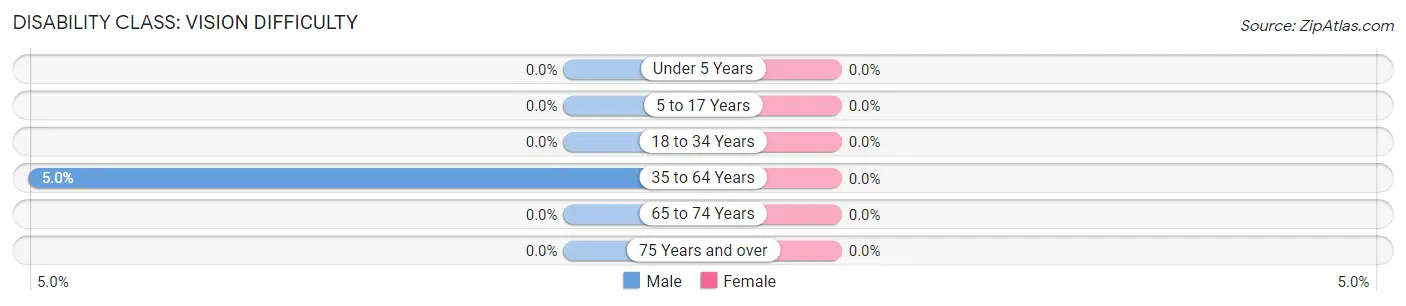
| Age Bracket | Male | Female |
| Under 5 Years | 0 (0.0%) | 0 (0.0%) |
| 5 to 17 Years | 0 (0.0%) | 0 (0.0%) |
| 18 to 34 Years | 0 (0.0%) | 0 (0.0%) |
| 35 to 64 Years | 7 (5.0%) | 0 (0.0%) |
| 65 to 74 Years | 0 (0.0%) | 0 (0.0%) |
| 75 Years and over | 0 (0.0%) | 0 (0.0%) |
Disability Class: Cognitive Difficulty
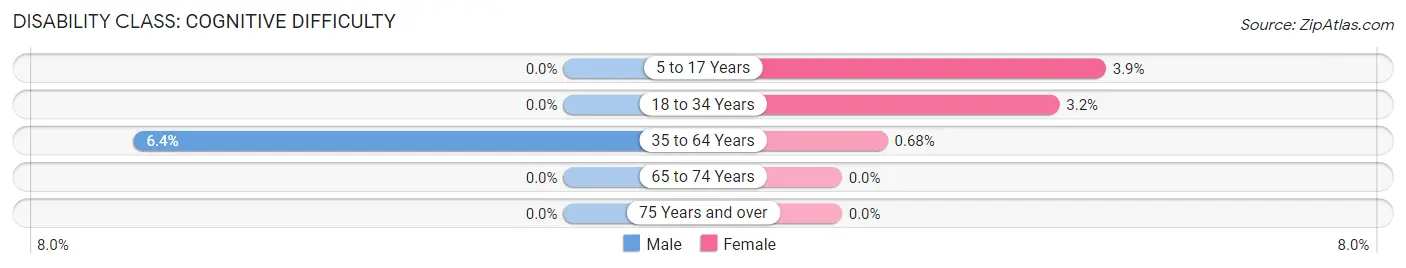
| Age Bracket | Male | Female |
| 5 to 17 Years | 0 (0.0%) | 2 (3.9%) |
| 18 to 34 Years | 0 (0.0%) | 1 (3.2%) |
| 35 to 64 Years | 9 (6.4%) | 1 (0.7%) |
| 65 to 74 Years | 0 (0.0%) | 0 (0.0%) |
| 75 Years and over | 0 (0.0%) | 0 (0.0%) |
Disability Class: Ambulatory Difficulty
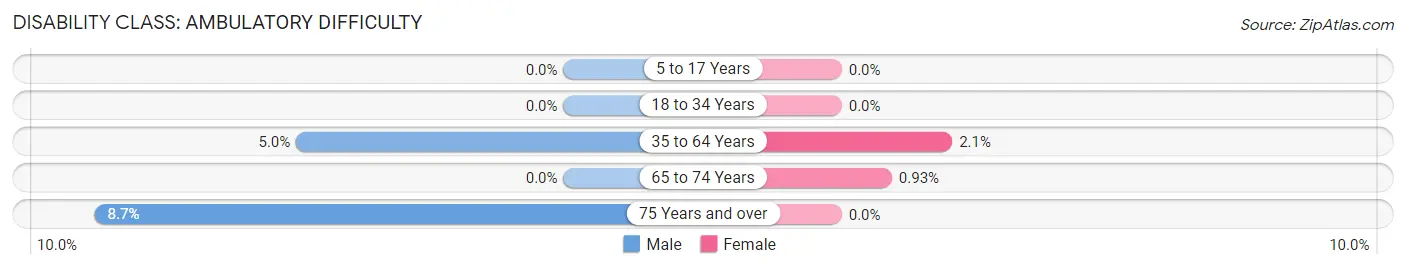
| Age Bracket | Male | Female |
| 5 to 17 Years | 0 (0.0%) | 0 (0.0%) |
| 18 to 34 Years | 0 (0.0%) | 0 (0.0%) |
| 35 to 64 Years | 7 (5.0%) | 3 (2.1%) |
| 65 to 74 Years | 0 (0.0%) | 2 (0.9%) |
| 75 Years and over | 2 (8.7%) | 0 (0.0%) |
Disability Class: Self-Care Difficulty
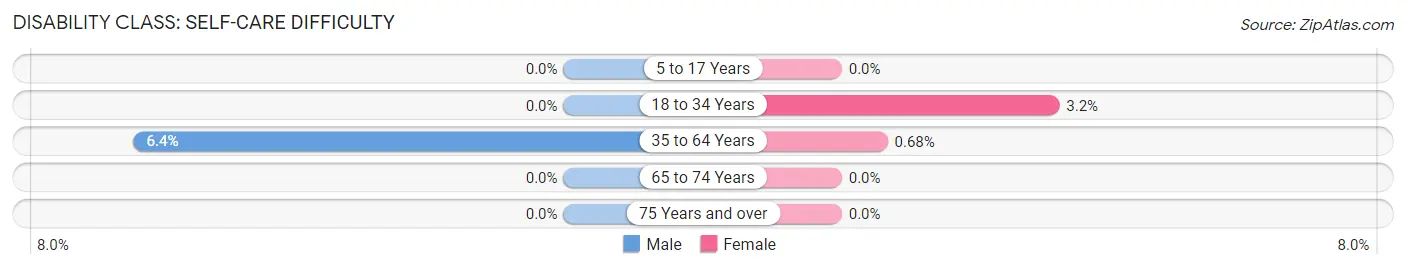
| Age Bracket | Male | Female |
| 5 to 17 Years | 0 (0.0%) | 0 (0.0%) |
| 18 to 34 Years | 0 (0.0%) | 1 (3.2%) |
| 35 to 64 Years | 9 (6.4%) | 1 (0.7%) |
| 65 to 74 Years | 0 (0.0%) | 0 (0.0%) |
| 75 Years and over | 0 (0.0%) | 0 (0.0%) |
Technology Access in Chenequa
Computing Device Access in Chenequa
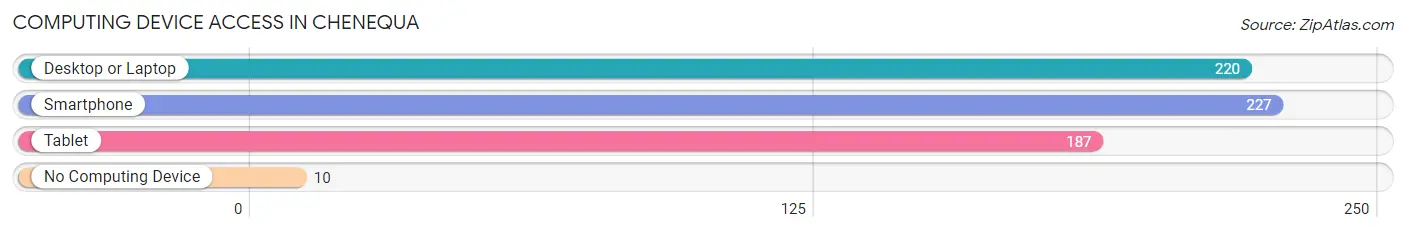
| Device Type | # Households | % Households |
| Desktop or Laptop | 220 | 90.9% |
| Smartphone | 227 | 93.8% |
| Tablet | 187 | 77.3% |
| No Computing Device | 10 | 4.1% |
| Total | 242 | 100.0% |
Internet Access in Chenequa
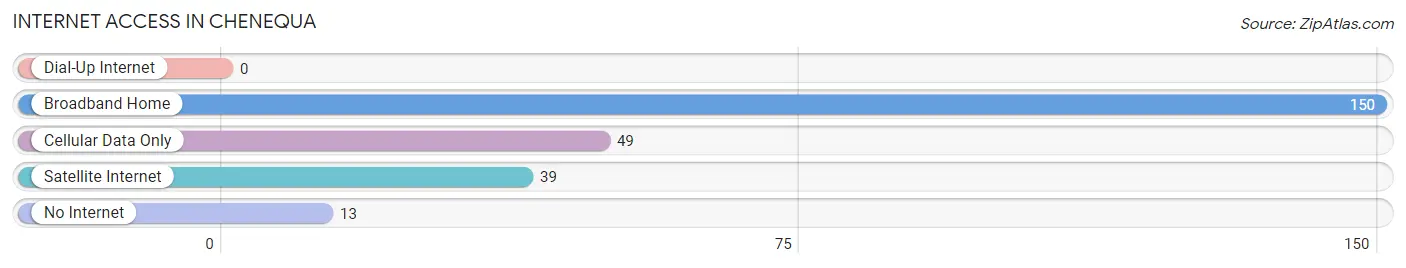
| Internet Type | # Households | % Households |
| Dial-Up Internet | 0 | 0.0% |
| Broadband Home | 150 | 62.0% |
| Cellular Data Only | 49 | 20.3% |
| Satellite Internet | 39 | 16.1% |
| No Internet | 13 | 5.4% |
| Total | 242 | 100.0% |
Chenequa Summary
Chenequa, Wisconsin is a small village located in Waukesha County, Wisconsin. It is situated on the western shore of Lake Nagawicka, about 25 miles northwest of Milwaukee. The village has a population of 1,717 people, according to the 2010 census.
History
Chenequa was first settled in 1845 by a group of settlers from New York. The village was originally known as “Chenequa Station” and was a stop on the Milwaukee and Mississippi Railroad. The village was officially incorporated in 1891.
Geography
Chenequa is located in Waukesha County, Wisconsin. It is situated on the western shore of Lake Nagawicka, about 25 miles northwest of Milwaukee. The village has a total area of 2.2 square miles, all of which is land. The terrain is mostly flat, with some rolling hills.
Economy
Chenequa’s economy is largely based on tourism and agriculture. The village is home to several small businesses, including a winery, a brewery, and a cheese factory. The village also has a number of restaurants, shops, and other services.
Demographics
According to the 2010 census, Chenequa has a population of 1,717 people. The racial makeup of the village is 97.2% White, 0.7% African American, 0.3% Native American, 0.3% Asian, 0.1% Pacific Islander, 0.4% from other races, and 1.0% from two or more races. The median household income is $90,917, and the median family income is $106,250.
Conclusion
Chenequa, Wisconsin is a small village located in Waukesha County, Wisconsin. It is situated on the western shore of Lake Nagawicka, about 25 miles northwest of Milwaukee. The village has a population of 1,717 people, according to the 2010 census. The village’s economy is largely based on tourism and agriculture, and it is home to several small businesses. The racial makeup of the village is 97.2% White, 0.7% African American, 0.3% Native American, 0.3% Asian, 0.1% Pacific Islander, 0.4% from other races, and 1.0% from two or more races. The median household income is $90,917, and the median family income is $106,250.
Common Questions
What is Per Capita Income in Chenequa?
Per Capita income in Chenequa is $477,831.
What is the Median Family Income in Chenequa?
Median Family Income in Chenequa is $250,001.
What is the Median Household income in Chenequa?
Median Household Income in Chenequa is $177,500.
What is Income or Wage Gap in Chenequa?
Income or Wage Gap in Chenequa is 71.9%.
Women in Chenequa earn 28.1 cents for every dollar earned by a man.
What is Inequality or Gini Index in Chenequa?
Inequality or Gini Index in Chenequa is 0.55.
What is the Total Population of Chenequa?
Total Population of Chenequa is 783.
What is the Total Male Population of Chenequa?
Total Male Population of Chenequa is 298.
What is the Total Female Population of Chenequa?
Total Female Population of Chenequa is 485.
What is the Ratio of Males per 100 Females in Chenequa?
There are 61.44 Males per 100 Females in Chenequa.
What is the Ratio of Females per 100 Males in Chenequa?
There are 162.75 Females per 100 Males in Chenequa.
What is the Median Population Age in Chenequa?
Median Population Age in Chenequa is 58.4 Years.
What is the Average Family Size in Chenequa
Average Family Size in Chenequa is 3.7 People.
What is the Average Household Size in Chenequa
Average Household Size in Chenequa is 3.2 People.
How Large is the Labor Force in Chenequa?
There are 275 People in the Labor Forcein in Chenequa.
What is the Percentage of People in the Labor Force in Chenequa?
40.0% of People are in the Labor Force in Chenequa.
What is the Unemployment Rate in Chenequa?
Unemployment Rate in Chenequa is 1.1%.