Waubeka, WI Map & Demographics
Waubeka Map
Waubeka Overview
$52,217
PER CAPITA INCOME
$62,344
AVG FAMILY INCOME
$61,042
AVG HOUSEHOLD INCOME
15.3%
WAGE / INCOME GAP [ % ]
84.7¢/ $1
WAGE / INCOME GAP [ $ ]
0.63
INEQUALITY / GINI INDEX
528
TOTAL POPULATION
258
MALE POPULATION
270
FEMALE POPULATION
95.56
MALES / 100 FEMALES
104.65
FEMALES / 100 MALES
53.9
MEDIAN AGE
2.5
AVG FAMILY SIZE
2.4
AVG HOUSEHOLD SIZE
345
LABOR FORCE [ PEOPLE ]
72.2%
PERCENT IN LABOR FORCE
7.8%
UNEMPLOYMENT RATE
Waubeka Area Codes
Income in Waubeka
Income Overview in Waubeka
Per Capita Income in Waubeka is $52,217, while median incomes of families and households are $62,344 and $61,042 respectively.
| Characteristic | Number | Measure |
| Per Capita Income | 528 | $52,217 |
| Median Family Income | 167 | $62,344 |
| Mean Family Income | 167 | $138,216 |
| Median Household Income | 214 | $61,042 |
| Mean Household Income | 214 | $118,737 |
| Income Deficit | 167 | $0 |
| Wage / Income Gap (%) | 528 | 15.31% |
| Wage / Income Gap ($) | 528 | 84.69¢ per $1 |
| Gini / Inequality Index | 528 | 0.63 |
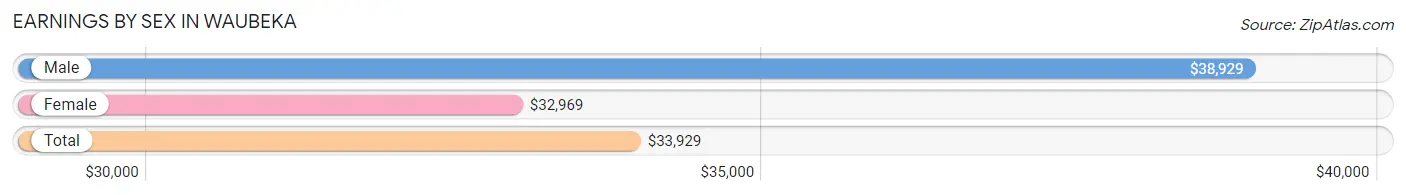
Earnings by Sex in Waubeka
Average Earnings in Waubeka are $33,929, $38,929 for men and $32,969 for women, a difference of 15.3%.
| Sex | Number | Average Earnings |
| Male | 164 (45.8%) | $38,929 |
| Female | 194 (54.2%) | $32,969 |
| Total | 358 (100.0%) | $33,929 |
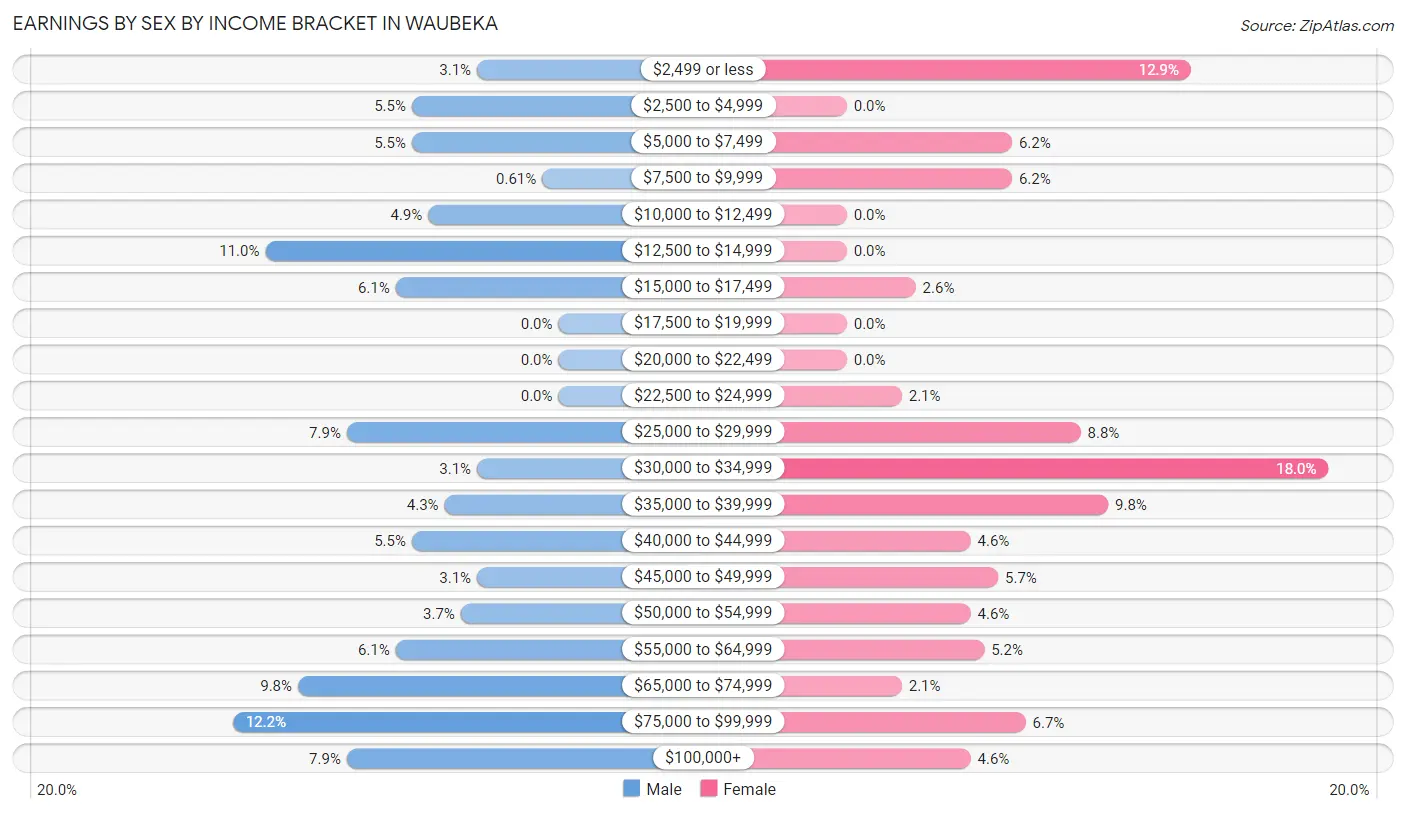
Earnings by Sex by Income Bracket in Waubeka
The most common earnings brackets in Waubeka are $75,000 to $99,999 for men (20 | 12.2%) and $30,000 to $34,999 for women (35 | 18.0%).
| Income | Male | Female |
| $2,499 or less | 5 (3.0%) | 25 (12.9%) |
| $2,500 to $4,999 | 9 (5.5%) | 0 (0.0%) |
| $5,000 to $7,499 | 9 (5.5%) | 12 (6.2%) |
| $7,500 to $9,999 | 1 (0.6%) | 12 (6.2%) |
| $10,000 to $12,499 | 8 (4.9%) | 0 (0.0%) |
| $12,500 to $14,999 | 18 (11.0%) | 0 (0.0%) |
| $15,000 to $17,499 | 10 (6.1%) | 5 (2.6%) |
| $17,500 to $19,999 | 0 (0.0%) | 0 (0.0%) |
| $20,000 to $22,499 | 0 (0.0%) | 0 (0.0%) |
| $22,500 to $24,999 | 0 (0.0%) | 4 (2.1%) |
| $25,000 to $29,999 | 13 (7.9%) | 17 (8.8%) |
| $30,000 to $34,999 | 5 (3.0%) | 35 (18.0%) |
| $35,000 to $39,999 | 7 (4.3%) | 19 (9.8%) |
| $40,000 to $44,999 | 9 (5.5%) | 9 (4.6%) |
| $45,000 to $49,999 | 5 (3.0%) | 11 (5.7%) |
| $50,000 to $54,999 | 6 (3.7%) | 9 (4.6%) |
| $55,000 to $64,999 | 10 (6.1%) | 10 (5.1%) |
| $65,000 to $74,999 | 16 (9.8%) | 4 (2.1%) |
| $75,000 to $99,999 | 20 (12.2%) | 13 (6.7%) |
| $100,000+ | 13 (7.9%) | 9 (4.6%) |
| Total | 164 (100.0%) | 194 (100.0%) |
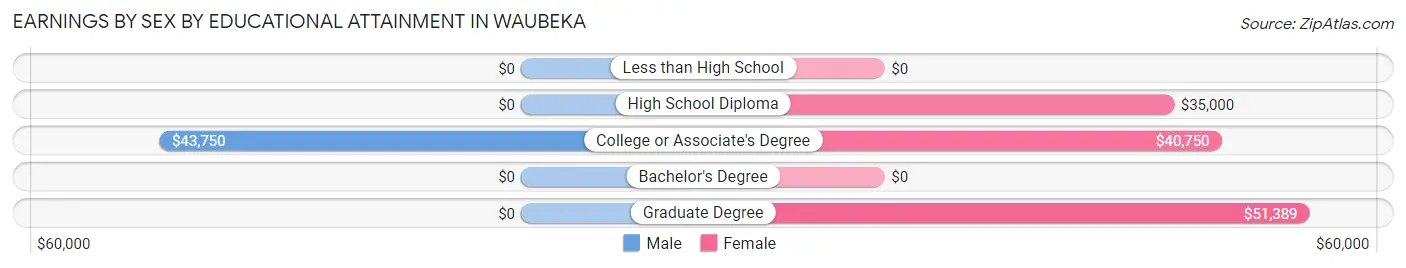
Earnings by Sex by Educational Attainment in Waubeka
Average earnings in Waubeka are $48,750 for men and $37,039 for women, a difference of 24.0%. Men with an educational attainment of college or associate's degree enjoy the highest average annual earnings of $43,750, while those with college or associate's degree education earn the least with $43,750. Women with an educational attainment of graduate degree earn the most with the average annual earnings of $51,389, while those with high school diploma education have the smallest earnings of $35,000.
| Educational Attainment | Male Income | Female Income |
| Less than High School | - | - |
| High School Diploma | - | - |
| College or Associate's Degree | $43,750 | $40,750 |
| Bachelor's Degree | - | - |
| Graduate Degree | - | - |
| Total | $48,750 | $37,039 |
Family Income in Waubeka
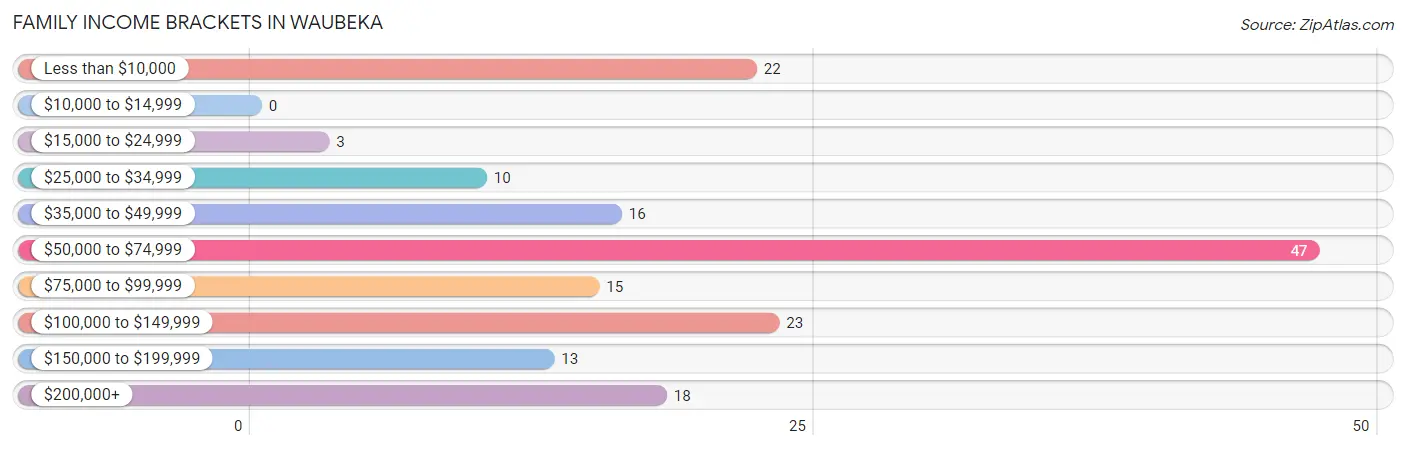
Family Income Brackets in Waubeka
According to the Waubeka family income data, there are 47 families falling into the $50,000 to $74,999 income range, which is the most common income bracket and makes up 28.1% of all families.
| Income Bracket | # Families | % Families |
| Less than $10,000 | 22 | 13.2% |
| $10,000 to $14,999 | 0 | 0.0% |
| $15,000 to $24,999 | 3 | 1.8% |
| $25,000 to $34,999 | 10 | 6.0% |
| $35,000 to $49,999 | 16 | 9.6% |
| $50,000 to $74,999 | 47 | 28.1% |
| $75,000 to $99,999 | 15 | 9.0% |
| $100,000 to $149,999 | 23 | 13.8% |
| $150,000 to $199,999 | 13 | 7.8% |
| $200,000+ | 18 | 10.8% |
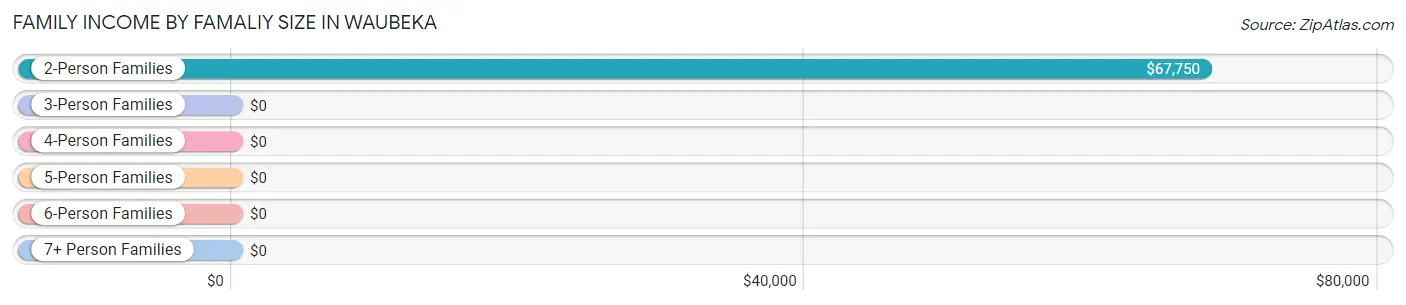
Family Income by Famaliy Size in Waubeka
2-person families (118 | 70.7%) account for the highest median family income in Waubeka with $67,750 per family, while 2-person families (118 | 70.7%) have the highest median income of $33,875 per family member.
| Income Bracket | # Families | Median Income |
| 2-Person Families | 118 (70.7%) | $67,750 |
| 3-Person Families | 31 (18.6%) | $0 |
| 4-Person Families | 11 (6.6%) | $0 |
| 5-Person Families | 7 (4.2%) | $0 |
| 6-Person Families | 0 (0.0%) | $0 |
| 7+ Person Families | 0 (0.0%) | $0 |
| Total | 167 (100.0%) | $62,344 |
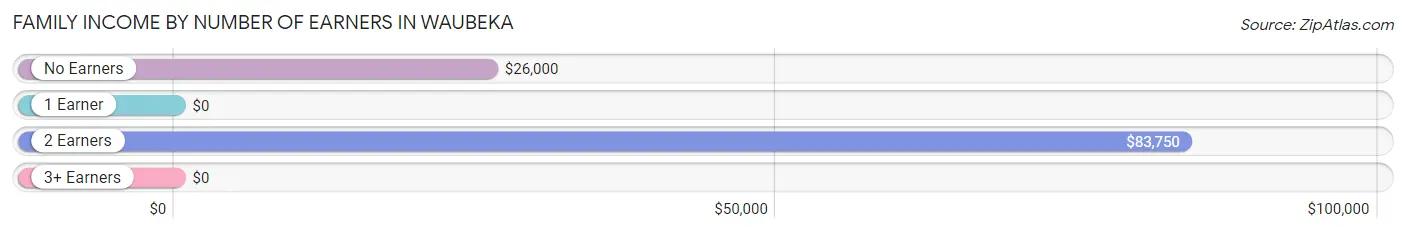
Family Income by Number of Earners in Waubeka
| Number of Earners | # Families | Median Income |
| No Earners | 28 (16.8%) | $26,000 |
| 1 Earner | 28 (16.8%) | $0 |
| 2 Earners | 83 (49.7%) | $83,750 |
| 3+ Earners | 28 (16.8%) | $0 |
| Total | 167 (100.0%) | $62,344 |
Household Income in Waubeka
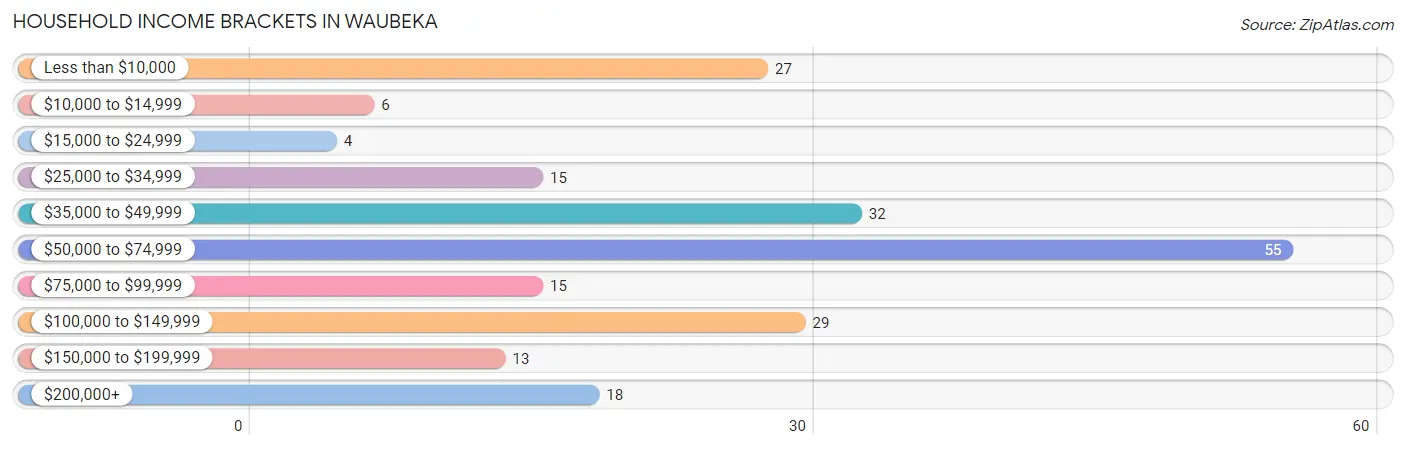
Household Income Brackets in Waubeka
With 55 households falling in the category, the $50,000 to $74,999 income range is the most frequent in Waubeka, accounting for 25.7% of all households. In contrast, only 4 households (1.9%) fall into the $15,000 to $24,999 income bracket, making it the least populous group.
| Income Bracket | # Households | % Households |
| Less than $10,000 | 27 | 12.6% |
| $10,000 to $14,999 | 6 | 2.8% |
| $15,000 to $24,999 | 4 | 1.9% |
| $25,000 to $34,999 | 15 | 7.0% |
| $35,000 to $49,999 | 32 | 15.0% |
| $50,000 to $74,999 | 55 | 25.7% |
| $75,000 to $99,999 | 15 | 7.0% |
| $100,000 to $149,999 | 29 | 13.6% |
| $150,000 to $199,999 | 13 | 6.1% |
| $200,000+ | 18 | 8.4% |
Household Income by Householder Age in Waubeka
The median household income in Waubeka is $61,042, with the highest median household income of $70,250 found in the 45 to 64 years age bracket for the primary householder. A total of 119 households (55.6%) fall into this category. Meanwhile, the 15 to 24 years age bracket for the primary householder has the lowest median household income of $0, with 17 households (7.9%) in this group.
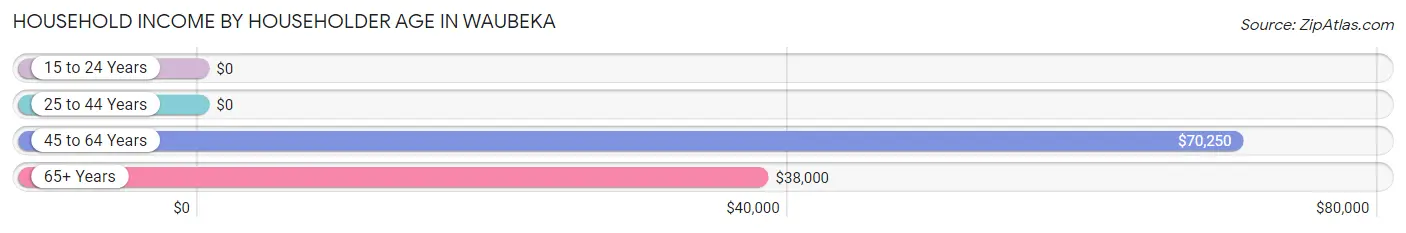
| Income Bracket | # Households | Median Income |
| 15 to 24 Years | 17 (7.9%) | $0 |
| 25 to 44 Years | 20 (9.3%) | $0 |
| 45 to 64 Years | 119 (55.6%) | $70,250 |
| 65+ Years | 58 (27.1%) | $38,000 |
| Total | 214 (100.0%) | $61,042 |
Poverty in Waubeka
Income Below Poverty by Sex and Age in Waubeka
With 22.7% poverty level for males and 10.6% for females among the residents of Waubeka, 12 to 14 year old males and 16 and 17 year old females are the most vulnerable to poverty, with 5 males (100.0%) and 8 females (100.0%) in their respective age groups living below the poverty level.
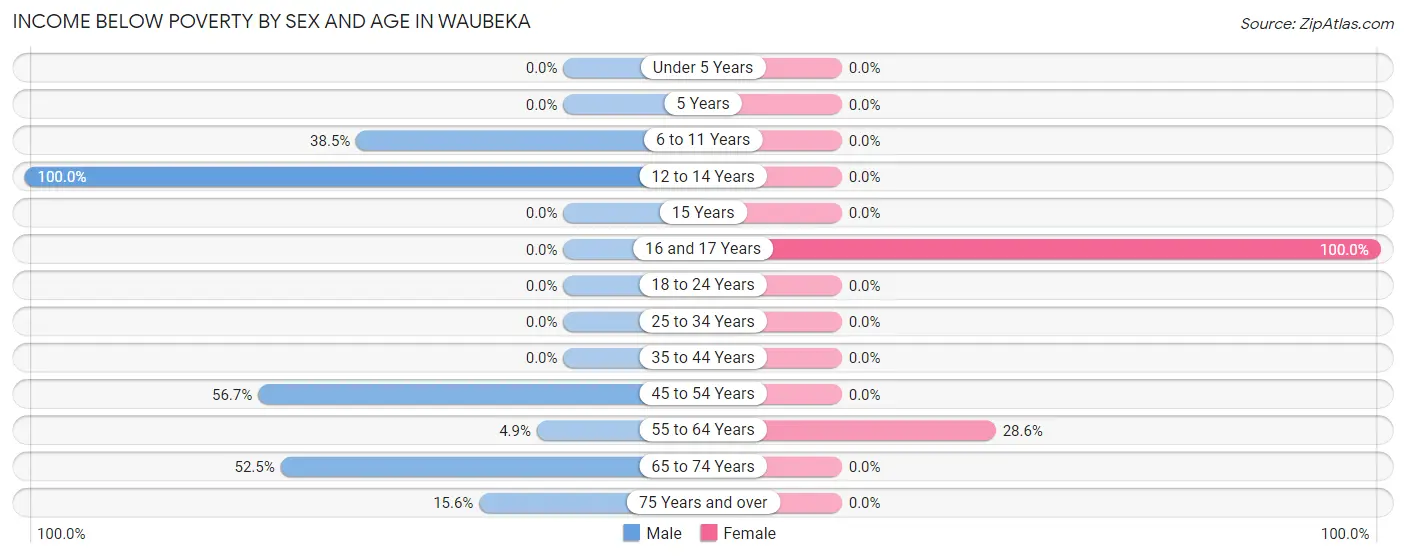
| Age Bracket | Male | Female |
| Under 5 Years | 0 (0.0%) | 0 (0.0%) |
| 5 Years | 0 (0.0%) | 0 (0.0%) |
| 6 to 11 Years | 5 (38.5%) | 0 (0.0%) |
| 12 to 14 Years | 5 (100.0%) | 0 (0.0%) |
| 15 Years | 0 (0.0%) | 0 (0.0%) |
| 16 and 17 Years | 0 (0.0%) | 8 (100.0%) |
| 18 to 24 Years | 0 (0.0%) | 0 (0.0%) |
| 25 to 34 Years | 0 (0.0%) | 0 (0.0%) |
| 35 to 44 Years | 0 (0.0%) | 0 (0.0%) |
| 45 to 54 Years | 17 (56.7%) | 0 (0.0%) |
| 55 to 64 Years | 3 (4.9%) | 20 (28.6%) |
| 65 to 74 Years | 21 (52.5%) | 0 (0.0%) |
| 75 Years and over | 5 (15.6%) | 0 (0.0%) |
| Total | 56 (22.7%) | 28 (10.6%) |
Income Above Poverty by Sex and Age in Waubeka
According to the poverty statistics in Waubeka, males aged 18 to 24 years and females aged under 5 years are the age groups that are most secure financially, with 100.0% of males and 100.0% of females in these age groups living above the poverty line.
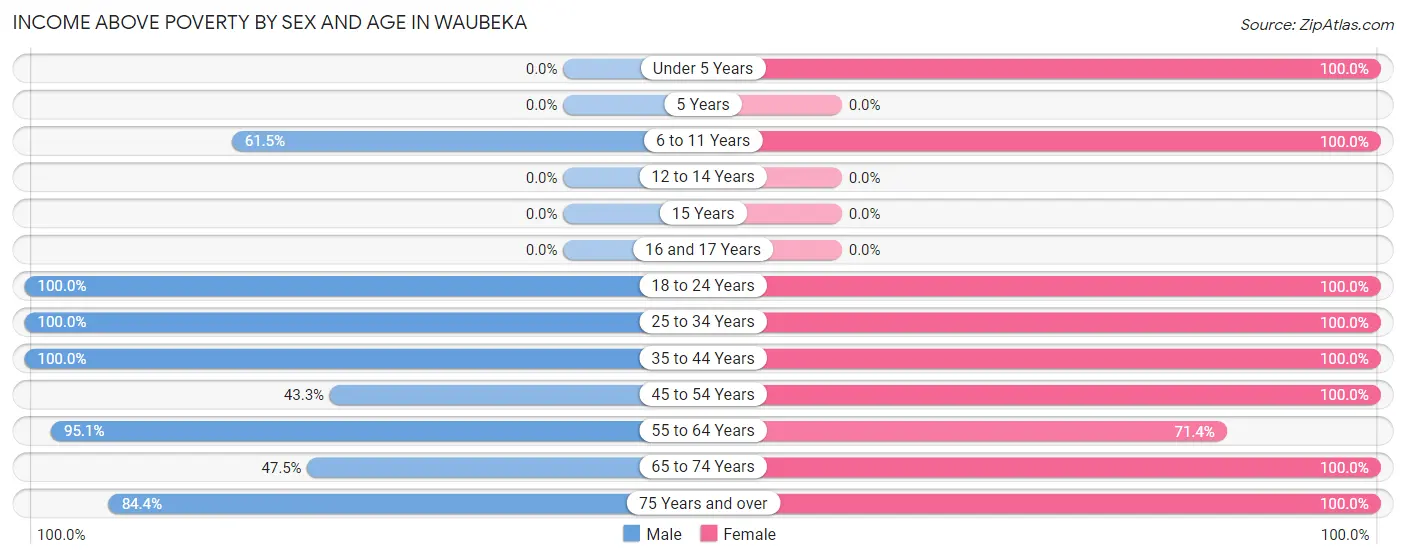
| Age Bracket | Male | Female |
| Under 5 Years | 0 (0.0%) | 4 (100.0%) |
| 5 Years | 0 (0.0%) | 0 (0.0%) |
| 6 to 11 Years | 8 (61.5%) | 10 (100.0%) |
| 12 to 14 Years | 0 (0.0%) | 0 (0.0%) |
| 15 Years | 0 (0.0%) | 0 (0.0%) |
| 16 and 17 Years | 0 (0.0%) | 0 (0.0%) |
| 18 to 24 Years | 29 (100.0%) | 57 (100.0%) |
| 25 to 34 Years | 14 (100.0%) | 6 (100.0%) |
| 35 to 44 Years | 23 (100.0%) | 33 (100.0%) |
| 45 to 54 Years | 13 (43.3%) | 35 (100.0%) |
| 55 to 64 Years | 58 (95.1%) | 50 (71.4%) |
| 65 to 74 Years | 19 (47.5%) | 35 (100.0%) |
| 75 Years and over | 27 (84.4%) | 5 (100.0%) |
| Total | 191 (77.3%) | 235 (89.3%) |
Income Below Poverty Among Married-Couple Families in Waubeka
The poverty statistics for married-couple families in Waubeka show that 10.6% or 16 of the total 151 families live below the poverty line. Families with no children have the highest poverty rate of 11.0%, comprising of 16 families. On the other hand, families with 1 or 2 children have the lowest poverty rate of 0.0%, which includes 0 families.
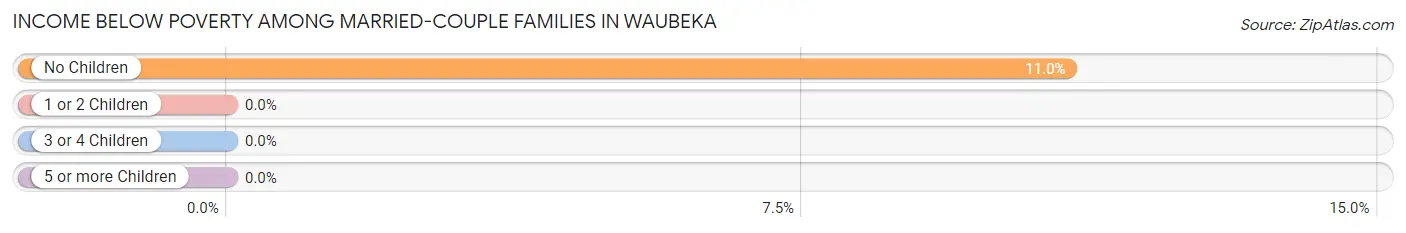
| Children | Above Poverty | Below Poverty |
| No Children | 130 (89.0%) | 16 (11.0%) |
| 1 or 2 Children | 5 (100.0%) | 0 (0.0%) |
| 3 or 4 Children | 0 (0.0%) | 0 (0.0%) |
| 5 or more Children | 0 (0.0%) | 0 (0.0%) |
| Total | 135 (89.4%) | 16 (10.6%) |
Income Below Poverty Among Single-Parent Households in Waubeka
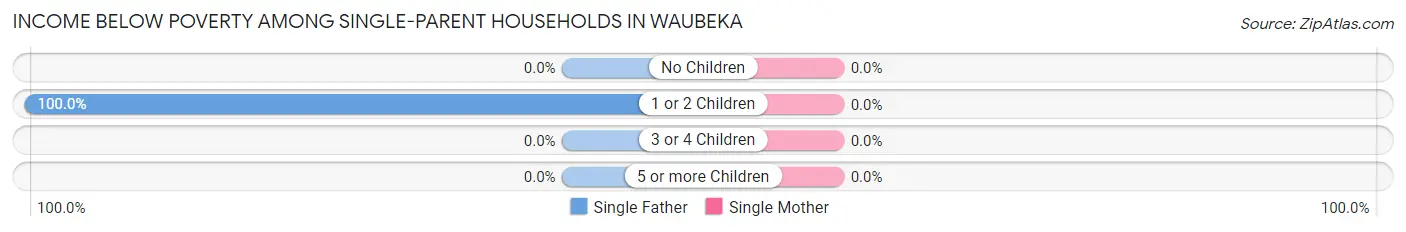
| Children | Single Father | Single Mother |
| No Children | 0 (0.0%) | 0 (0.0%) |
| 1 or 2 Children | 6 (100.0%) | 0 (0.0%) |
| 3 or 4 Children | 0 (0.0%) | 0 (0.0%) |
| 5 or more Children | 0 (0.0%) | 0 (0.0%) |
| Total | 6 (37.5%) | 0 (0.0%) |
Income Below Poverty Among Married-Couple vs Single-Parent Households in Waubeka
The poverty data for Waubeka shows that 16 of the married-couple family households (10.6%) and 6 of the single-parent households (37.5%) are living below the poverty level. Within the married-couple family households, those with no children have the highest poverty rate, with 16 households (11.0%) falling below the poverty line. Among the single-parent households, those with 1 or 2 children have the highest poverty rate, with 6 household (100.0%) living below poverty.
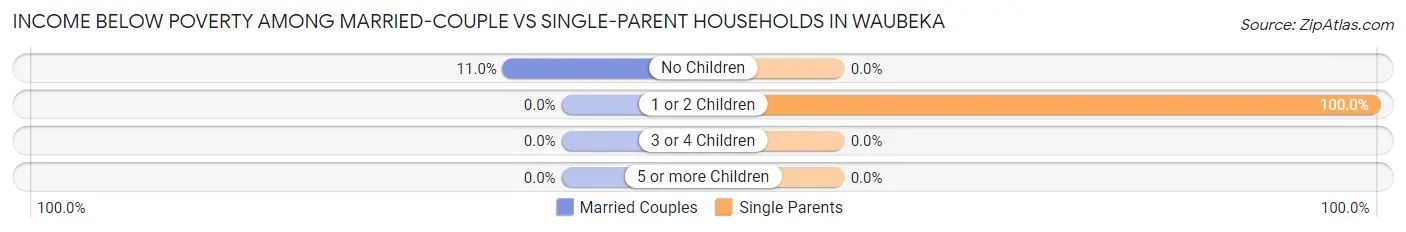
| Children | Married-Couple Families | Single-Parent Households |
| No Children | 16 (11.0%) | 0 (0.0%) |
| 1 or 2 Children | 0 (0.0%) | 6 (100.0%) |
| 3 or 4 Children | 0 (0.0%) | 0 (0.0%) |
| 5 or more Children | 0 (0.0%) | 0 (0.0%) |
| Total | 16 (10.6%) | 6 (37.5%) |
Race in Waubeka
The most populous races in Waubeka are White / Caucasian (493 | 93.4%), Hispanic or Latino (36 | 6.8%), and Black / African American (22 | 4.2%).
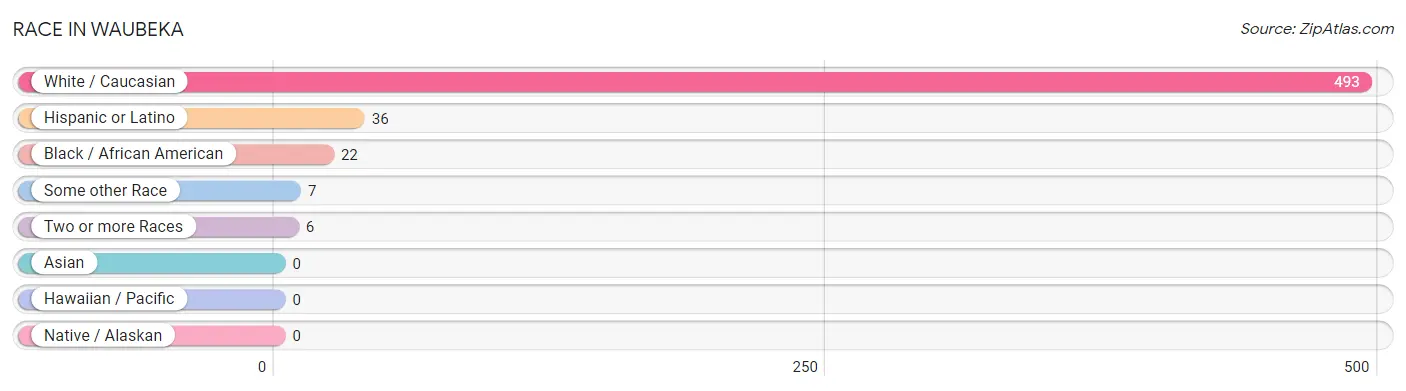
| Race | # Population | % Population |
| Asian | 0 | 0.0% |
| Black / African American | 22 | 4.2% |
| Hawaiian / Pacific | 0 | 0.0% |
| Hispanic or Latino | 36 | 6.8% |
| Native / Alaskan | 0 | 0.0% |
| White / Caucasian | 493 | 93.4% |
| Two or more Races | 6 | 1.1% |
| Some other Race | 7 | 1.3% |
| Total | 528 | 100.0% |
Ancestry in Waubeka
The most populous ancestries reported in Waubeka are German (223 | 42.2%), Irish (80 | 15.1%), American (61 | 11.6%), Polish (32 | 6.1%), and Czech (24 | 4.5%), together accounting for 79.5% of all Waubeka residents.
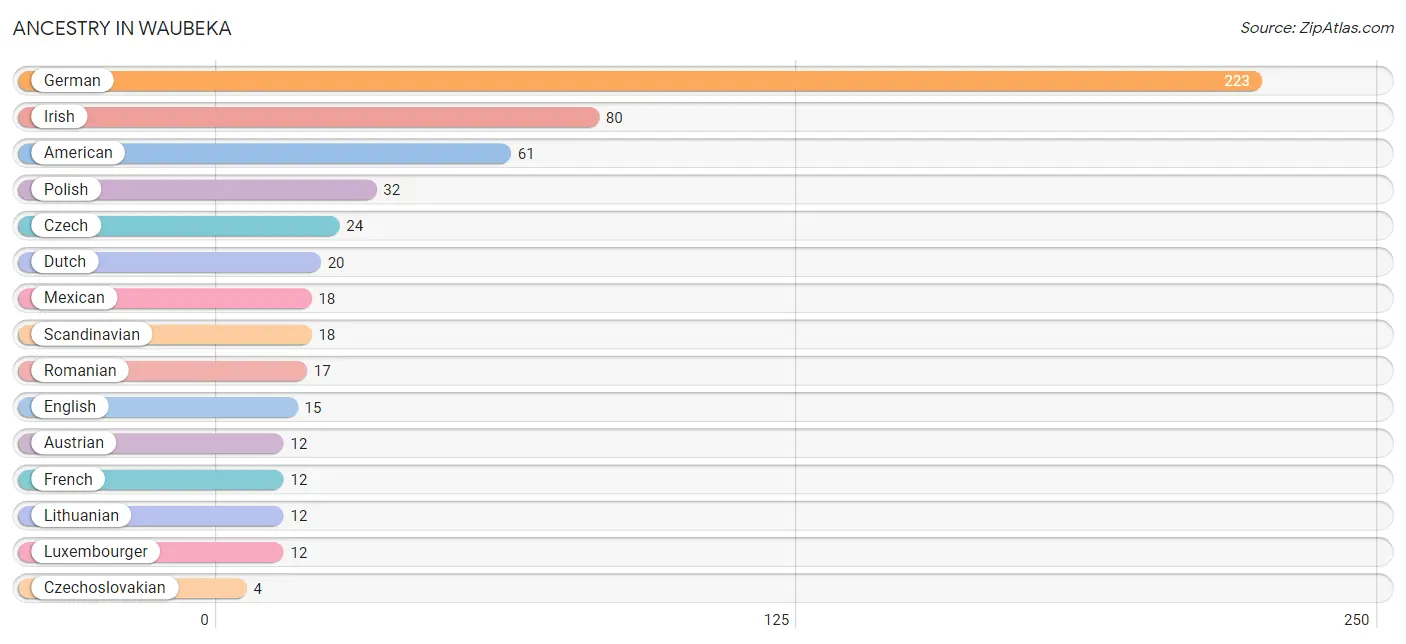
| Ancestry | # Population | % Population |
| American | 61 | 11.6% |
| Austrian | 12 | 2.3% |
| Czech | 24 | 4.5% |
| Czechoslovakian | 4 | 0.8% |
| Dutch | 20 | 3.8% |
| Eastern European | 3 | 0.6% |
| English | 15 | 2.8% |
| French | 12 | 2.3% |
| German | 223 | 42.2% |
| Irish | 80 | 15.1% |
| Lithuanian | 12 | 2.3% |
| Luxembourger | 12 | 2.3% |
| Mexican | 18 | 3.4% |
| Norwegian | 3 | 0.6% |
| Polish | 32 | 6.1% |
| Romanian | 17 | 3.2% |
| Scandinavian | 18 | 3.4% |
| Scottish | 3 | 0.6% | View All 18 Rows |
Immigrants in Waubeka
The most numerous immigrant groups reported in Waubeka came from Central America (12 | 2.3%), Latin America (12 | 2.3%), and Mexico (12 | 2.3%), together accounting for 6.8% of all Waubeka residents.
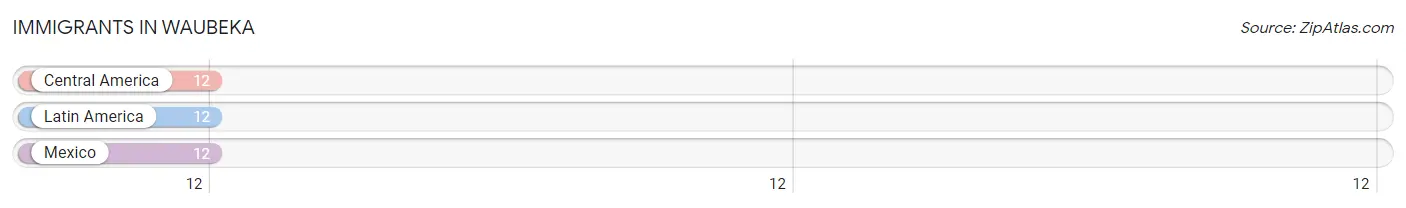
| Immigration Origin | # Population | % Population |
| Central America | 12 | 2.3% |
| Latin America | 12 | 2.3% |
| Mexico | 12 | 2.3% | View All 3 Rows |
Sex and Age in Waubeka
Sex and Age in Waubeka
The most populous age groups in Waubeka are 55 to 59 Years (43 | 16.7%) for men and 60 to 64 Years (38 | 14.1%) for women.
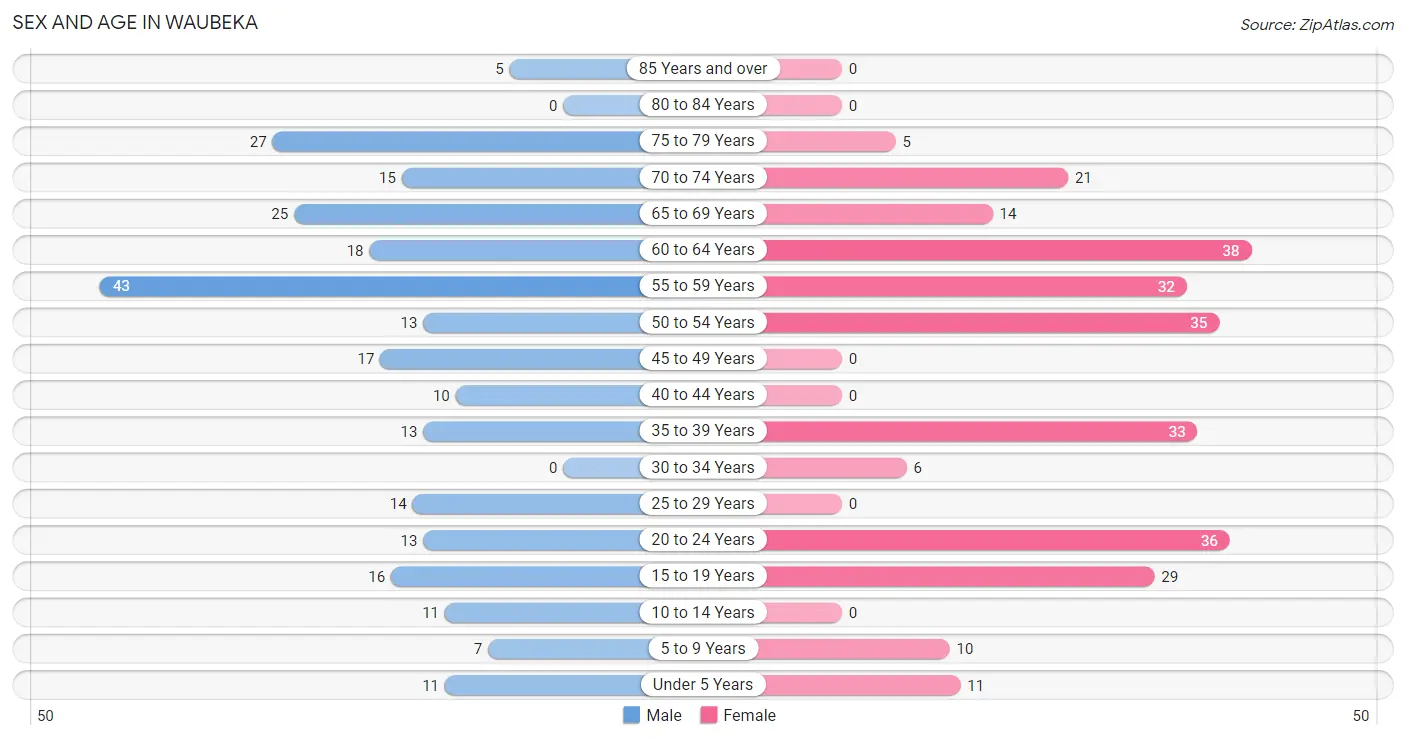
| Age Bracket | Male | Female |
| Under 5 Years | 11 (4.3%) | 11 (4.1%) |
| 5 to 9 Years | 7 (2.7%) | 10 (3.7%) |
| 10 to 14 Years | 11 (4.3%) | 0 (0.0%) |
| 15 to 19 Years | 16 (6.2%) | 29 (10.7%) |
| 20 to 24 Years | 13 (5.0%) | 36 (13.3%) |
| 25 to 29 Years | 14 (5.4%) | 0 (0.0%) |
| 30 to 34 Years | 0 (0.0%) | 6 (2.2%) |
| 35 to 39 Years | 13 (5.0%) | 33 (12.2%) |
| 40 to 44 Years | 10 (3.9%) | 0 (0.0%) |
| 45 to 49 Years | 17 (6.6%) | 0 (0.0%) |
| 50 to 54 Years | 13 (5.0%) | 35 (13.0%) |
| 55 to 59 Years | 43 (16.7%) | 32 (11.8%) |
| 60 to 64 Years | 18 (7.0%) | 38 (14.1%) |
| 65 to 69 Years | 25 (9.7%) | 14 (5.2%) |
| 70 to 74 Years | 15 (5.8%) | 21 (7.8%) |
| 75 to 79 Years | 27 (10.5%) | 5 (1.8%) |
| 80 to 84 Years | 0 (0.0%) | 0 (0.0%) |
| 85 Years and over | 5 (1.9%) | 0 (0.0%) |
| Total | 258 (100.0%) | 270 (100.0%) |
Families and Households in Waubeka
Median Family Size in Waubeka
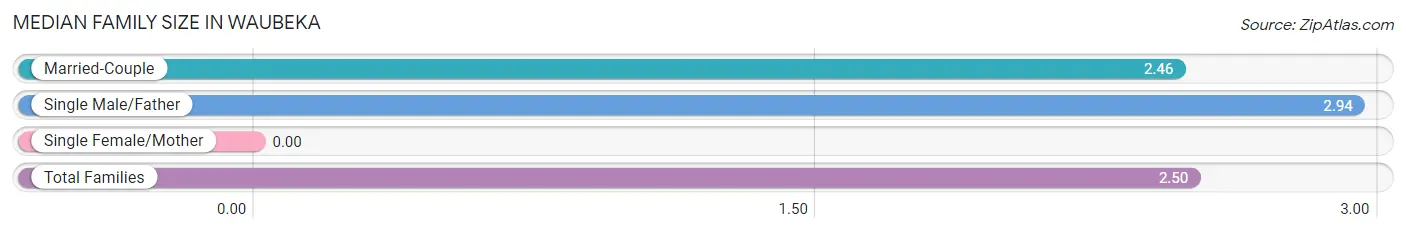
| Family Type | # Families | Family Size |
| Married-Couple | 151 (90.4%) | 2.46 |
| Single Male/Father | 16 (9.6%) | 2.94 |
| Single Female/Mother | 0 (0.0%) | - |
| Total Families | 167 (100.0%) | 2.50 |
Median Household Size in Waubeka
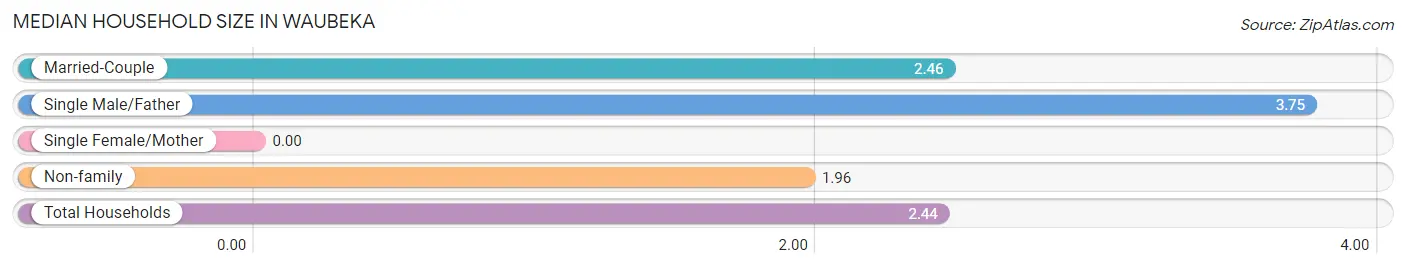
| Household Type | # Households | Household Size |
| Married-Couple | 151 (70.6%) | 2.46 |
| Single Male/Father | 16 (7.5%) | 3.75 |
| Single Female/Mother | 0 (0.0%) | - |
| Non-family | 47 (22.0%) | 1.96 |
| Total Households | 214 (100.0%) | 2.44 |
Household Size by Marriage Status in Waubeka
Out of a total of 214 households in Waubeka, 167 (78.0%) are family households, while 47 (22.0%) are nonfamily households. The most numerous type of family households are 2-person households, comprising 118, and the most common type of nonfamily households are 1-person households, comprising 27.
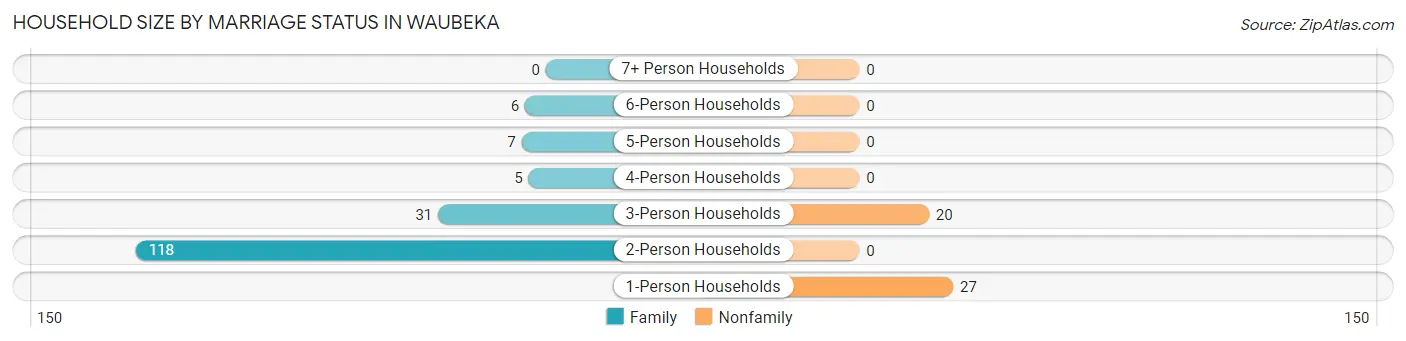
| Household Size | Family Households | Nonfamily Households |
| 1-Person Households | - | 27 (12.6%) |
| 2-Person Households | 118 (55.1%) | 0 (0.0%) |
| 3-Person Households | 31 (14.5%) | 20 (9.3%) |
| 4-Person Households | 5 (2.3%) | 0 (0.0%) |
| 5-Person Households | 7 (3.3%) | 0 (0.0%) |
| 6-Person Households | 6 (2.8%) | 0 (0.0%) |
| 7+ Person Households | 0 (0.0%) | 0 (0.0%) |
| Total | 167 (78.0%) | 47 (22.0%) |
Female Fertility in Waubeka
Fertility by Age in Waubeka
Average fertility rate in Waubeka is 58.0 births per 1,000 women. Women in the age bracket of 20 to 34 years have the highest fertility rate with 143.0 births per 1,000 women. Women in the age bracket of 20 to 34 years acount for 100.0% of all women with births.
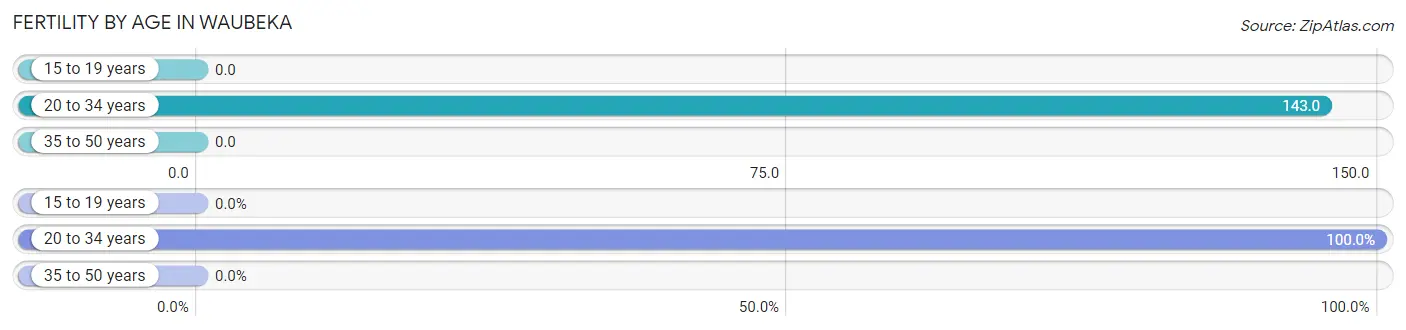
| Age Bracket | Women with Births | Births / 1,000 Women |
| 15 to 19 years | 0 (0.0%) | 0.0 |
| 20 to 34 years | 6 (100.0%) | 143.0 |
| 35 to 50 years | 0 (0.0%) | 0.0 |
| Total | 6 (100.0%) | 58.0 |
Fertility by Age by Marriage Status in Waubeka
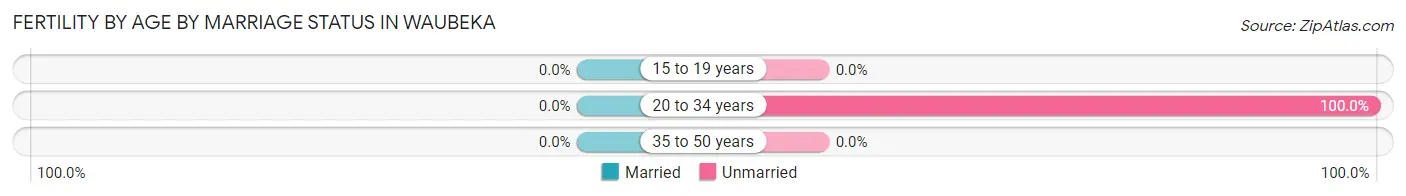
| Age Bracket | Married | Unmarried |
| 15 to 19 years | 0 (0.0%) | 0 (0.0%) |
| 20 to 34 years | 0 (0.0%) | 6 (100.0%) |
| 35 to 50 years | 0 (0.0%) | 0 (0.0%) |
| Total | 0 (0.0%) | 6 (100.0%) |
Fertility by Education in Waubeka
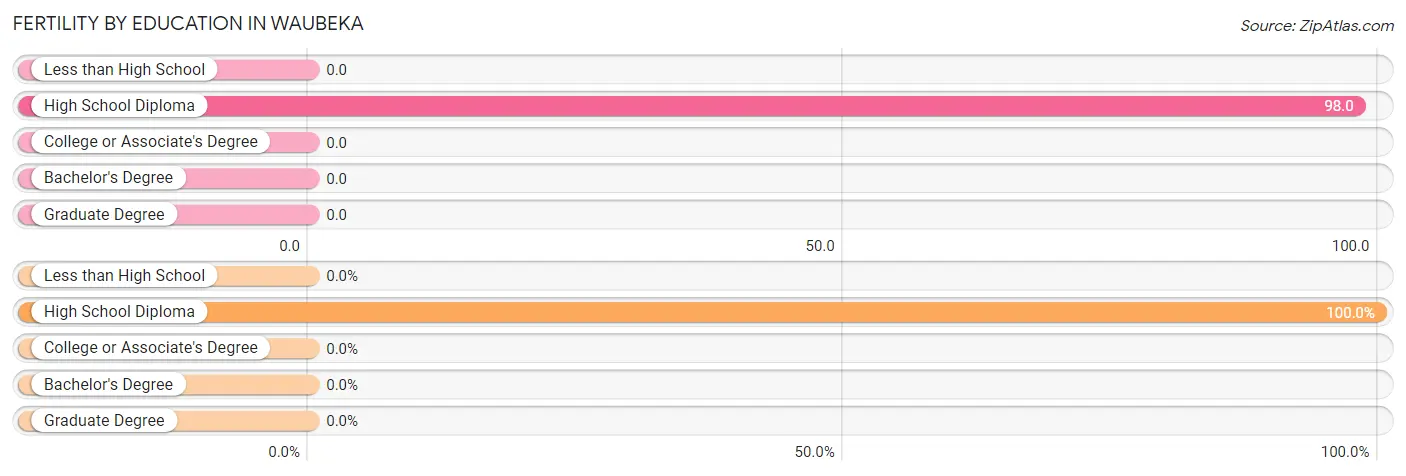
| Educational Attainment | Women with Births | Births / 1,000 Women |
| Less than High School | 0 (0.0%) | 0.0 |
| High School Diploma | 6 (100.0%) | 98.0 |
| College or Associate's Degree | 0 (0.0%) | 0.0 |
| Bachelor's Degree | 0 (0.0%) | 0.0 |
| Graduate Degree | 0 (0.0%) | 0.0 |
| Total | 6 (100.0%) | 58.0 |
Fertility by Education by Marriage Status in Waubeka
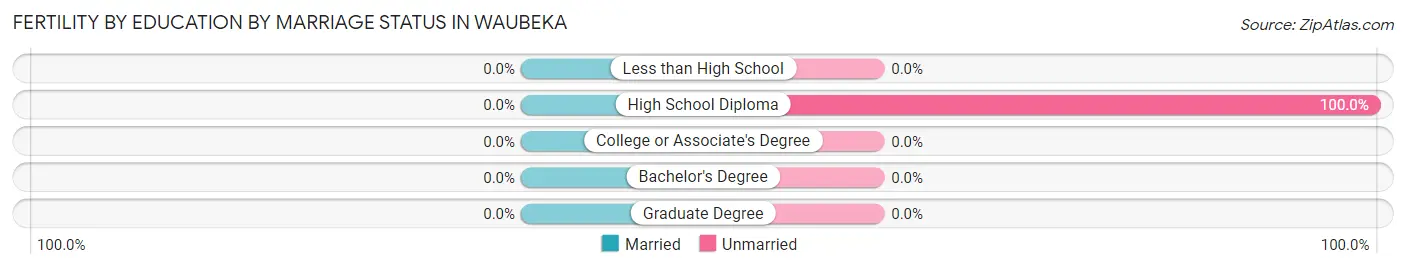
| Educational Attainment | Married | Unmarried |
| Less than High School | 0 (0.0%) | 0 (0.0%) |
| High School Diploma | 0 (0.0%) | 6 (100.0%) |
| College or Associate's Degree | 0 (0.0%) | 0 (0.0%) |
| Bachelor's Degree | 0 (0.0%) | 0 (0.0%) |
| Graduate Degree | 0 (0.0%) | 0 (0.0%) |
| Total | 0 (0.0%) | 6 (100.0%) |
Employment Characteristics in Waubeka
Employment by Class of Employer in Waubeka
Among the 318 employed individuals in Waubeka, private company employees (184 | 57.9%), self-employed (not incorporated) (47 | 14.8%), and self-employed (incorporated) (38 | 11.9%) make up the most common classes of employment.
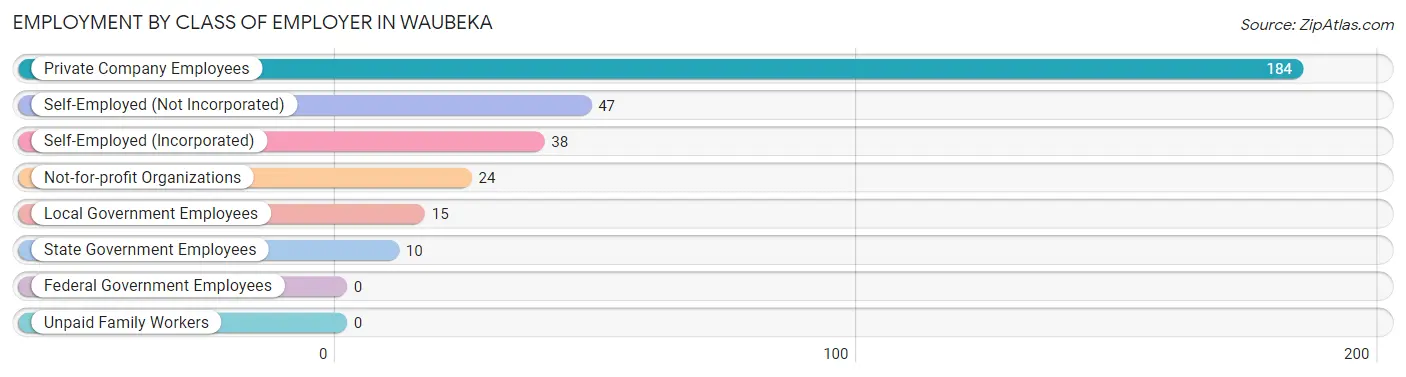
| Employer Class | # Employees | % Employees |
| Private Company Employees | 184 | 57.9% |
| Self-Employed (Incorporated) | 38 | 11.9% |
| Self-Employed (Not Incorporated) | 47 | 14.8% |
| Not-for-profit Organizations | 24 | 7.5% |
| Local Government Employees | 15 | 4.7% |
| State Government Employees | 10 | 3.1% |
| Federal Government Employees | 0 | 0.0% |
| Unpaid Family Workers | 0 | 0.0% |
| Total | 318 | 100.0% |
Employment Status by Age in Waubeka
According to the labor force statistics for Waubeka, out of the total population over 16 years of age (478), 72.2% or 345 individuals are in the labor force, with 7.8% or 27 of them unemployed. The age group with the highest labor force participation rate is 16 to 19 years, with 100.0% or 45 individuals in the labor force. Within the labor force, the 35 to 44 years age range has the highest percentage of unemployed individuals, with 33.9% or 19 of them being unemployed.
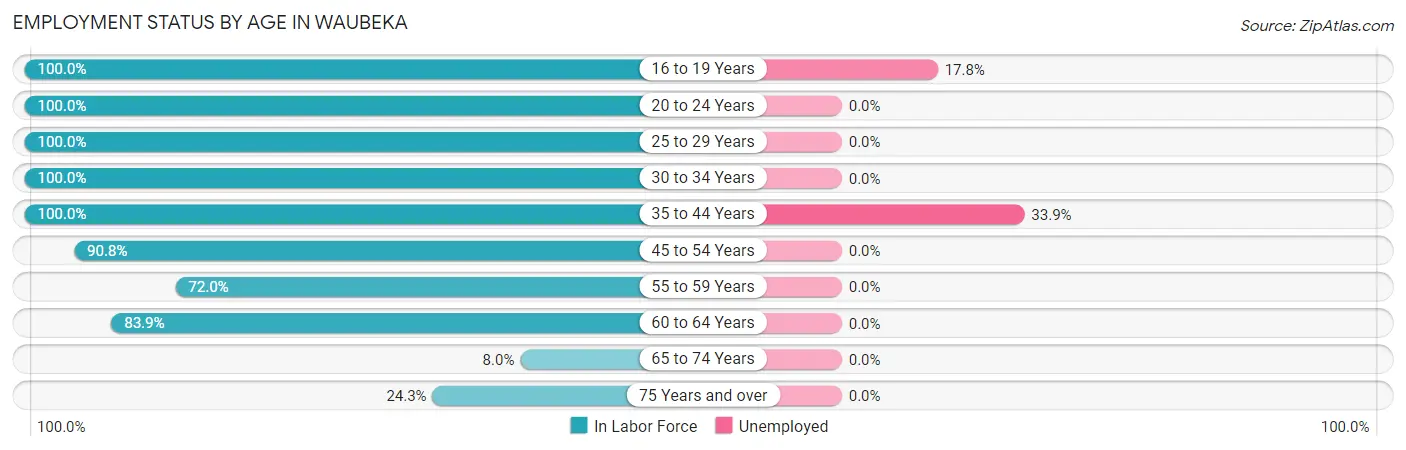
| Age Bracket | In Labor Force | Unemployed |
| 16 to 19 Years | 45 (100.0%) | 8 (17.8%) |
| 20 to 24 Years | 49 (100.0%) | 0 (0.0%) |
| 25 to 29 Years | 14 (100.0%) | 0 (0.0%) |
| 30 to 34 Years | 6 (100.0%) | 0 (0.0%) |
| 35 to 44 Years | 56 (100.0%) | 19 (33.9%) |
| 45 to 54 Years | 59 (90.8%) | 0 (0.0%) |
| 55 to 59 Years | 54 (72.0%) | 0 (0.0%) |
| 60 to 64 Years | 47 (83.9%) | 0 (0.0%) |
| 65 to 74 Years | 6 (8.0%) | 0 (0.0%) |
| 75 Years and over | 9 (24.3%) | 0 (0.0%) |
| Total | 345 (72.2%) | 27 (7.8%) |
Employment Status by Educational Attainment in Waubeka
According to labor force statistics for Waubeka, 86.8% of individuals (236) out of the total population between 25 and 64 years of age (272) are in the labor force, with 8.1% or 19 of them being unemployed. The group with the highest labor force participation rate are those with the educational attainment of bachelor's degree or higher, with 93.1% or 54 individuals in the labor force. Within the labor force, individuals with high school diploma education have the highest percentage of unemployment, with 16.2% or 19 of them being unemployed.
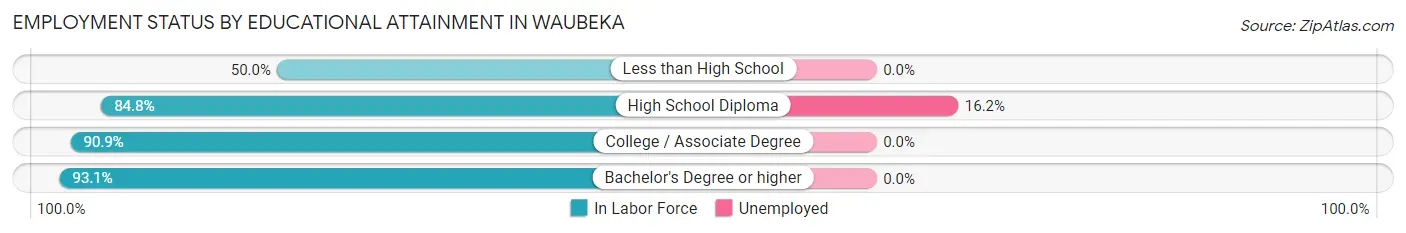
| Educational Attainment | In Labor Force | Unemployed |
| Less than High School | 5 (50.0%) | 0 (0.0%) |
| High School Diploma | 117 (84.8%) | 22 (16.2%) |
| College / Associate Degree | 60 (90.9%) | 0 (0.0%) |
| Bachelor's Degree or higher | 54 (93.1%) | 0 (0.0%) |
| Total | 236 (86.8%) | 22 (8.1%) |
Employment Occupations by Sex in Waubeka
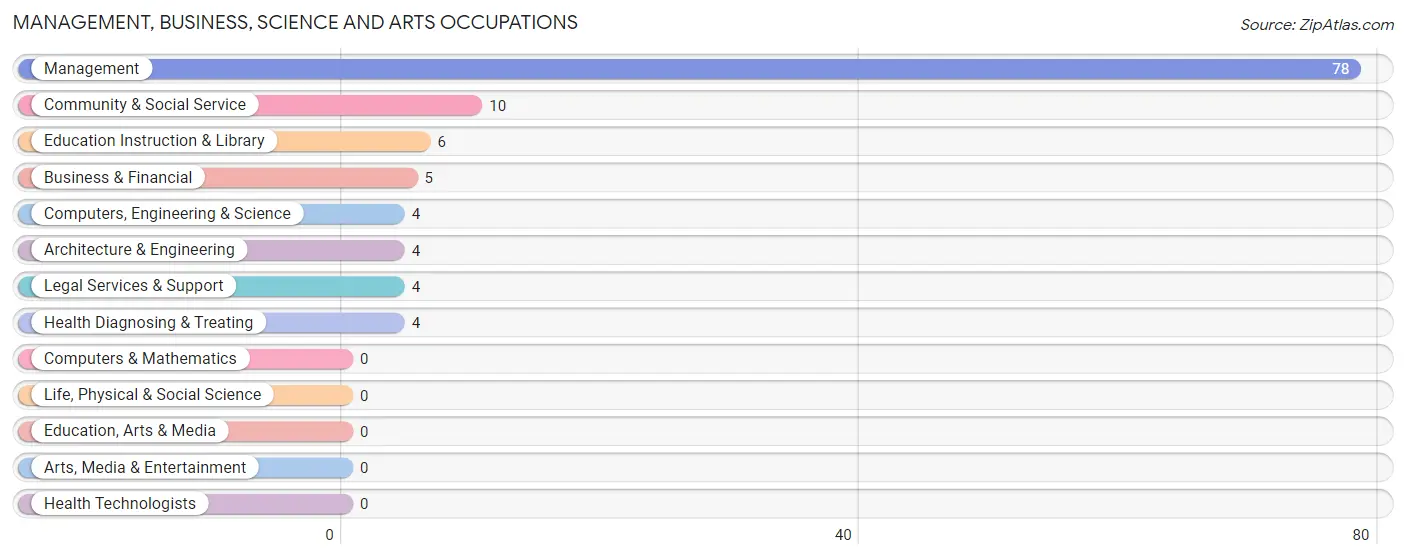
Management, Business, Science and Arts Occupations
The most common Management, Business, Science and Arts occupations in Waubeka are Management (78 | 24.5%), Community & Social Service (10 | 3.1%), Education Instruction & Library (6 | 1.9%), Business & Financial (5 | 1.6%), and Computers, Engineering & Science (4 | 1.3%).
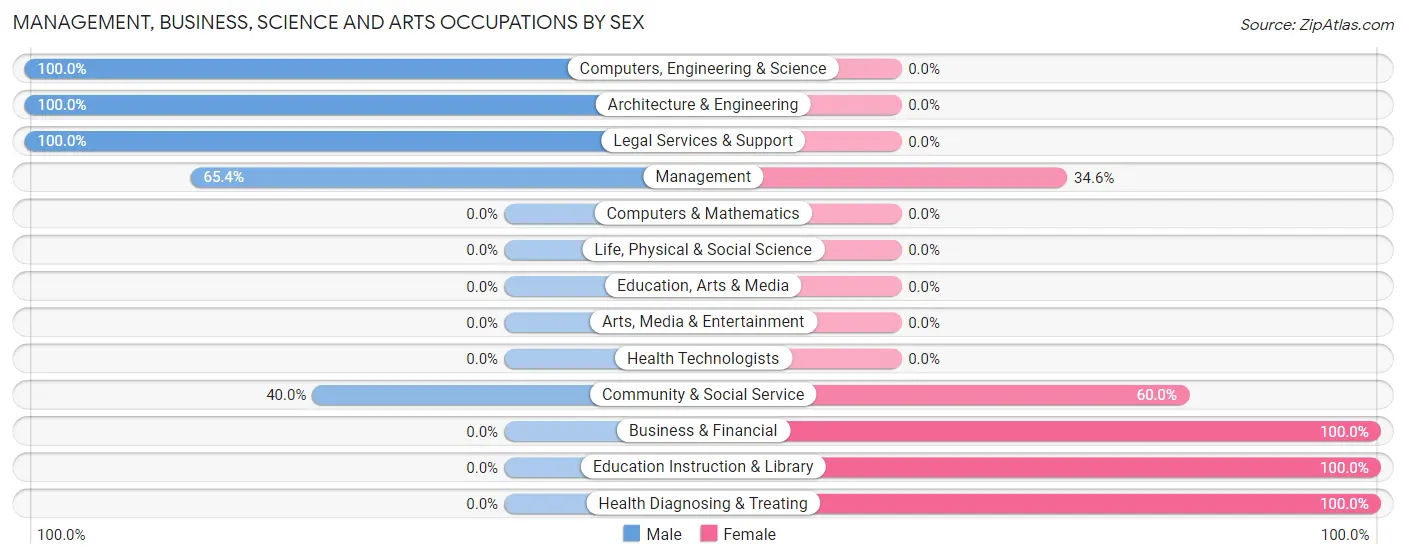
Management, Business, Science and Arts Occupations by Sex
Within the Management, Business, Science and Arts occupations in Waubeka, the most male-oriented occupations are Computers, Engineering & Science (100.0%), Architecture & Engineering (100.0%), and Legal Services & Support (100.0%), while the most female-oriented occupations are Business & Financial (100.0%), Education Instruction & Library (100.0%), and Health Diagnosing & Treating (100.0%).
| Occupation | Male | Female |
| Management | 51 (65.4%) | 27 (34.6%) |
| Business & Financial | 0 (0.0%) | 5 (100.0%) |
| Computers, Engineering & Science | 4 (100.0%) | 0 (0.0%) |
| Computers & Mathematics | 0 (0.0%) | 0 (0.0%) |
| Architecture & Engineering | 4 (100.0%) | 0 (0.0%) |
| Life, Physical & Social Science | 0 (0.0%) | 0 (0.0%) |
| Community & Social Service | 4 (40.0%) | 6 (60.0%) |
| Education, Arts & Media | 0 (0.0%) | 0 (0.0%) |
| Legal Services & Support | 4 (100.0%) | 0 (0.0%) |
| Education Instruction & Library | 0 (0.0%) | 6 (100.0%) |
| Arts, Media & Entertainment | 0 (0.0%) | 0 (0.0%) |
| Health Diagnosing & Treating | 0 (0.0%) | 4 (100.0%) |
| Health Technologists | 0 (0.0%) | 0 (0.0%) |
| Total (Category) | 59 (58.4%) | 42 (41.6%) |
| Total (Overall) | 160 (50.3%) | 158 (49.7%) |
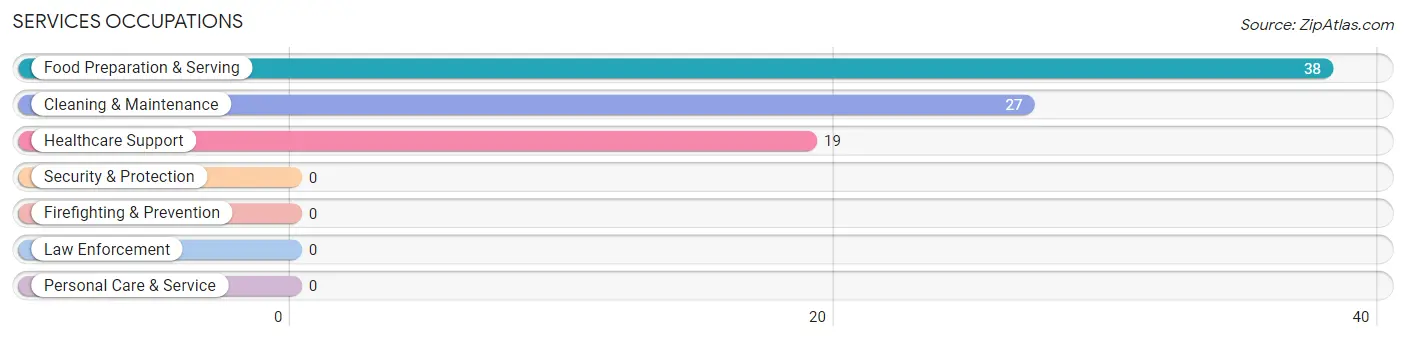
Services Occupations
The most common Services occupations in Waubeka are Food Preparation & Serving (38 | 11.9%), Cleaning & Maintenance (27 | 8.5%), and Healthcare Support (19 | 6.0%).
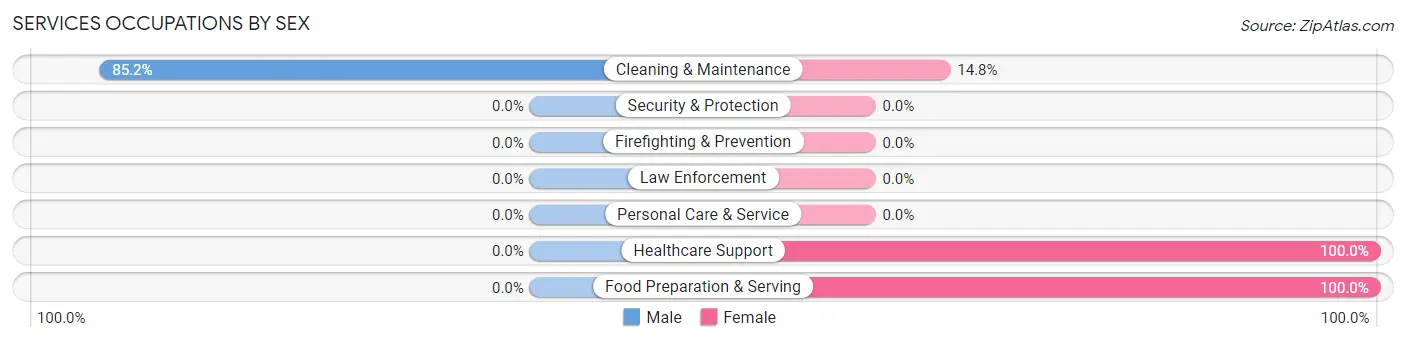
Services Occupations by Sex
| Occupation | Male | Female |
| Healthcare Support | 0 (0.0%) | 19 (100.0%) |
| Security & Protection | 0 (0.0%) | 0 (0.0%) |
| Firefighting & Prevention | 0 (0.0%) | 0 (0.0%) |
| Law Enforcement | 0 (0.0%) | 0 (0.0%) |
| Food Preparation & Serving | 0 (0.0%) | 38 (100.0%) |
| Cleaning & Maintenance | 23 (85.2%) | 4 (14.8%) |
| Personal Care & Service | 0 (0.0%) | 0 (0.0%) |
| Total (Category) | 23 (27.4%) | 61 (72.6%) |
| Total (Overall) | 160 (50.3%) | 158 (49.7%) |
Sales and Office Occupations
The most common Sales and Office occupations in Waubeka are Office & Administration (27 | 8.5%), and Sales & Related (20 | 6.3%).
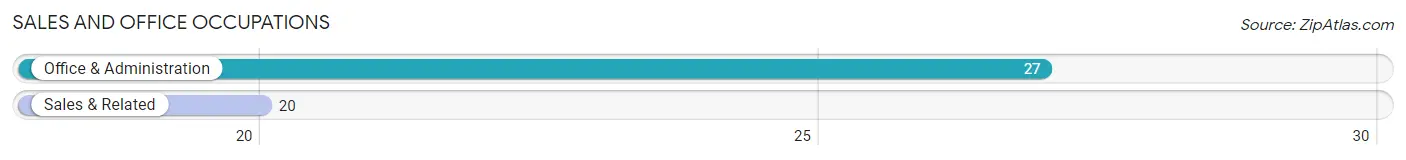
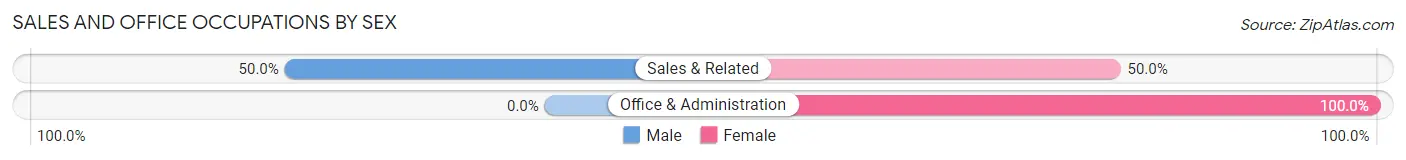
Sales and Office Occupations by Sex
| Occupation | Male | Female |
| Sales & Related | 10 (50.0%) | 10 (50.0%) |
| Office & Administration | 0 (0.0%) | 27 (100.0%) |
| Total (Category) | 10 (21.3%) | 37 (78.7%) |
| Total (Overall) | 160 (50.3%) | 158 (49.7%) |
Natural Resources, Construction and Maintenance Occupations
The most common Natural Resources, Construction and Maintenance occupations in Waubeka are Installation, Maintenance & Repair (19 | 6.0%), and Construction & Extraction (7 | 2.2%).
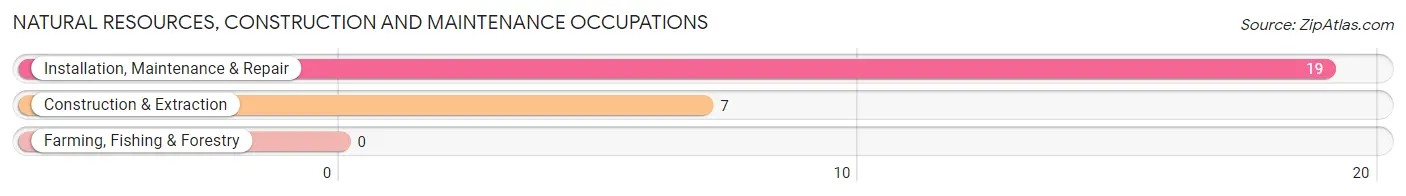
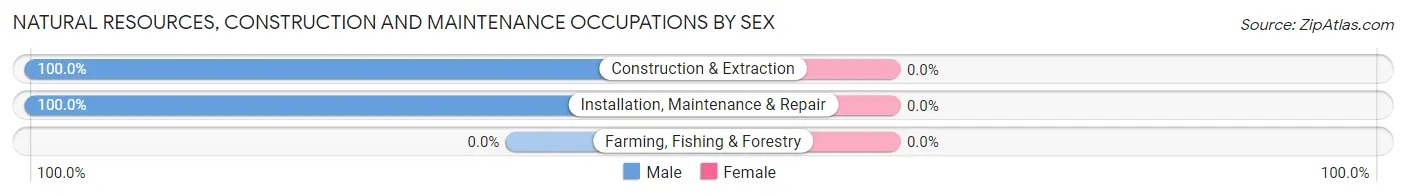
Natural Resources, Construction and Maintenance Occupations by Sex
| Occupation | Male | Female |
| Farming, Fishing & Forestry | 0 (0.0%) | 0 (0.0%) |
| Construction & Extraction | 7 (100.0%) | 0 (0.0%) |
| Installation, Maintenance & Repair | 19 (100.0%) | 0 (0.0%) |
| Total (Category) | 26 (100.0%) | 0 (0.0%) |
| Total (Overall) | 160 (50.3%) | 158 (49.7%) |
Production, Transportation and Moving Occupations
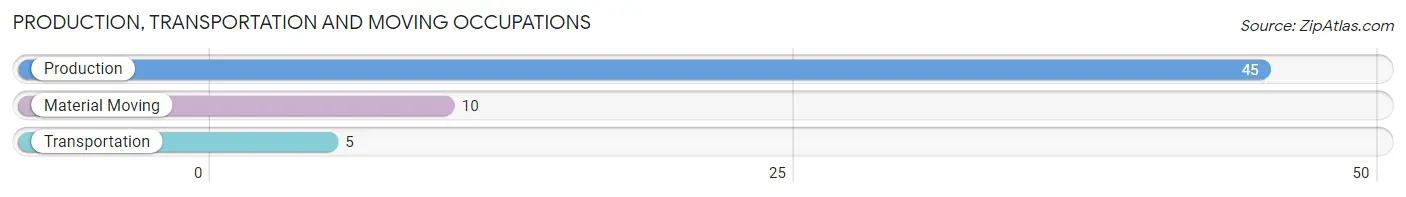
The most common Production, Transportation and Moving occupations in Waubeka are Production (45 | 14.1%), Material Moving (10 | 3.1%), and Transportation (5 | 1.6%).
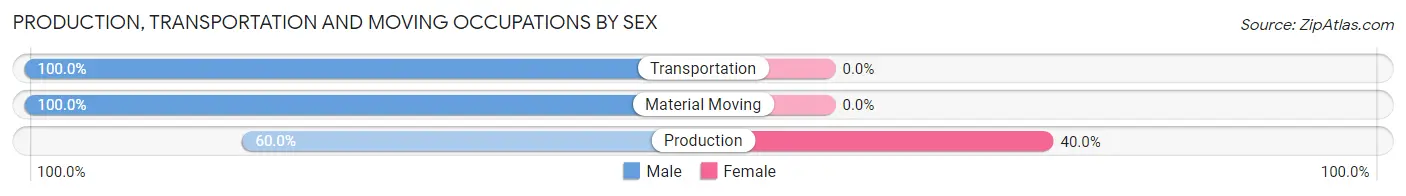
Production, Transportation and Moving Occupations by Sex
| Occupation | Male | Female |
| Production | 27 (60.0%) | 18 (40.0%) |
| Transportation | 5 (100.0%) | 0 (0.0%) |
| Material Moving | 10 (100.0%) | 0 (0.0%) |
| Total (Category) | 42 (70.0%) | 18 (30.0%) |
| Total (Overall) | 160 (50.3%) | 158 (49.7%) |
Employment Industries by Sex in Waubeka
Employment Industries in Waubeka
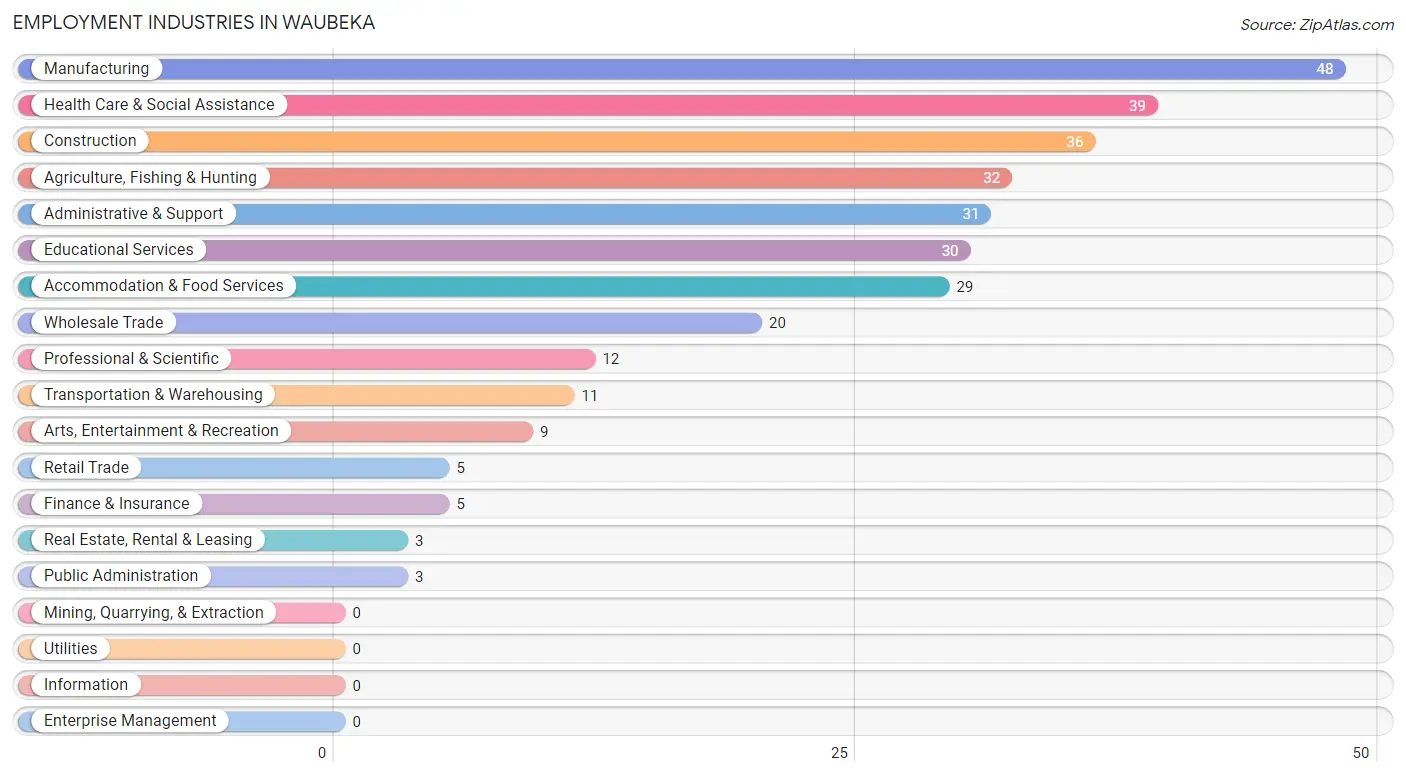
The major employment industries in Waubeka include Manufacturing (48 | 15.1%), Health Care & Social Assistance (39 | 12.3%), Construction (36 | 11.3%), Agriculture, Fishing & Hunting (32 | 10.1%), and Administrative & Support (31 | 9.8%).
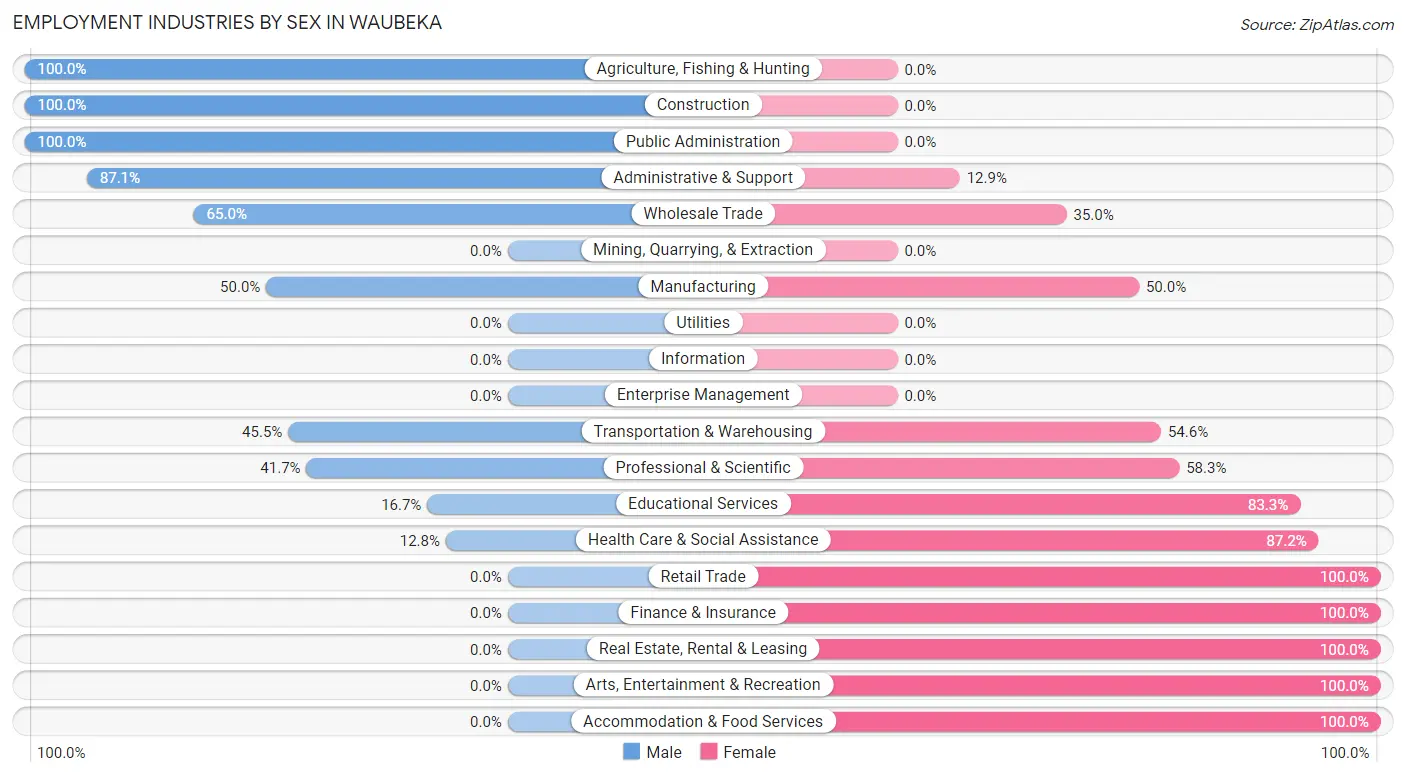
Employment Industries by Sex in Waubeka
The Waubeka industries that see more men than women are Agriculture, Fishing & Hunting (100.0%), Construction (100.0%), and Public Administration (100.0%), whereas the industries that tend to have a higher number of women are Retail Trade (100.0%), Finance & Insurance (100.0%), and Real Estate, Rental & Leasing (100.0%).
| Industry | Male | Female |
| Agriculture, Fishing & Hunting | 32 (100.0%) | 0 (0.0%) |
| Mining, Quarrying, & Extraction | 0 (0.0%) | 0 (0.0%) |
| Construction | 36 (100.0%) | 0 (0.0%) |
| Manufacturing | 24 (50.0%) | 24 (50.0%) |
| Wholesale Trade | 13 (65.0%) | 7 (35.0%) |
| Retail Trade | 0 (0.0%) | 5 (100.0%) |
| Transportation & Warehousing | 5 (45.5%) | 6 (54.5%) |
| Utilities | 0 (0.0%) | 0 (0.0%) |
| Information | 0 (0.0%) | 0 (0.0%) |
| Finance & Insurance | 0 (0.0%) | 5 (100.0%) |
| Real Estate, Rental & Leasing | 0 (0.0%) | 3 (100.0%) |
| Professional & Scientific | 5 (41.7%) | 7 (58.3%) |
| Enterprise Management | 0 (0.0%) | 0 (0.0%) |
| Administrative & Support | 27 (87.1%) | 4 (12.9%) |
| Educational Services | 5 (16.7%) | 25 (83.3%) |
| Health Care & Social Assistance | 5 (12.8%) | 34 (87.2%) |
| Arts, Entertainment & Recreation | 0 (0.0%) | 9 (100.0%) |
| Accommodation & Food Services | 0 (0.0%) | 29 (100.0%) |
| Public Administration | 3 (100.0%) | 0 (0.0%) |
| Total | 160 (50.3%) | 158 (49.7%) |
Education in Waubeka
School Enrollment in Waubeka
The most common levels of schooling among the 66 students in Waubeka are high school (20 | 30.3%), middle school (11 | 16.7%), and elementary school (10 | 15.1%).
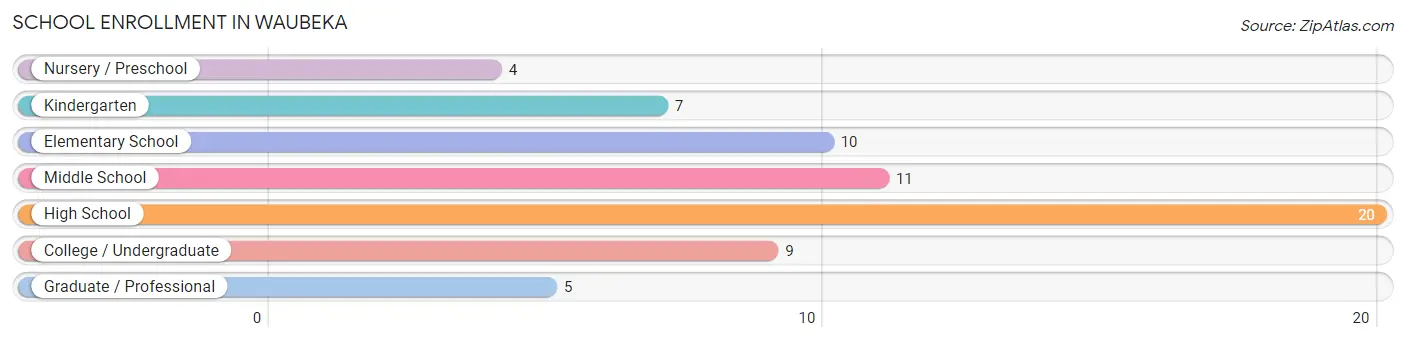
| School Level | # Students | % Students |
| Nursery / Preschool | 4 | 6.1% |
| Kindergarten | 7 | 10.6% |
| Elementary School | 10 | 15.1% |
| Middle School | 11 | 16.7% |
| High School | 20 | 30.3% |
| College / Undergraduate | 9 | 13.6% |
| Graduate / Professional | 5 | 7.6% |
| Total | 66 | 100.0% |
School Enrollment by Age by Funding Source in Waubeka
Out of a total of 66 students who are enrolled in schools in Waubeka, 26 (39.4%) attend a private institution, while the remaining 40 (60.6%) are enrolled in public schools. The age group of 3 to 4 year olds has the highest likelihood of being enrolled in private schools, with 4 (100.0% in the age bracket) enrolled. Conversely, the age group of 15 to 17 year olds has the lowest likelihood of being enrolled in a private school, with 8 (100.0% in the age bracket) attending a public institution.
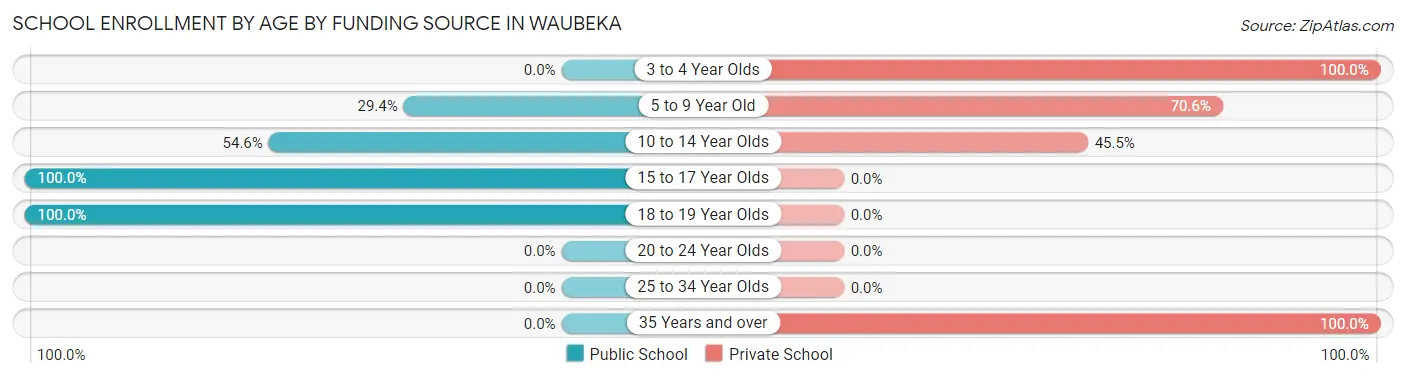
| Age Bracket | Public School | Private School |
| 3 to 4 Year Olds | 0 (0.0%) | 4 (100.0%) |
| 5 to 9 Year Old | 5 (29.4%) | 12 (70.6%) |
| 10 to 14 Year Olds | 6 (54.5%) | 5 (45.5%) |
| 15 to 17 Year Olds | 8 (100.0%) | 0 (0.0%) |
| 18 to 19 Year Olds | 21 (100.0%) | 0 (0.0%) |
| 20 to 24 Year Olds | 0 (0.0%) | 0 (0.0%) |
| 25 to 34 Year Olds | 0 (0.0%) | 0 (0.0%) |
| 35 Years and over | 0 (0.0%) | 5 (100.0%) |
| Total | 40 (60.6%) | 26 (39.4%) |
Educational Attainment by Field of Study in Waubeka
Science & technology (15 | 19.2%), engineering (12 | 15.4%), literature & languages (11 | 14.1%), arts & humanities (9 | 11.5%), and computers & mathematics (7 | 9.0%) are the most common fields of study among 78 individuals in Waubeka who have obtained a bachelor's degree or higher.
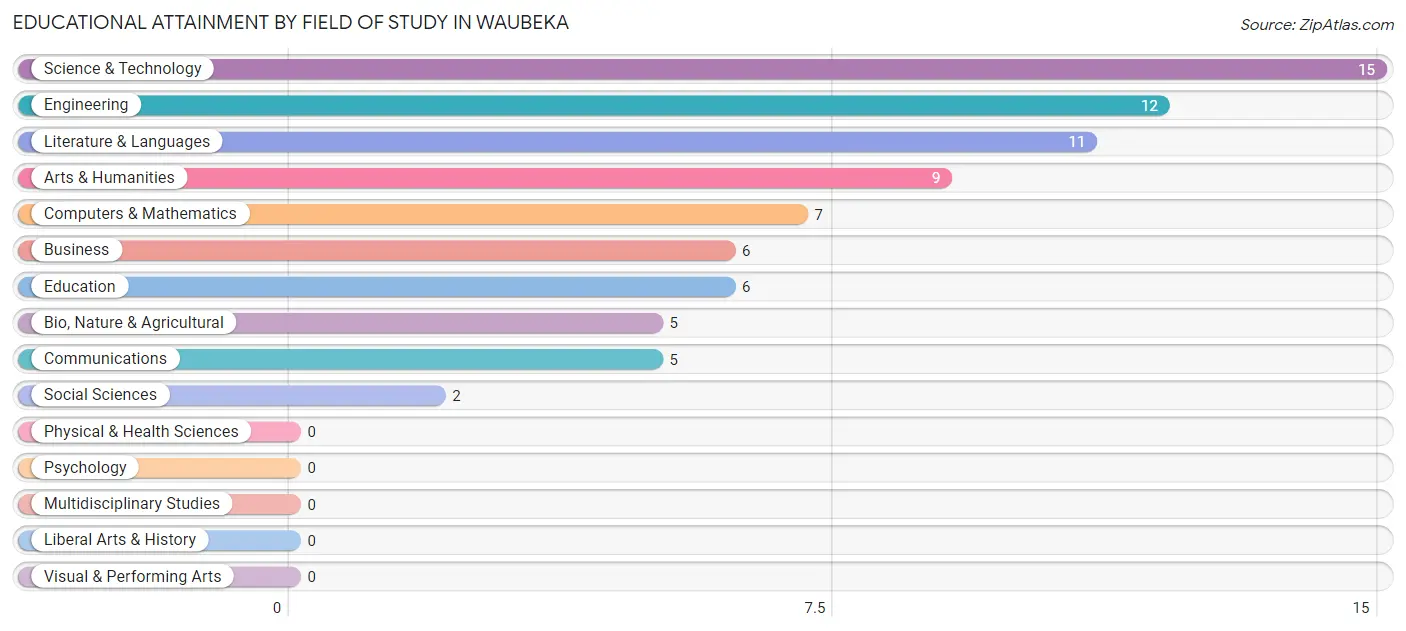
| Field of Study | # Graduates | % Graduates |
| Computers & Mathematics | 7 | 9.0% |
| Bio, Nature & Agricultural | 5 | 6.4% |
| Physical & Health Sciences | 0 | 0.0% |
| Psychology | 0 | 0.0% |
| Social Sciences | 2 | 2.6% |
| Engineering | 12 | 15.4% |
| Multidisciplinary Studies | 0 | 0.0% |
| Science & Technology | 15 | 19.2% |
| Business | 6 | 7.7% |
| Education | 6 | 7.7% |
| Literature & Languages | 11 | 14.1% |
| Liberal Arts & History | 0 | 0.0% |
| Visual & Performing Arts | 0 | 0.0% |
| Communications | 5 | 6.4% |
| Arts & Humanities | 9 | 11.5% |
| Total | 78 | 100.0% |
Transportation & Commute in Waubeka
Vehicle Availability by Sex in Waubeka
The most prevalent vehicle ownership categories in Waubeka are males with 3 vehicles (83, accounting for 51.9%) and females with 3 vehicles (55, making up 52.5%).
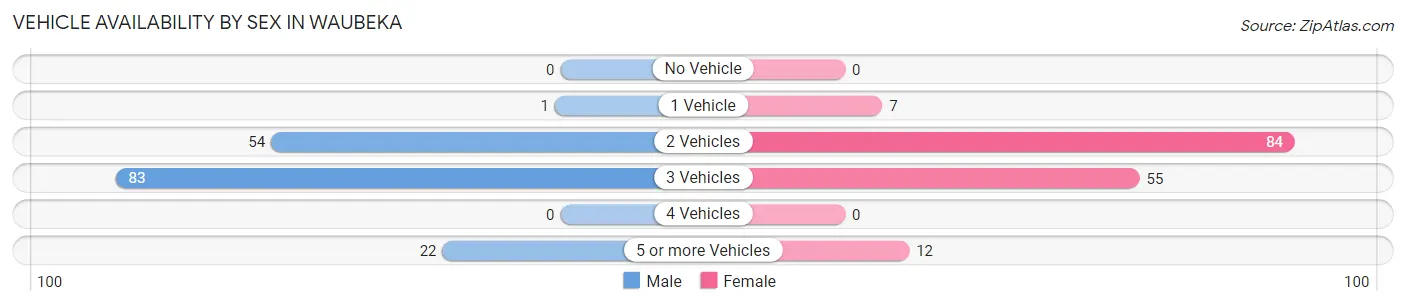
| Vehicles Available | Male | Female |
| No Vehicle | 0 (0.0%) | 0 (0.0%) |
| 1 Vehicle | 1 (0.6%) | 7 (4.4%) |
| 2 Vehicles | 54 (33.8%) | 84 (53.2%) |
| 3 Vehicles | 83 (51.9%) | 55 (34.8%) |
| 4 Vehicles | 0 (0.0%) | 0 (0.0%) |
| 5 or more Vehicles | 22 (13.8%) | 12 (7.6%) |
| Total | 160 (100.0%) | 158 (100.0%) |
Commute Time in Waubeka
The most frequently occuring commute durations in Waubeka are 20 to 24 minutes (80 commuters, 25.4%), 30 to 34 minutes (62 commuters, 19.7%), and 15 to 19 minutes (42 commuters, 13.3%).
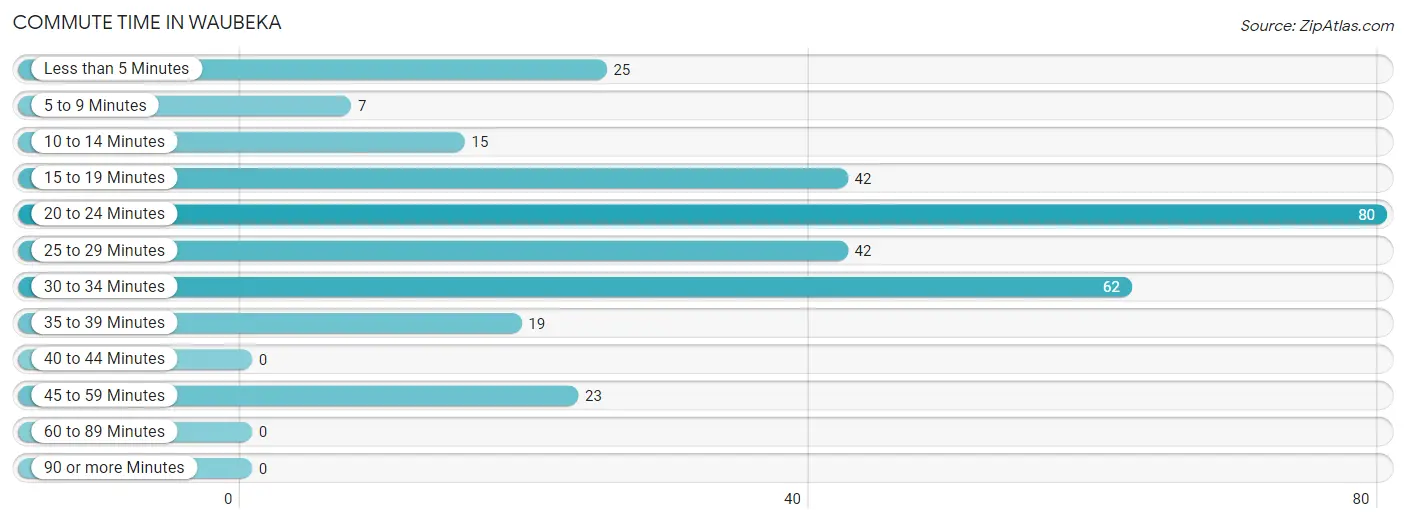
| Commute Time | # Commuters | % Commuters |
| Less than 5 Minutes | 25 | 7.9% |
| 5 to 9 Minutes | 7 | 2.2% |
| 10 to 14 Minutes | 15 | 4.8% |
| 15 to 19 Minutes | 42 | 13.3% |
| 20 to 24 Minutes | 80 | 25.4% |
| 25 to 29 Minutes | 42 | 13.3% |
| 30 to 34 Minutes | 62 | 19.7% |
| 35 to 39 Minutes | 19 | 6.0% |
| 40 to 44 Minutes | 0 | 0.0% |
| 45 to 59 Minutes | 23 | 7.3% |
| 60 to 89 Minutes | 0 | 0.0% |
| 90 or more Minutes | 0 | 0.0% |
Commute Time by Sex in Waubeka
The most common commute times in Waubeka are 30 to 34 minutes (43 commuters, 27.0%) for males and 20 to 24 minutes (43 commuters, 27.6%) for females.
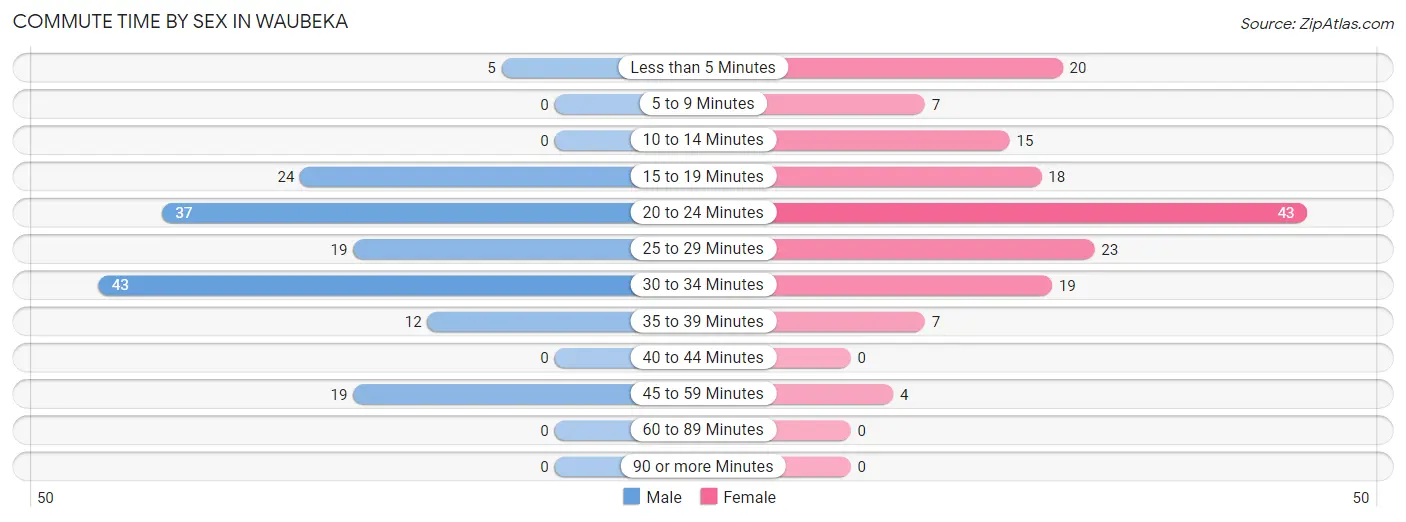
| Commute Time | Male | Female |
| Less than 5 Minutes | 5 (3.1%) | 20 (12.8%) |
| 5 to 9 Minutes | 0 (0.0%) | 7 (4.5%) |
| 10 to 14 Minutes | 0 (0.0%) | 15 (9.6%) |
| 15 to 19 Minutes | 24 (15.1%) | 18 (11.5%) |
| 20 to 24 Minutes | 37 (23.3%) | 43 (27.6%) |
| 25 to 29 Minutes | 19 (11.9%) | 23 (14.7%) |
| 30 to 34 Minutes | 43 (27.0%) | 19 (12.2%) |
| 35 to 39 Minutes | 12 (7.5%) | 7 (4.5%) |
| 40 to 44 Minutes | 0 (0.0%) | 0 (0.0%) |
| 45 to 59 Minutes | 19 (11.9%) | 4 (2.6%) |
| 60 to 89 Minutes | 0 (0.0%) | 0 (0.0%) |
| 90 or more Minutes | 0 (0.0%) | 0 (0.0%) |
Time of Departure to Work by Sex in Waubeka
The most frequent times of departure to work in Waubeka are 5:30 AM to 5:59 AM (33, 20.7%) for males and 7:30 AM to 7:59 AM (41, 26.3%) for females.
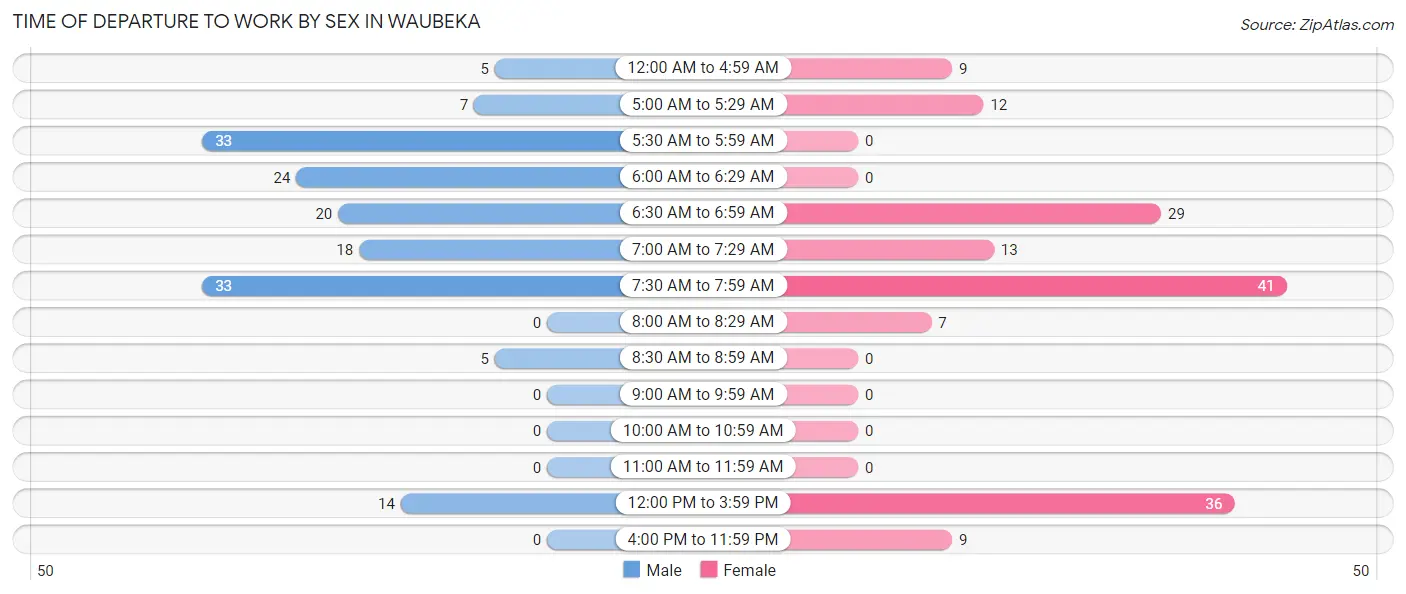
| Time of Departure | Male | Female |
| 12:00 AM to 4:59 AM | 5 (3.1%) | 9 (5.8%) |
| 5:00 AM to 5:29 AM | 7 (4.4%) | 12 (7.7%) |
| 5:30 AM to 5:59 AM | 33 (20.7%) | 0 (0.0%) |
| 6:00 AM to 6:29 AM | 24 (15.1%) | 0 (0.0%) |
| 6:30 AM to 6:59 AM | 20 (12.6%) | 29 (18.6%) |
| 7:00 AM to 7:29 AM | 18 (11.3%) | 13 (8.3%) |
| 7:30 AM to 7:59 AM | 33 (20.7%) | 41 (26.3%) |
| 8:00 AM to 8:29 AM | 0 (0.0%) | 7 (4.5%) |
| 8:30 AM to 8:59 AM | 5 (3.1%) | 0 (0.0%) |
| 9:00 AM to 9:59 AM | 0 (0.0%) | 0 (0.0%) |
| 10:00 AM to 10:59 AM | 0 (0.0%) | 0 (0.0%) |
| 11:00 AM to 11:59 AM | 0 (0.0%) | 0 (0.0%) |
| 12:00 PM to 3:59 PM | 14 (8.8%) | 36 (23.1%) |
| 4:00 PM to 11:59 PM | 0 (0.0%) | 9 (5.8%) |
| Total | 159 (100.0%) | 156 (100.0%) |
Housing Occupancy in Waubeka
Occupancy by Ownership in Waubeka
Of the total 214 dwellings in Waubeka, owner-occupied units account for 182 (85.1%), while renter-occupied units make up 32 (14.9%).
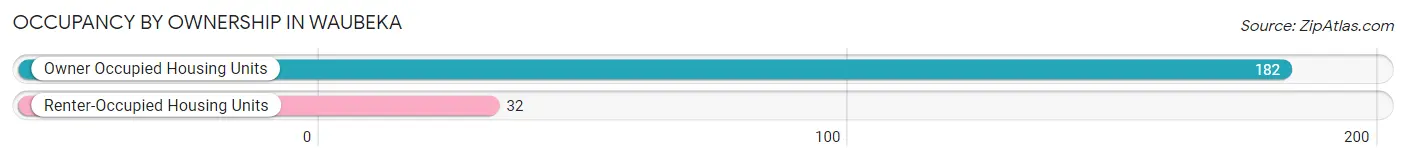
| Occupancy | # Housing Units | % Housing Units |
| Owner Occupied Housing Units | 182 | 85.1% |
| Renter-Occupied Housing Units | 32 | 14.9% |
| Total Occupied Housing Units | 214 | 100.0% |
Occupancy by Household Size in Waubeka
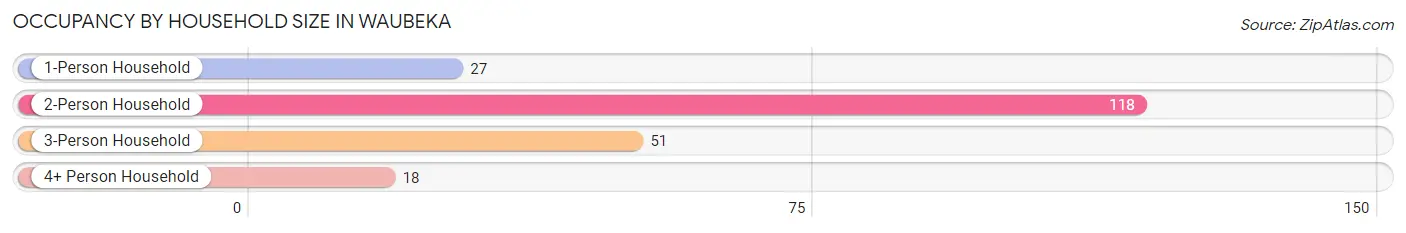
| Household Size | # Housing Units | % Housing Units |
| 1-Person Household | 27 | 12.6% |
| 2-Person Household | 118 | 55.1% |
| 3-Person Household | 51 | 23.8% |
| 4+ Person Household | 18 | 8.4% |
| Total Housing Units | 214 | 100.0% |
Occupancy by Ownership by Household Size in Waubeka
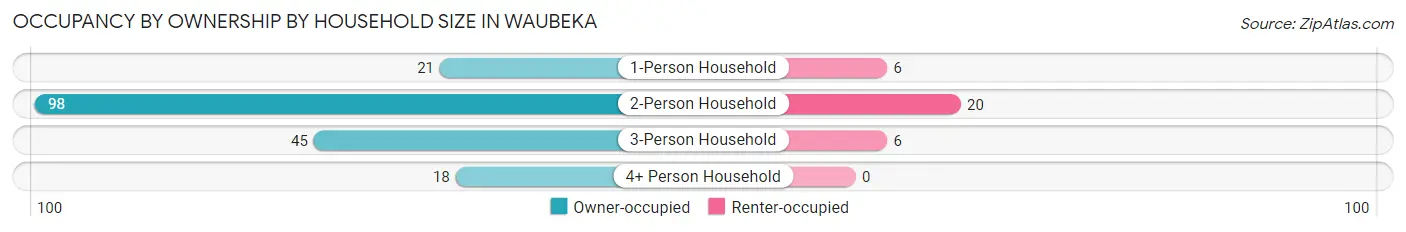
| Household Size | Owner-occupied | Renter-occupied |
| 1-Person Household | 21 (77.8%) | 6 (22.2%) |
| 2-Person Household | 98 (83.1%) | 20 (17.0%) |
| 3-Person Household | 45 (88.2%) | 6 (11.8%) |
| 4+ Person Household | 18 (100.0%) | 0 (0.0%) |
| Total Housing Units | 182 (85.1%) | 32 (14.9%) |
Occupancy by Educational Attainment in Waubeka
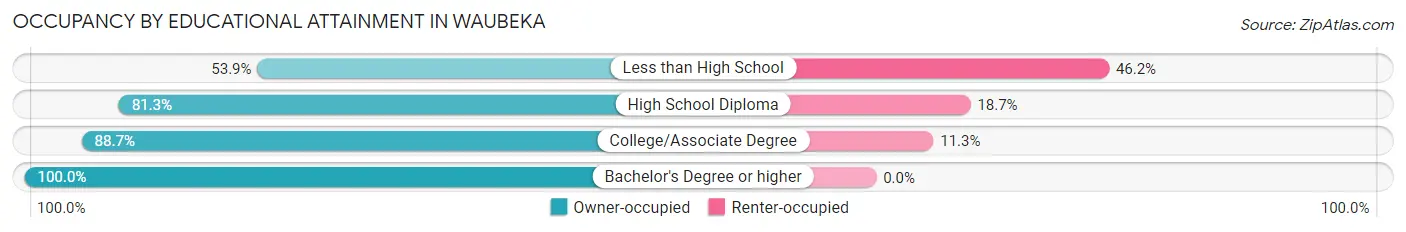
| Household Size | Owner-occupied | Renter-occupied |
| Less than High School | 7 (53.8%) | 6 (46.2%) |
| High School Diploma | 87 (81.3%) | 20 (18.7%) |
| College/Associate Degree | 47 (88.7%) | 6 (11.3%) |
| Bachelor's Degree or higher | 41 (100.0%) | 0 (0.0%) |
Occupancy by Age of Householder in Waubeka
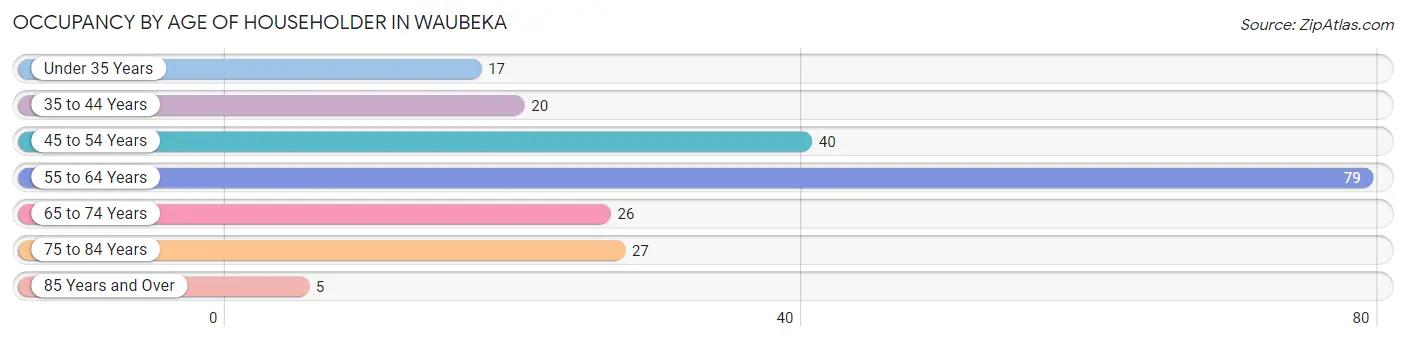
| Age Bracket | # Households | % Households |
| Under 35 Years | 17 | 7.9% |
| 35 to 44 Years | 20 | 9.3% |
| 45 to 54 Years | 40 | 18.7% |
| 55 to 64 Years | 79 | 36.9% |
| 65 to 74 Years | 26 | 12.1% |
| 75 to 84 Years | 27 | 12.6% |
| 85 Years and Over | 5 | 2.3% |
| Total | 214 | 100.0% |
Housing Finances in Waubeka
Median Income by Occupancy in Waubeka
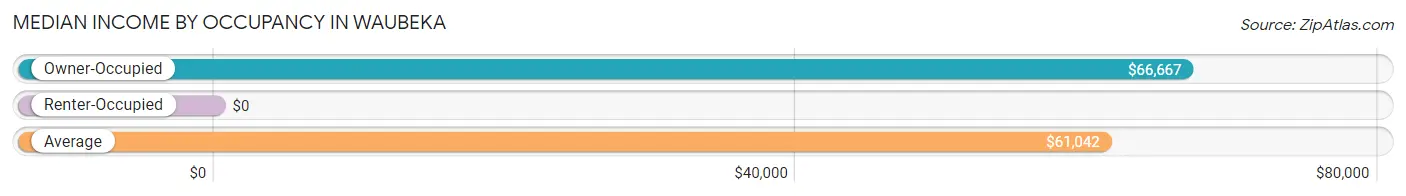
| Occupancy Type | # Households | Median Income |
| Owner-Occupied | 182 (85.1%) | $66,667 |
| Renter-Occupied | 32 (14.9%) | $0 |
| Average | 214 (100.0%) | $61,042 |
Occupancy by Householder Income Bracket in Waubeka
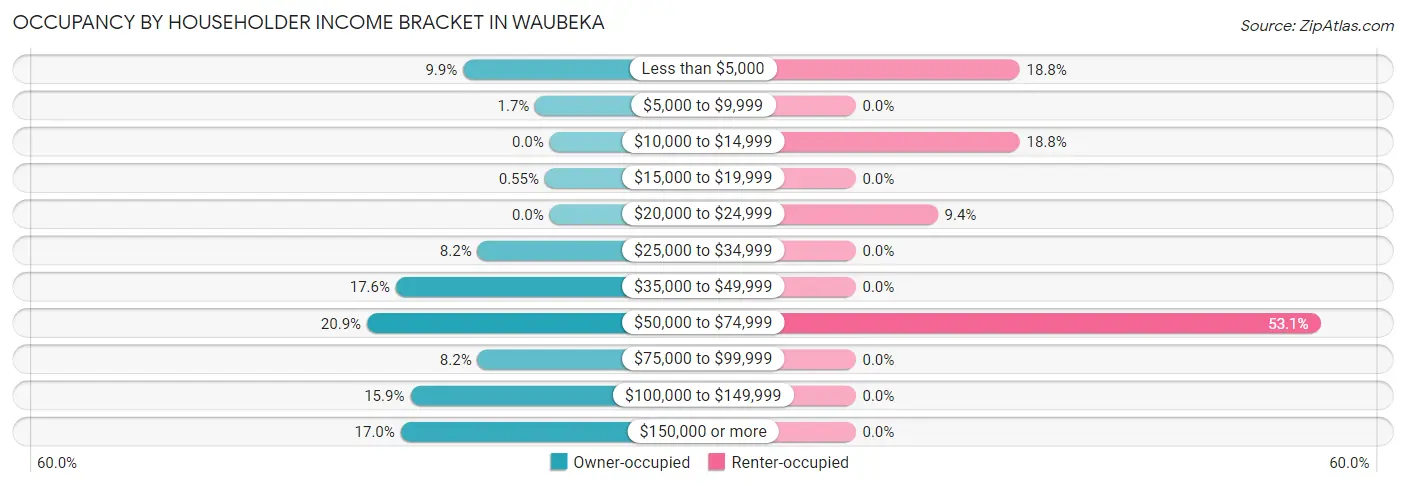
| Income Bracket | Owner-occupied | Renter-occupied |
| Less than $5,000 | 18 (9.9%) | 6 (18.8%) |
| $5,000 to $9,999 | 3 (1.7%) | 0 (0.0%) |
| $10,000 to $14,999 | 0 (0.0%) | 6 (18.8%) |
| $15,000 to $19,999 | 1 (0.5%) | 0 (0.0%) |
| $20,000 to $24,999 | 0 (0.0%) | 3 (9.4%) |
| $25,000 to $34,999 | 15 (8.2%) | 0 (0.0%) |
| $35,000 to $49,999 | 32 (17.6%) | 0 (0.0%) |
| $50,000 to $74,999 | 38 (20.9%) | 17 (53.1%) |
| $75,000 to $99,999 | 15 (8.2%) | 0 (0.0%) |
| $100,000 to $149,999 | 29 (15.9%) | 0 (0.0%) |
| $150,000 or more | 31 (17.0%) | 0 (0.0%) |
| Total | 182 (100.0%) | 32 (100.0%) |
Monthly Housing Cost Tiers in Waubeka
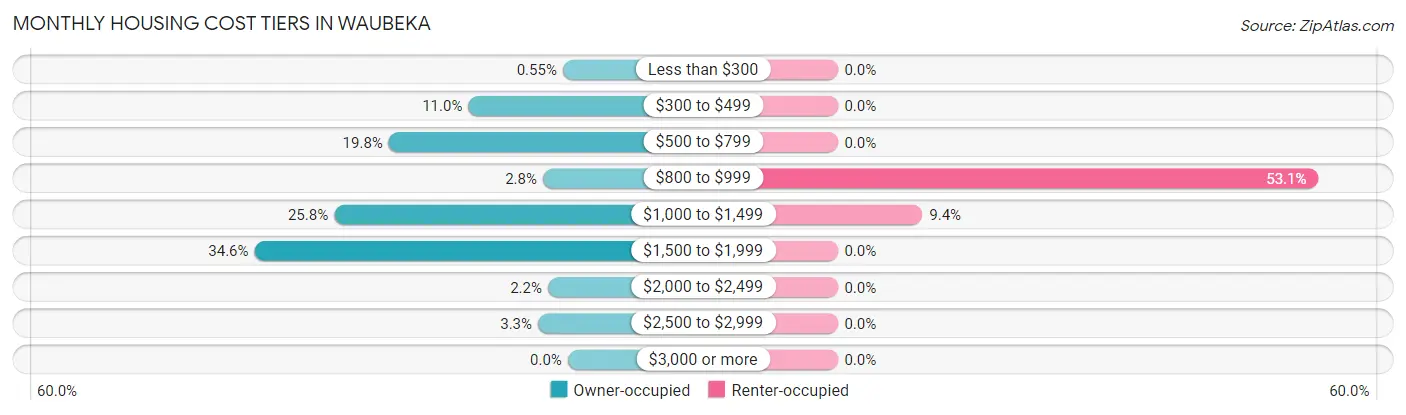
| Monthly Cost | Owner-occupied | Renter-occupied |
| Less than $300 | 1 (0.5%) | 0 (0.0%) |
| $300 to $499 | 20 (11.0%) | 0 (0.0%) |
| $500 to $799 | 36 (19.8%) | 0 (0.0%) |
| $800 to $999 | 5 (2.8%) | 17 (53.1%) |
| $1,000 to $1,499 | 47 (25.8%) | 3 (9.4%) |
| $1,500 to $1,999 | 63 (34.6%) | 0 (0.0%) |
| $2,000 to $2,499 | 4 (2.2%) | 0 (0.0%) |
| $2,500 to $2,999 | 6 (3.3%) | 0 (0.0%) |
| $3,000 or more | 0 (0.0%) | 0 (0.0%) |
| Total | 182 (100.0%) | 32 (100.0%) |
Physical Housing Characteristics in Waubeka
Housing Structures in Waubeka
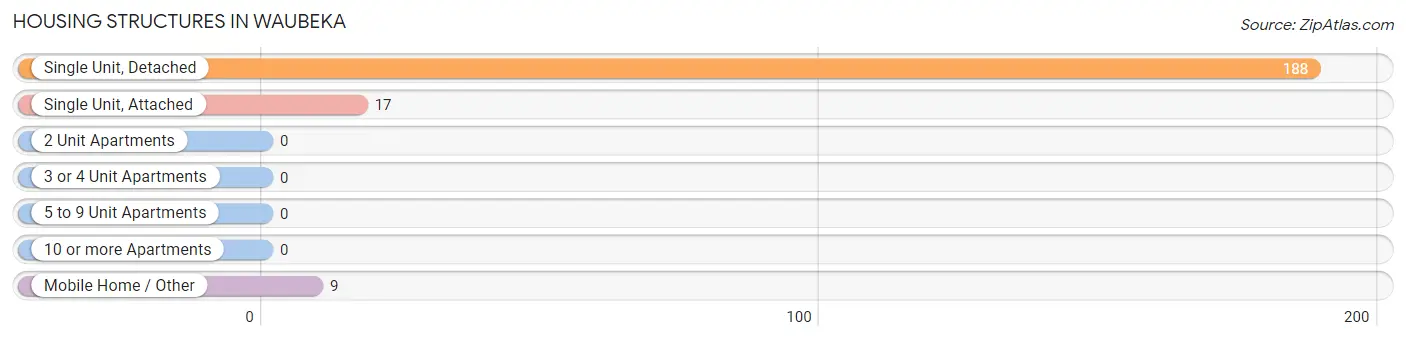
| Structure Type | # Housing Units | % Housing Units |
| Single Unit, Detached | 188 | 87.8% |
| Single Unit, Attached | 17 | 7.9% |
| 2 Unit Apartments | 0 | 0.0% |
| 3 or 4 Unit Apartments | 0 | 0.0% |
| 5 to 9 Unit Apartments | 0 | 0.0% |
| 10 or more Apartments | 0 | 0.0% |
| Mobile Home / Other | 9 | 4.2% |
| Total | 214 | 100.0% |
Housing Structures by Occupancy in Waubeka
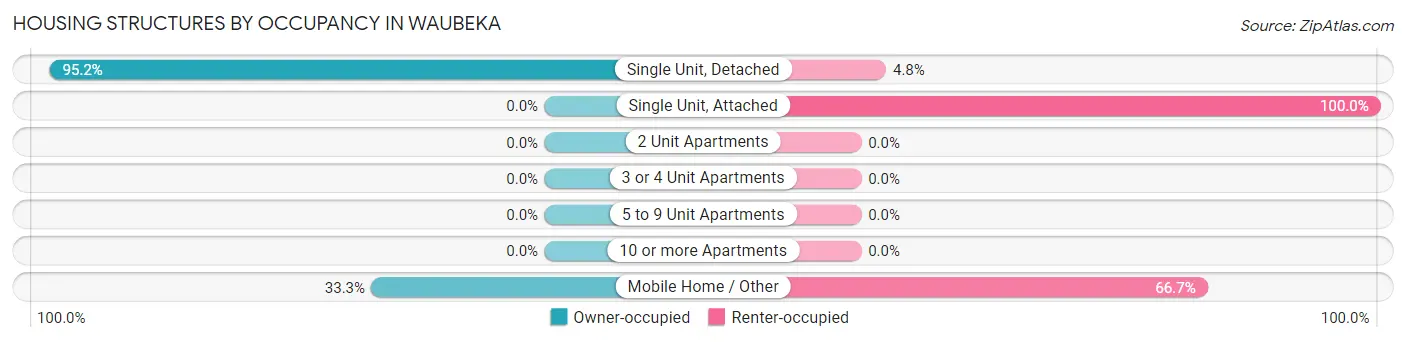
| Structure Type | Owner-occupied | Renter-occupied |
| Single Unit, Detached | 179 (95.2%) | 9 (4.8%) |
| Single Unit, Attached | 0 (0.0%) | 17 (100.0%) |
| 2 Unit Apartments | 0 (0.0%) | 0 (0.0%) |
| 3 or 4 Unit Apartments | 0 (0.0%) | 0 (0.0%) |
| 5 to 9 Unit Apartments | 0 (0.0%) | 0 (0.0%) |
| 10 or more Apartments | 0 (0.0%) | 0 (0.0%) |
| Mobile Home / Other | 3 (33.3%) | 6 (66.7%) |
| Total | 182 (85.1%) | 32 (14.9%) |
Housing Structures by Number of Rooms in Waubeka
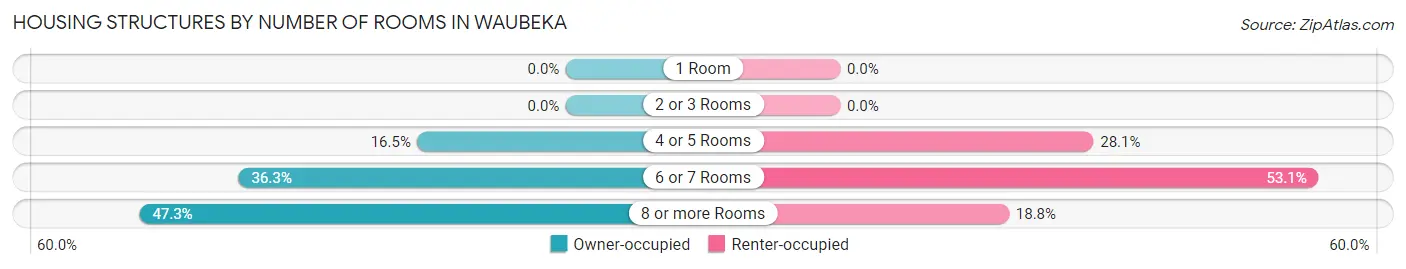
| Number of Rooms | Owner-occupied | Renter-occupied |
| 1 Room | 0 (0.0%) | 0 (0.0%) |
| 2 or 3 Rooms | 0 (0.0%) | 0 (0.0%) |
| 4 or 5 Rooms | 30 (16.5%) | 9 (28.1%) |
| 6 or 7 Rooms | 66 (36.3%) | 17 (53.1%) |
| 8 or more Rooms | 86 (47.2%) | 6 (18.8%) |
| Total | 182 (100.0%) | 32 (100.0%) |
Housing Structure by Heating Type in Waubeka
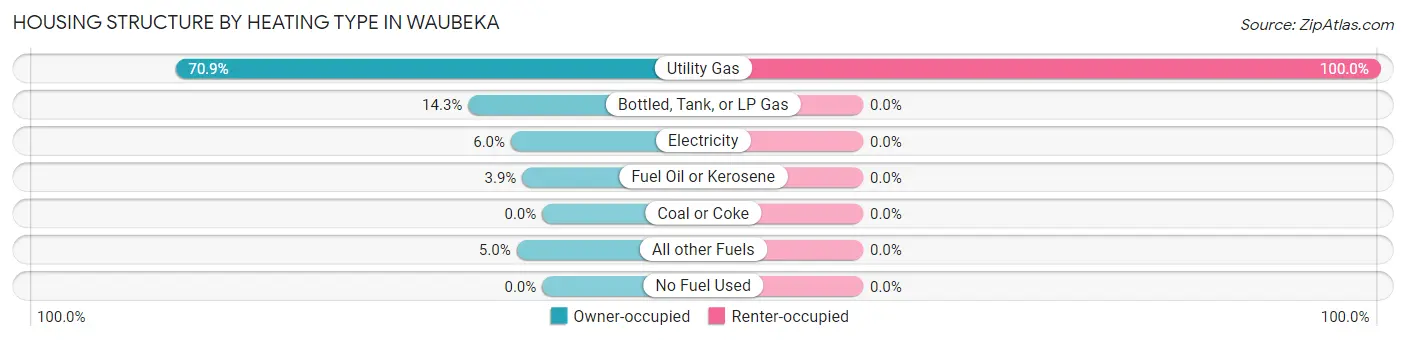
| Heating Type | Owner-occupied | Renter-occupied |
| Utility Gas | 129 (70.9%) | 32 (100.0%) |
| Bottled, Tank, or LP Gas | 26 (14.3%) | 0 (0.0%) |
| Electricity | 11 (6.0%) | 0 (0.0%) |
| Fuel Oil or Kerosene | 7 (3.8%) | 0 (0.0%) |
| Coal or Coke | 0 (0.0%) | 0 (0.0%) |
| All other Fuels | 9 (5.0%) | 0 (0.0%) |
| No Fuel Used | 0 (0.0%) | 0 (0.0%) |
| Total | 182 (100.0%) | 32 (100.0%) |
Household Vehicle Usage in Waubeka
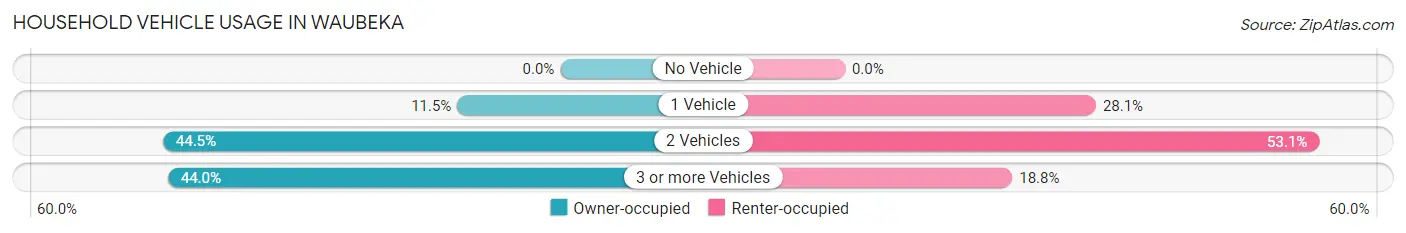
| Vehicles per Household | Owner-occupied | Renter-occupied |
| No Vehicle | 0 (0.0%) | 0 (0.0%) |
| 1 Vehicle | 21 (11.5%) | 9 (28.1%) |
| 2 Vehicles | 81 (44.5%) | 17 (53.1%) |
| 3 or more Vehicles | 80 (44.0%) | 6 (18.8%) |
| Total | 182 (100.0%) | 32 (100.0%) |
Real Estate & Mortgages in Waubeka
Real Estate and Mortgage Overview in Waubeka
| Characteristic | Without Mortgage | With Mortgage |
| Housing Units | 69 | 113 |
| Median Property Value | $201,800 | $253,900 |
| Median Household Income | $67,875 | $15 |
| Monthly Housing Costs | $550 | $0 |
| Real Estate Taxes | $2,771 | $0 |
Property Value by Mortgage Status in Waubeka
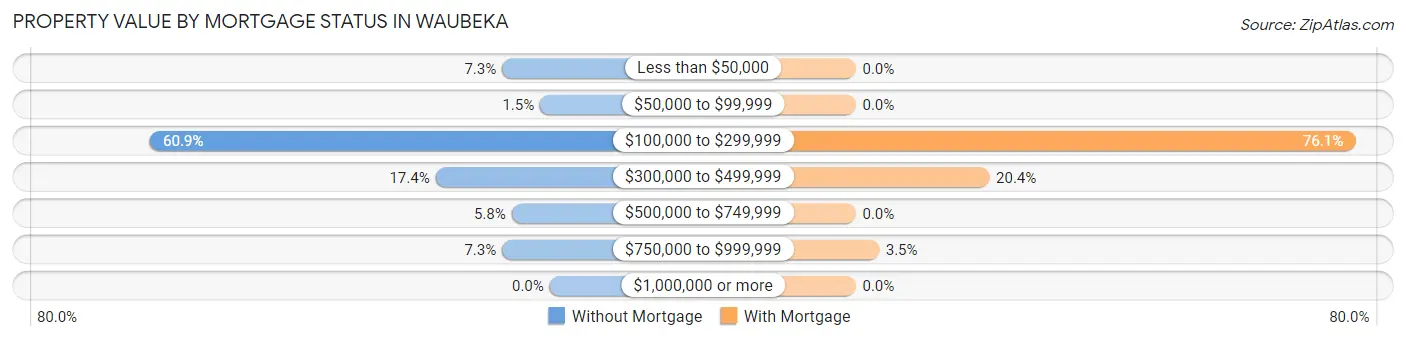
| Property Value | Without Mortgage | With Mortgage |
| Less than $50,000 | 5 (7.2%) | 0 (0.0%) |
| $50,000 to $99,999 | 1 (1.5%) | 0 (0.0%) |
| $100,000 to $299,999 | 42 (60.9%) | 86 (76.1%) |
| $300,000 to $499,999 | 12 (17.4%) | 23 (20.3%) |
| $500,000 to $749,999 | 4 (5.8%) | 0 (0.0%) |
| $750,000 to $999,999 | 5 (7.2%) | 4 (3.5%) |
| $1,000,000 or more | 0 (0.0%) | 0 (0.0%) |
| Total | 69 (100.0%) | 113 (100.0%) |
Household Income by Mortgage Status in Waubeka
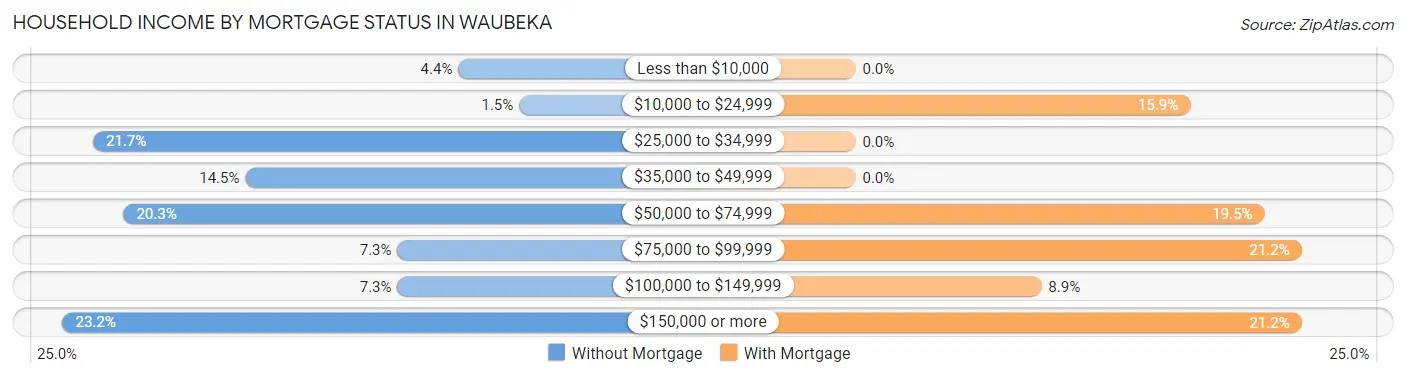
| Household Income | Without Mortgage | With Mortgage |
| Less than $10,000 | 3 (4.3%) | 0 (0.0%) |
| $10,000 to $24,999 | 1 (1.5%) | 18 (15.9%) |
| $25,000 to $34,999 | 15 (21.7%) | 0 (0.0%) |
| $35,000 to $49,999 | 10 (14.5%) | 0 (0.0%) |
| $50,000 to $74,999 | 14 (20.3%) | 22 (19.5%) |
| $75,000 to $99,999 | 5 (7.2%) | 24 (21.2%) |
| $100,000 to $149,999 | 5 (7.2%) | 10 (8.8%) |
| $150,000 or more | 16 (23.2%) | 24 (21.2%) |
| Total | 69 (100.0%) | 113 (100.0%) |
Property Value to Household Income Ratio in Waubeka
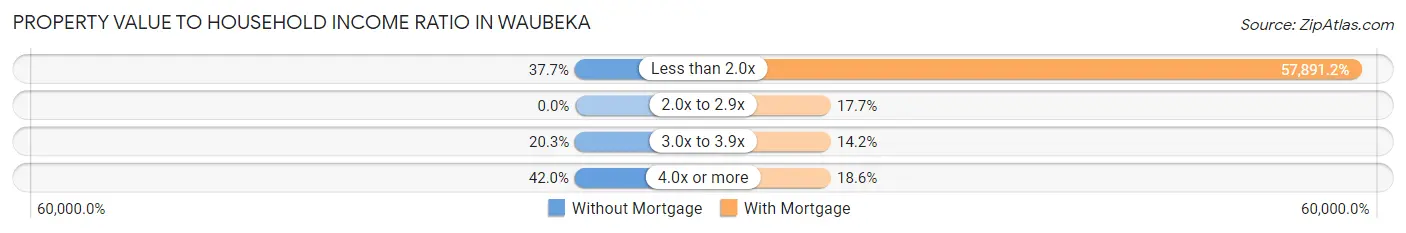
| Value-to-Income Ratio | Without Mortgage | With Mortgage |
| Less than 2.0x | 26 (37.7%) | 65,417 (57,891.2%) |
| 2.0x to 2.9x | 0 (0.0%) | 20 (17.7%) |
| 3.0x to 3.9x | 14 (20.3%) | 16 (14.2%) |
| 4.0x or more | 29 (42.0%) | 21 (18.6%) |
| Total | 69 (100.0%) | 113 (100.0%) |
Real Estate Taxes by Mortgage Status in Waubeka
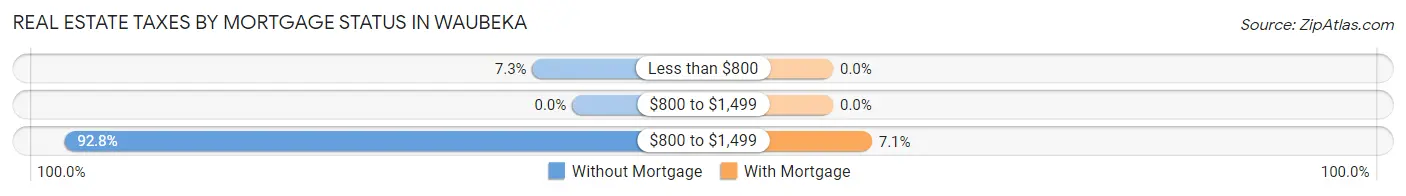
| Property Taxes | Without Mortgage | With Mortgage |
| Less than $800 | 5 (7.2%) | 0 (0.0%) |
| $800 to $1,499 | 0 (0.0%) | 0 (0.0%) |
| $800 to $1,499 | 64 (92.7%) | 8 (7.1%) |
| Total | 69 (100.0%) | 113 (100.0%) |
Health & Disability in Waubeka
Health Insurance Coverage by Age in Waubeka
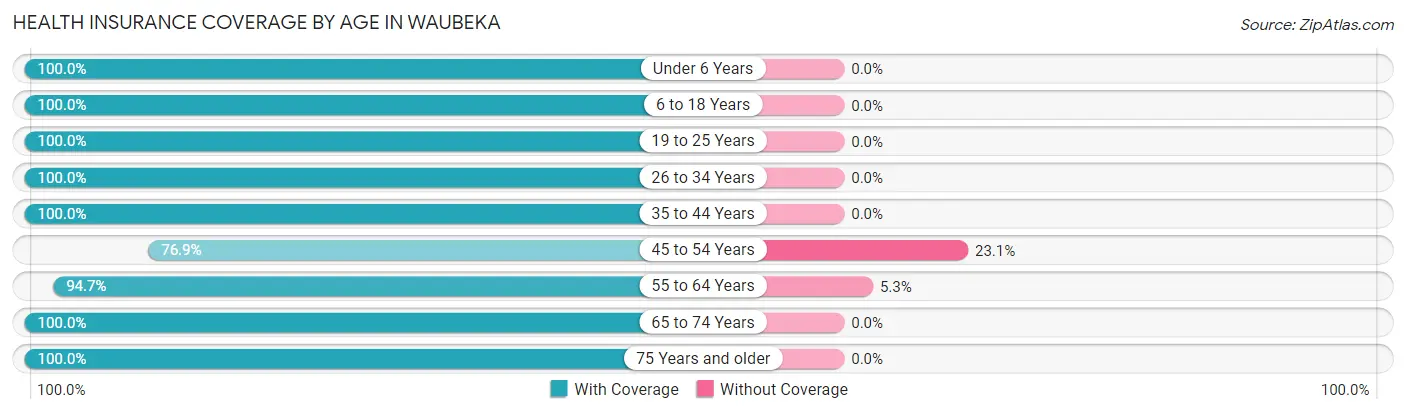
| Age Bracket | With Coverage | Without Coverage |
| Under 6 Years | 22 (100.0%) | 0 (0.0%) |
| 6 to 18 Years | 57 (100.0%) | 0 (0.0%) |
| 19 to 25 Years | 65 (100.0%) | 0 (0.0%) |
| 26 to 34 Years | 20 (100.0%) | 0 (0.0%) |
| 35 to 44 Years | 56 (100.0%) | 0 (0.0%) |
| 45 to 54 Years | 50 (76.9%) | 15 (23.1%) |
| 55 to 64 Years | 124 (94.7%) | 7 (5.3%) |
| 65 to 74 Years | 75 (100.0%) | 0 (0.0%) |
| 75 Years and older | 37 (100.0%) | 0 (0.0%) |
| Total | 506 (95.8%) | 22 (4.2%) |
Health Insurance Coverage by Citizenship Status in Waubeka
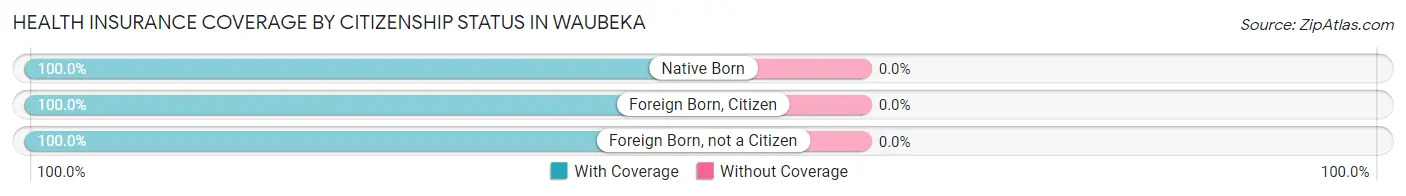
| Citizenship Status | With Coverage | Without Coverage |
| Native Born | 22 (100.0%) | 0 (0.0%) |
| Foreign Born, Citizen | 57 (100.0%) | 0 (0.0%) |
| Foreign Born, not a Citizen | 65 (100.0%) | 0 (0.0%) |
Health Insurance Coverage by Household Income in Waubeka
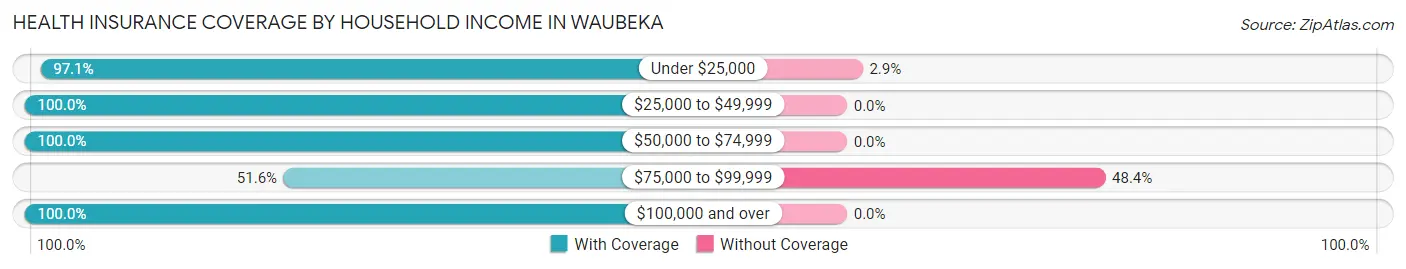
| Household Income | With Coverage | Without Coverage |
| Under $25,000 | 66 (97.1%) | 2 (2.9%) |
| $25,000 to $49,999 | 102 (100.0%) | 0 (0.0%) |
| $50,000 to $74,999 | 151 (100.0%) | 0 (0.0%) |
| $75,000 to $99,999 | 16 (51.6%) | 15 (48.4%) |
| $100,000 and over | 171 (100.0%) | 0 (0.0%) |
Public vs Private Health Insurance Coverage by Age in Waubeka
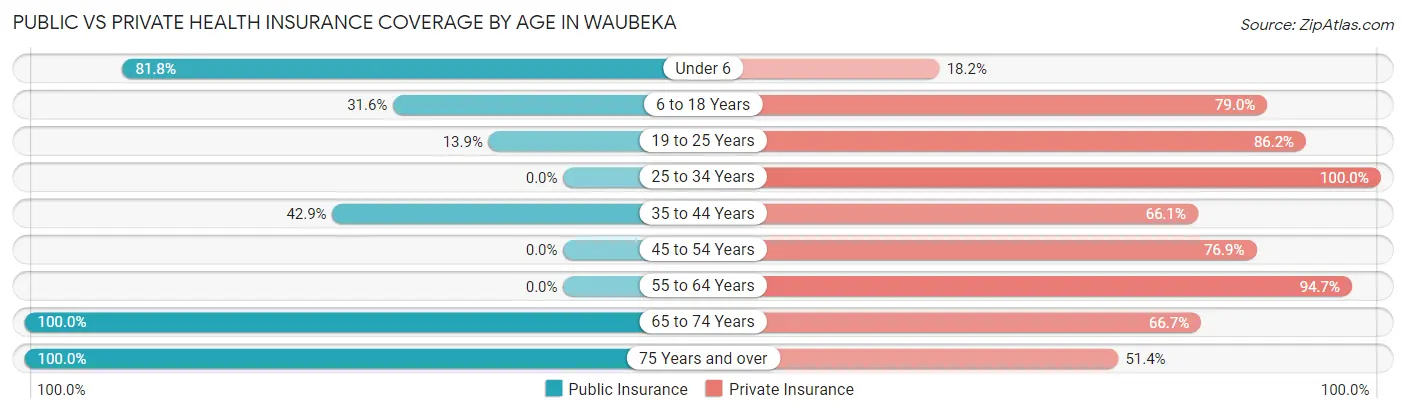
| Age Bracket | Public Insurance | Private Insurance |
| Under 6 | 18 (81.8%) | 4 (18.2%) |
| 6 to 18 Years | 18 (31.6%) | 45 (78.9%) |
| 19 to 25 Years | 9 (13.9%) | 56 (86.2%) |
| 25 to 34 Years | 0 (0.0%) | 20 (100.0%) |
| 35 to 44 Years | 24 (42.9%) | 37 (66.1%) |
| 45 to 54 Years | 0 (0.0%) | 50 (76.9%) |
| 55 to 64 Years | 0 (0.0%) | 124 (94.7%) |
| 65 to 74 Years | 75 (100.0%) | 50 (66.7%) |
| 75 Years and over | 37 (100.0%) | 19 (51.3%) |
| Total | 181 (34.3%) | 405 (76.7%) |
Disability Status by Sex by Age in Waubeka
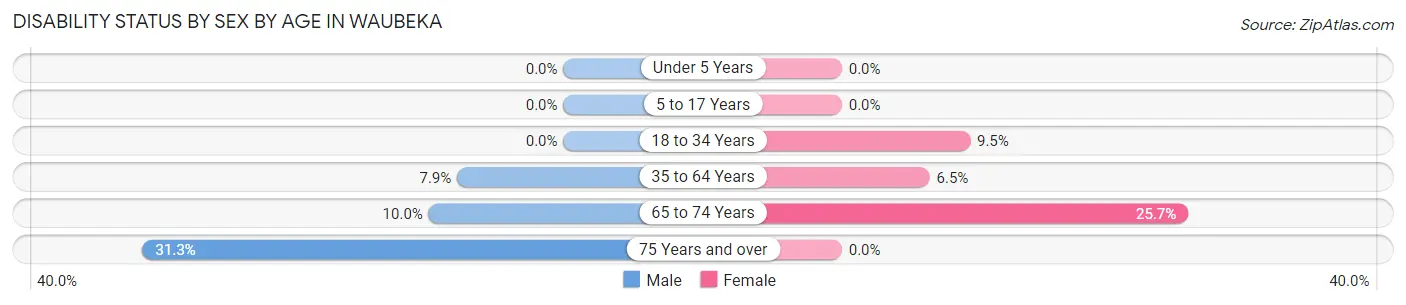
| Age Bracket | Male | Female |
| Under 5 Years | 0 (0.0%) | 0 (0.0%) |
| 5 to 17 Years | 0 (0.0%) | 0 (0.0%) |
| 18 to 34 Years | 0 (0.0%) | 6 (9.5%) |
| 35 to 64 Years | 9 (7.9%) | 9 (6.5%) |
| 65 to 74 Years | 4 (10.0%) | 9 (25.7%) |
| 75 Years and over | 10 (31.2%) | 0 (0.0%) |
Disability Class by Sex by Age in Waubeka
Disability Class: Hearing Difficulty
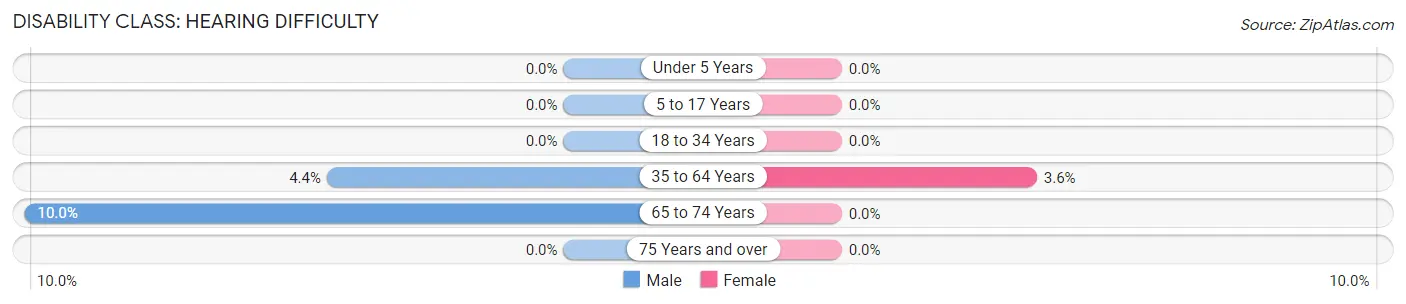
| Age Bracket | Male | Female |
| Under 5 Years | 0 (0.0%) | 0 (0.0%) |
| 5 to 17 Years | 0 (0.0%) | 0 (0.0%) |
| 18 to 34 Years | 0 (0.0%) | 0 (0.0%) |
| 35 to 64 Years | 5 (4.4%) | 5 (3.6%) |
| 65 to 74 Years | 4 (10.0%) | 0 (0.0%) |
| 75 Years and over | 0 (0.0%) | 0 (0.0%) |
Disability Class: Vision Difficulty
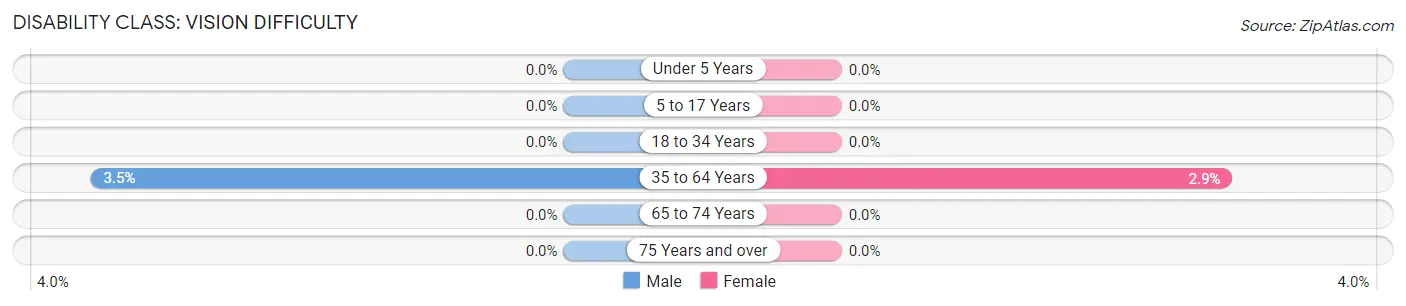
| Age Bracket | Male | Female |
| Under 5 Years | 0 (0.0%) | 0 (0.0%) |
| 5 to 17 Years | 0 (0.0%) | 0 (0.0%) |
| 18 to 34 Years | 0 (0.0%) | 0 (0.0%) |
| 35 to 64 Years | 4 (3.5%) | 4 (2.9%) |
| 65 to 74 Years | 0 (0.0%) | 0 (0.0%) |
| 75 Years and over | 0 (0.0%) | 0 (0.0%) |
Disability Class: Cognitive Difficulty
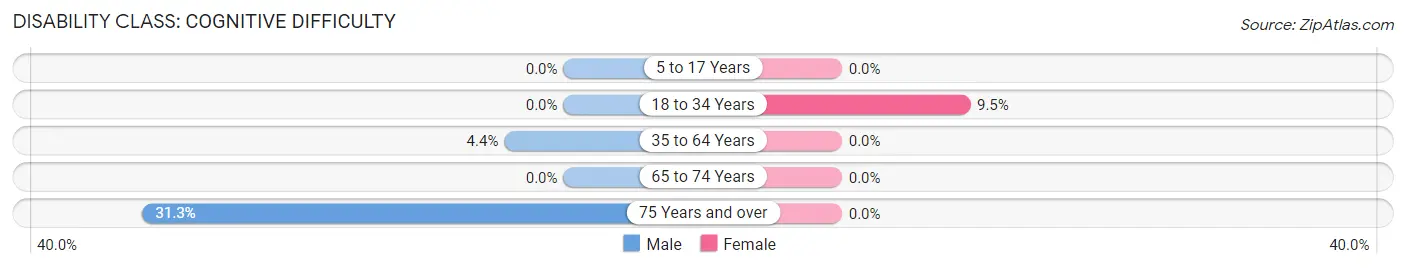
| Age Bracket | Male | Female |
| 5 to 17 Years | 0 (0.0%) | 0 (0.0%) |
| 18 to 34 Years | 0 (0.0%) | 6 (9.5%) |
| 35 to 64 Years | 5 (4.4%) | 0 (0.0%) |
| 65 to 74 Years | 0 (0.0%) | 0 (0.0%) |
| 75 Years and over | 10 (31.2%) | 0 (0.0%) |
Disability Class: Ambulatory Difficulty
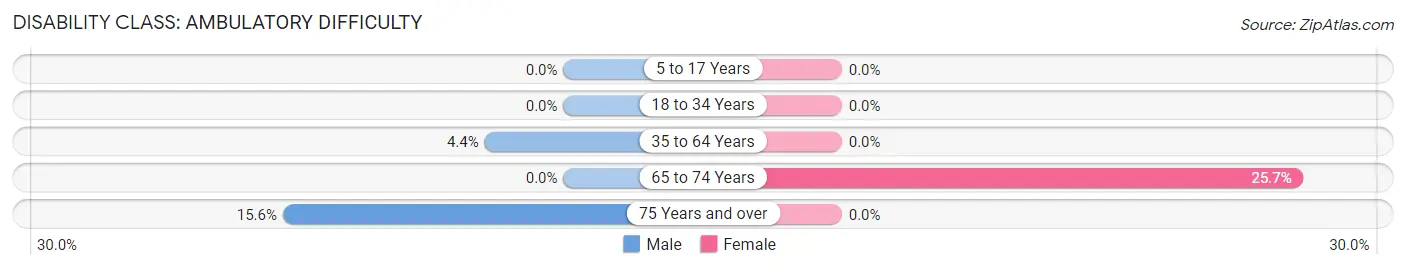
| Age Bracket | Male | Female |
| 5 to 17 Years | 0 (0.0%) | 0 (0.0%) |
| 18 to 34 Years | 0 (0.0%) | 0 (0.0%) |
| 35 to 64 Years | 5 (4.4%) | 0 (0.0%) |
| 65 to 74 Years | 0 (0.0%) | 9 (25.7%) |
| 75 Years and over | 5 (15.6%) | 0 (0.0%) |
Disability Class: Self-Care Difficulty
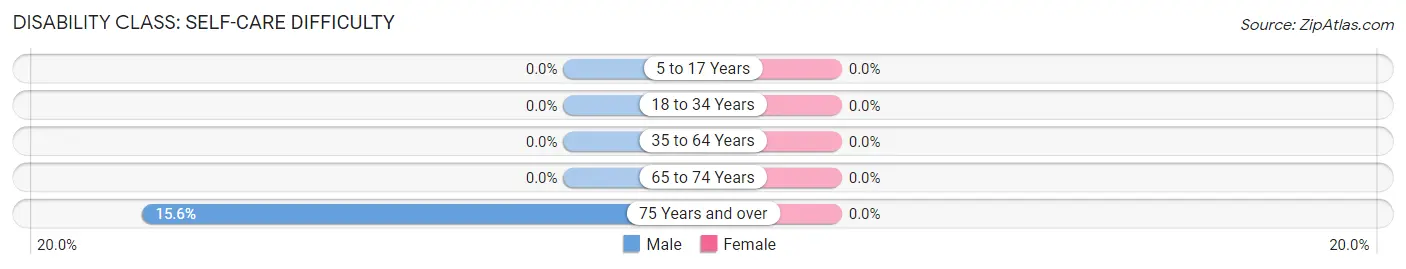
| Age Bracket | Male | Female |
| 5 to 17 Years | 0 (0.0%) | 0 (0.0%) |
| 18 to 34 Years | 0 (0.0%) | 0 (0.0%) |
| 35 to 64 Years | 0 (0.0%) | 0 (0.0%) |
| 65 to 74 Years | 0 (0.0%) | 0 (0.0%) |
| 75 Years and over | 5 (15.6%) | 0 (0.0%) |
Technology Access in Waubeka
Computing Device Access in Waubeka
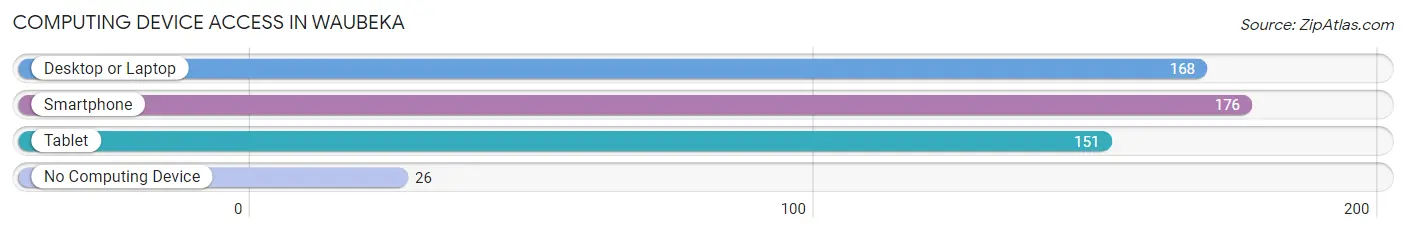
| Device Type | # Households | % Households |
| Desktop or Laptop | 168 | 78.5% |
| Smartphone | 176 | 82.2% |
| Tablet | 151 | 70.6% |
| No Computing Device | 26 | 12.1% |
| Total | 214 | 100.0% |
Internet Access in Waubeka
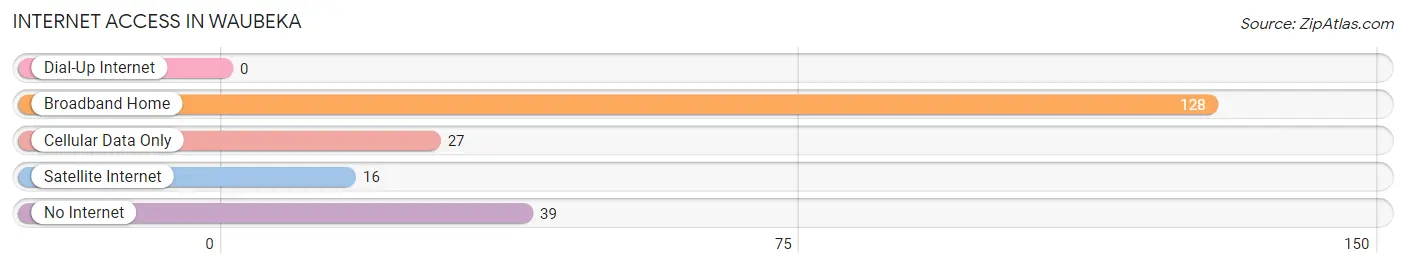
| Internet Type | # Households | % Households |
| Dial-Up Internet | 0 | 0.0% |
| Broadband Home | 128 | 59.8% |
| Cellular Data Only | 27 | 12.6% |
| Satellite Internet | 16 | 7.5% |
| No Internet | 39 | 18.2% |
| Total | 214 | 100.0% |
Waubeka Summary
Waubeka, Wisconsin is a small village located in Ozaukee County, Wisconsin. It is situated on the Milwaukee River, about 25 miles north of Milwaukee. The village has a population of about 1,000 people and is part of the Town of Fredonia. Waubeka is known for its historic sites, including the National Flag Day Foundation and the Waubeka Flag Day Parade.
Geography
Waubeka is located in the southeastern corner of Ozaukee County, Wisconsin. It is situated on the Milwaukee River, about 25 miles north of Milwaukee. The village is surrounded by the Town of Fredonia to the north, the Town of Saukville to the east, the Town of Port Washington to the south, and the Town of Grafton to the west. The village is located in the Kettle Moraine region of Wisconsin, which is characterized by rolling hills and glacial deposits.
The climate in Waubeka is typical of the Midwest, with cold winters and hot summers. The average annual temperature is around 45 degrees Fahrenheit, with an average high of around 70 degrees in the summer and an average low of around 20 degrees in the winter. The average annual precipitation is around 35 inches.
Economy
The economy of Waubeka is largely based on agriculture and tourism. The village is home to several farms, which produce a variety of crops, including corn, soybeans, and hay. The village also has several small businesses, including a grocery store, a hardware store, and a restaurant.
Tourism is an important part of the economy of Waubeka. The village is home to the National Flag Day Foundation, which hosts the annual Waubeka Flag Day Parade. The parade is held each year on June 14th, the anniversary of the first Flag Day celebration in Waubeka in 1885. The parade features marching bands, floats, and other activities. The village also hosts several other events throughout the year, including a summer festival and a Christmas parade.
Demographics
As of the 2010 census, the population of Waubeka was 1,039. The racial makeup of the village was 97.3% White, 0.7% African American, 0.3% Native American, 0.3% Asian, 0.2% from other races, and 1.3% from two or more races. Hispanic or Latino of any race were 1.3% of the population.
The median household income in Waubeka was $50,938, and the median family income was $60,000. The per capita income for the village was $25,938. About 4.3% of families and 5.3% of the population were below the poverty line, including 6.3% of those under age 18 and 4.3% of those age 65 or over.
Conclusion
Waubeka, Wisconsin is a small village located in Ozaukee County, Wisconsin. It is situated on the Milwaukee River, about 25 miles north of Milwaukee. The village has a population of about 1,000 people and is part of the Town of Fredonia. Waubeka is known for its historic sites, including the National Flag Day Foundation and the Waubeka Flag Day Parade. The economy of Waubeka is largely based on agriculture and tourism. The village is home to several farms, which produce a variety of crops, including corn, soybeans, and hay. The village also has several small businesses, including a grocery store, a hardware store, and a restaurant. The racial makeup of the village was 97.3% White, 0.7% African American, 0.3% Native American, 0.3% Asian, 0.2% from other races, and 1.3% from two or more races. The median household income in Waubeka was $50,938, and the median family income was $60,000. Waubeka is a small village with a rich history and a vibrant economy.
Common Questions
What is Per Capita Income in Waubeka?
Per Capita income in Waubeka is $52,217.
What is the Median Family Income in Waubeka?
Median Family Income in Waubeka is $62,344.
What is the Median Household income in Waubeka?
Median Household Income in Waubeka is $61,042.
What is Income or Wage Gap in Waubeka?
Income or Wage Gap in Waubeka is 15.3%.
Women in Waubeka earn 84.7 cents for every dollar earned by a man.
What is Inequality or Gini Index in Waubeka?
Inequality or Gini Index in Waubeka is 0.63.
What is the Total Population of Waubeka?
Total Population of Waubeka is 528.
What is the Total Male Population of Waubeka?
Total Male Population of Waubeka is 258.
What is the Total Female Population of Waubeka?
Total Female Population of Waubeka is 270.
What is the Ratio of Males per 100 Females in Waubeka?
There are 95.56 Males per 100 Females in Waubeka.
What is the Ratio of Females per 100 Males in Waubeka?
There are 104.65 Females per 100 Males in Waubeka.
What is the Median Population Age in Waubeka?
Median Population Age in Waubeka is 53.9 Years.
What is the Average Family Size in Waubeka
Average Family Size in Waubeka is 2.5 People.
What is the Average Household Size in Waubeka
Average Household Size in Waubeka is 2.4 People.
How Large is the Labor Force in Waubeka?
There are 345 People in the Labor Forcein in Waubeka.
What is the Percentage of People in the Labor Force in Waubeka?
72.2% of People are in the Labor Force in Waubeka.
What is the Unemployment Rate in Waubeka?
Unemployment Rate in Waubeka is 7.8%.