Como, WI Map & Demographics
Como Map
Como Overview
$37,641
PER CAPITA INCOME
$78,542
AVG FAMILY INCOME
$74,659
AVG HOUSEHOLD INCOME
25.1%
WAGE / INCOME GAP [ % ]
74.9¢/ $1
WAGE / INCOME GAP [ $ ]
0.38
INEQUALITY / GINI INDEX
2,309
TOTAL POPULATION
975
MALE POPULATION
1,334
FEMALE POPULATION
73.09
MALES / 100 FEMALES
136.82
FEMALES / 100 MALES
36.6
MEDIAN AGE
2.7
AVG FAMILY SIZE
2.2
AVG HOUSEHOLD SIZE
1,335
LABOR FORCE [ PEOPLE ]
70.8%
PERCENT IN LABOR FORCE
3.4%
UNEMPLOYMENT RATE
Income in Como
Income Overview in Como
Per Capita Income in Como is $37,641, while median incomes of families and households are $78,542 and $74,659 respectively.
| Characteristic | Number | Measure |
| Per Capita Income | 2,309 | $37,641 |
| Median Family Income | 686 | $78,542 |
| Mean Family Income | 686 | $103,111 |
| Median Household Income | 1,040 | $74,659 |
| Mean Household Income | 1,040 | $91,581 |
| Income Deficit | 686 | $0 |
| Wage / Income Gap (%) | 2,309 | 25.11% |
| Wage / Income Gap ($) | 2,309 | 74.89¢ per $1 |
| Gini / Inequality Index | 2,309 | 0.38 |
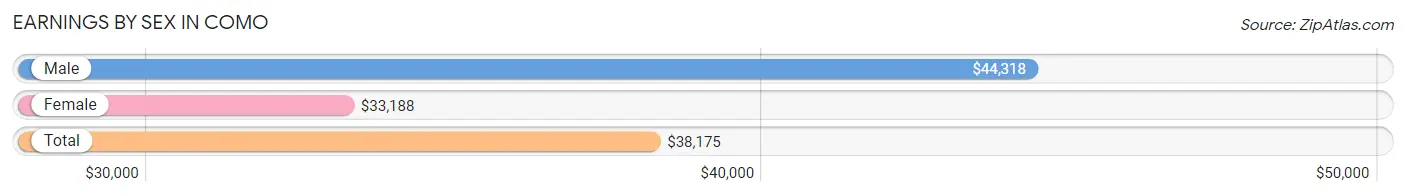
Earnings by Sex in Como
Average Earnings in Como are $38,175, $44,318 for men and $33,188 for women, a difference of 25.1%.
| Sex | Number | Average Earnings |
| Male | 556 (40.4%) | $44,318 |
| Female | 821 (59.6%) | $33,188 |
| Total | 1,377 (100.0%) | $38,175 |
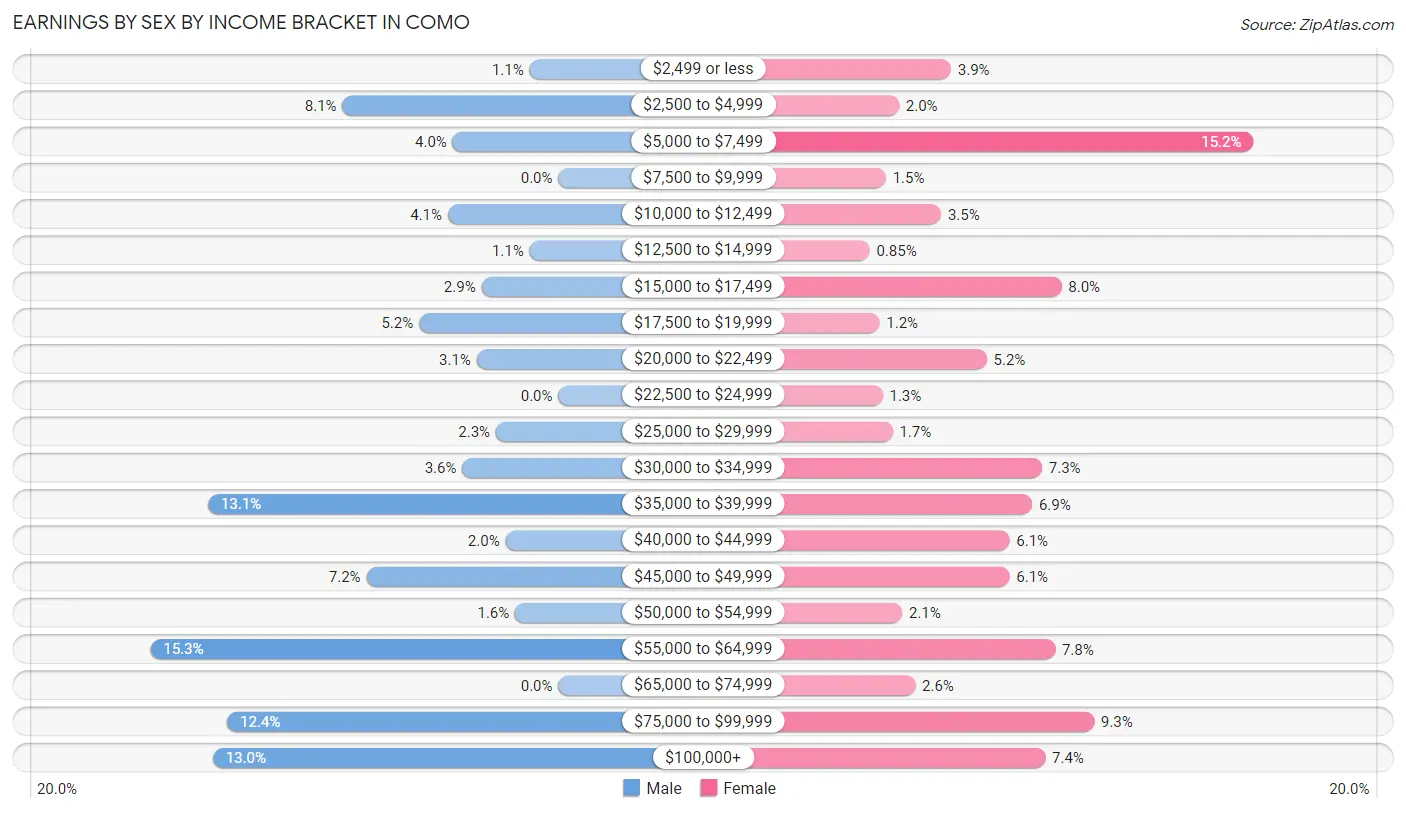
Earnings by Sex by Income Bracket in Como
The most common earnings brackets in Como are $55,000 to $64,999 for men (85 | 15.3%) and $5,000 to $7,499 for women (125 | 15.2%).
| Income | Male | Female |
| $2,499 or less | 6 (1.1%) | 32 (3.9%) |
| $2,500 to $4,999 | 45 (8.1%) | 16 (1.9%) |
| $5,000 to $7,499 | 22 (4.0%) | 125 (15.2%) |
| $7,500 to $9,999 | 0 (0.0%) | 12 (1.5%) |
| $10,000 to $12,499 | 23 (4.1%) | 29 (3.5%) |
| $12,500 to $14,999 | 6 (1.1%) | 7 (0.9%) |
| $15,000 to $17,499 | 16 (2.9%) | 66 (8.0%) |
| $17,500 to $19,999 | 29 (5.2%) | 10 (1.2%) |
| $20,000 to $22,499 | 17 (3.1%) | 43 (5.2%) |
| $22,500 to $24,999 | 0 (0.0%) | 11 (1.3%) |
| $25,000 to $29,999 | 13 (2.3%) | 14 (1.7%) |
| $30,000 to $34,999 | 20 (3.6%) | 60 (7.3%) |
| $35,000 to $39,999 | 73 (13.1%) | 57 (6.9%) |
| $40,000 to $44,999 | 11 (2.0%) | 50 (6.1%) |
| $45,000 to $49,999 | 40 (7.2%) | 50 (6.1%) |
| $50,000 to $54,999 | 9 (1.6%) | 17 (2.1%) |
| $55,000 to $64,999 | 85 (15.3%) | 64 (7.8%) |
| $65,000 to $74,999 | 0 (0.0%) | 21 (2.6%) |
| $75,000 to $99,999 | 69 (12.4%) | 76 (9.3%) |
| $100,000+ | 72 (13.0%) | 61 (7.4%) |
| Total | 556 (100.0%) | 821 (100.0%) |
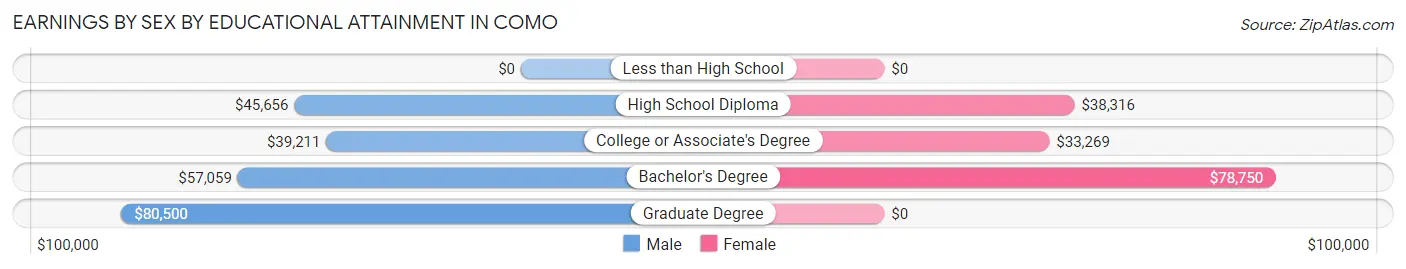
Earnings by Sex by Educational Attainment in Como
Average earnings in Como are $46,500 for men and $41,713 for women, a difference of 10.3%. Men with an educational attainment of graduate degree enjoy the highest average annual earnings of $80,500, while those with college or associate's degree education earn the least with $39,211. Women with an educational attainment of bachelor's degree earn the most with the average annual earnings of $78,750, while those with college or associate's degree education have the smallest earnings of $33,269.
| Educational Attainment | Male Income | Female Income |
| Less than High School | - | - |
| High School Diploma | $45,656 | $38,316 |
| College or Associate's Degree | $39,211 | $33,269 |
| Bachelor's Degree | $57,059 | $78,750 |
| Graduate Degree | $80,500 | $0 |
| Total | $46,500 | $41,713 |
Family Income in Como
Family Income Brackets in Como
According to the Como family income data, there are 208 families falling into the $50,000 to $74,999 income range, which is the most common income bracket and makes up 30.3% of all families.
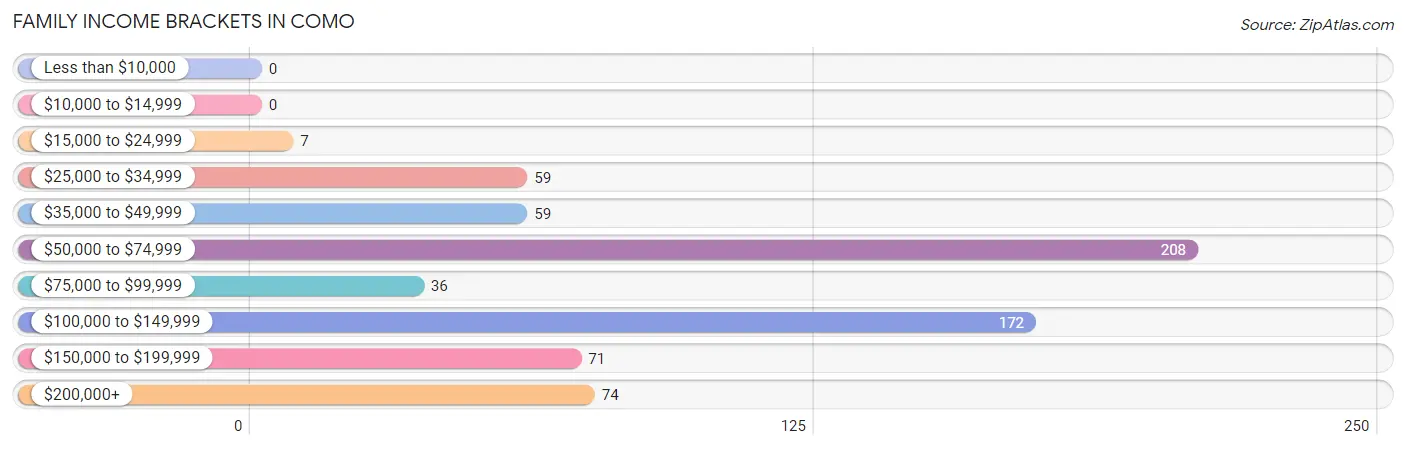
| Income Bracket | # Families | % Families |
| Less than $10,000 | 0 | 0.0% |
| $10,000 to $14,999 | 0 | 0.0% |
| $15,000 to $24,999 | 7 | 1.0% |
| $25,000 to $34,999 | 59 | 8.6% |
| $35,000 to $49,999 | 59 | 8.6% |
| $50,000 to $74,999 | 208 | 30.3% |
| $75,000 to $99,999 | 36 | 5.2% |
| $100,000 to $149,999 | 172 | 25.1% |
| $150,000 to $199,999 | 71 | 10.3% |
| $200,000+ | 74 | 10.8% |
Family Income by Famaliy Size in Como
5-person families (28 | 4.1%) account for the highest median family income in Como with $133,846 per family, while 2-person families (347 | 50.6%) have the highest median income of $34,682 per family member.
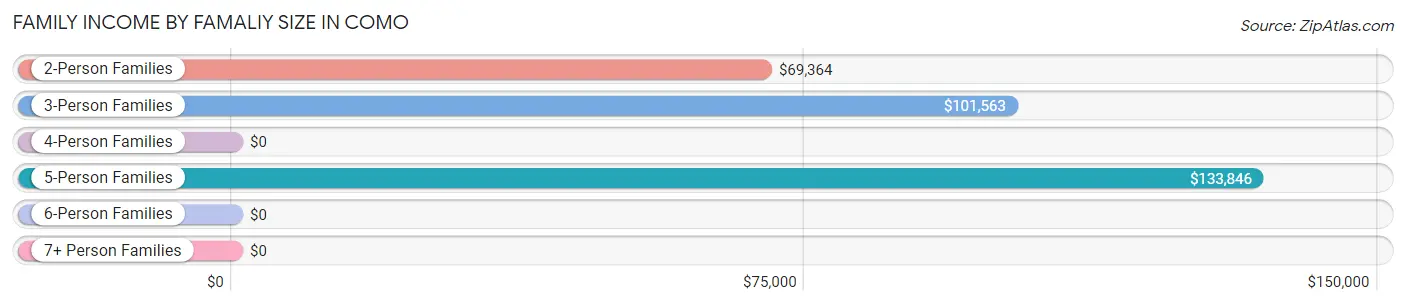
| Income Bracket | # Families | Median Income |
| 2-Person Families | 347 (50.6%) | $69,364 |
| 3-Person Families | 101 (14.7%) | $101,563 |
| 4-Person Families | 150 (21.9%) | $0 |
| 5-Person Families | 28 (4.1%) | $133,846 |
| 6-Person Families | 60 (8.7%) | $0 |
| 7+ Person Families | 0 (0.0%) | $0 |
| Total | 686 (100.0%) | $78,542 |
Family Income by Number of Earners in Como
The median family income in Como is $78,542, with families comprising 3+ earners (125) having the highest median family income of $174,219, while families with 1 earner (135) have the lowest median family income of $66,042, accounting for 18.2% and 19.7% of families, respectively.
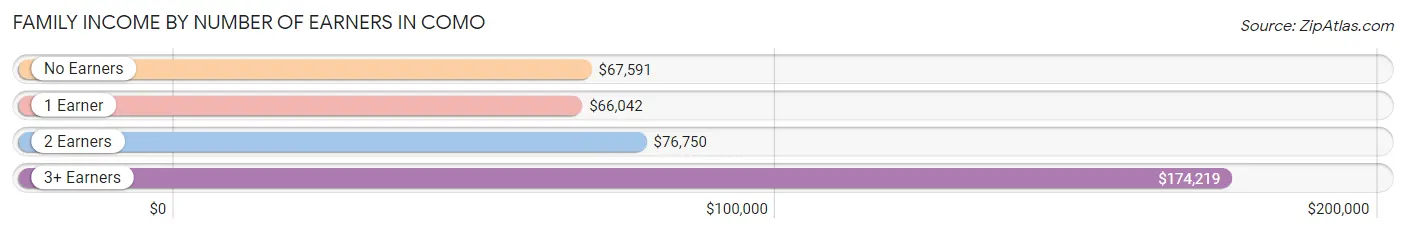
| Number of Earners | # Families | Median Income |
| No Earners | 117 (17.1%) | $67,591 |
| 1 Earner | 135 (19.7%) | $66,042 |
| 2 Earners | 309 (45.0%) | $76,750 |
| 3+ Earners | 125 (18.2%) | $174,219 |
| Total | 686 (100.0%) | $78,542 |
Household Income in Como
Household Income Brackets in Como
With 269 households falling in the category, the $100,000 to $149,999 income range is the most frequent in Como, accounting for 25.9% of all households. In contrast, only 20 households (1.9%) fall into the less than $10,000 income bracket, making it the least populous group.
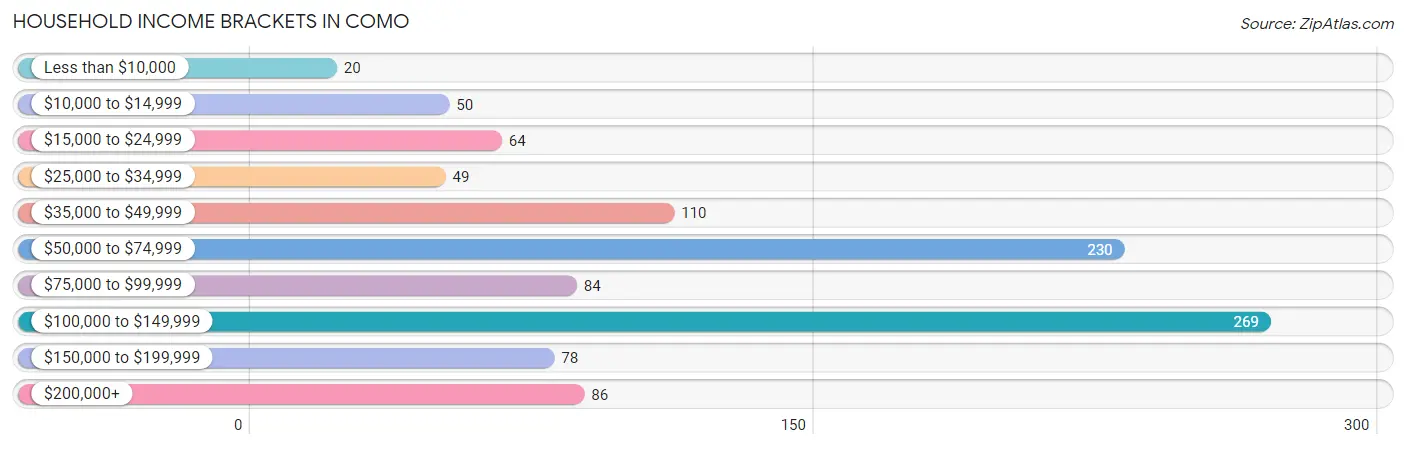
| Income Bracket | # Households | % Households |
| Less than $10,000 | 20 | 1.9% |
| $10,000 to $14,999 | 50 | 4.8% |
| $15,000 to $24,999 | 64 | 6.2% |
| $25,000 to $34,999 | 49 | 4.7% |
| $35,000 to $49,999 | 110 | 10.6% |
| $50,000 to $74,999 | 230 | 22.1% |
| $75,000 to $99,999 | 84 | 8.1% |
| $100,000 to $149,999 | 269 | 25.9% |
| $150,000 to $199,999 | 78 | 7.5% |
| $200,000+ | 86 | 8.3% |
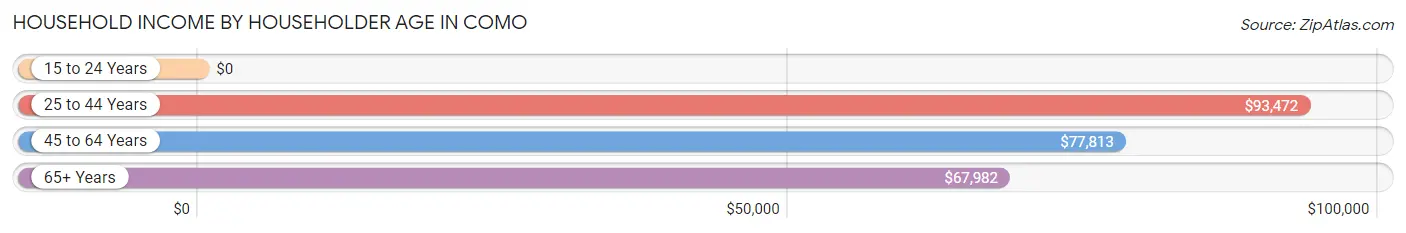
Household Income by Householder Age in Como
The median household income in Como is $74,659, with the highest median household income of $93,472 found in the 25 to 44 years age bracket for the primary householder. A total of 421 households (40.5%) fall into this category.
| Income Bracket | # Households | Median Income |
| 15 to 24 Years | 0 (0.0%) | $0 |
| 25 to 44 Years | 421 (40.5%) | $93,472 |
| 45 to 64 Years | 323 (31.1%) | $77,813 |
| 65+ Years | 296 (28.5%) | $67,982 |
| Total | 1,040 (100.0%) | $74,659 |
Poverty in Como
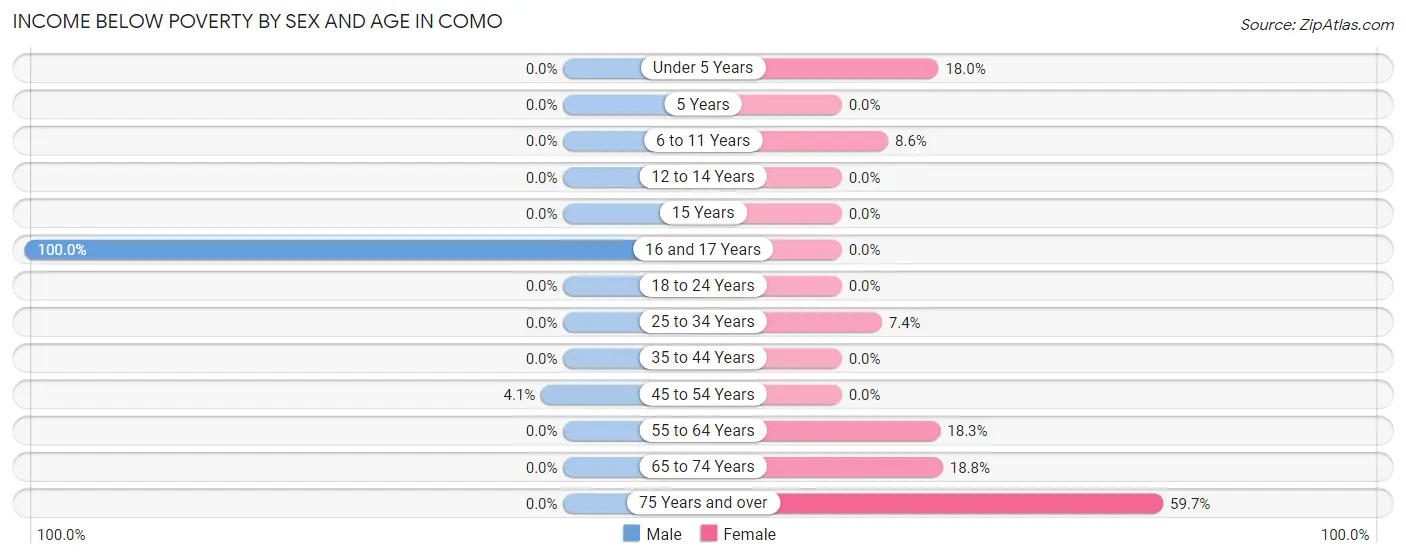
Income Below Poverty by Sex and Age in Como
With 2.0% poverty level for males and 9.6% for females among the residents of Como, 16 and 17 year old males and 75 year old and over females are the most vulnerable to poverty, with 12 males (100.0%) and 34 females (59.7%) in their respective age groups living below the poverty level.
| Age Bracket | Male | Female |
| Under 5 Years | 0 (0.0%) | 7 (17.9%) |
| 5 Years | 0 (0.0%) | 0 (0.0%) |
| 6 to 11 Years | 0 (0.0%) | 16 (8.6%) |
| 12 to 14 Years | 0 (0.0%) | 0 (0.0%) |
| 15 Years | 0 (0.0%) | 0 (0.0%) |
| 16 and 17 Years | 12 (100.0%) | 0 (0.0%) |
| 18 to 24 Years | 0 (0.0%) | 0 (0.0%) |
| 25 to 34 Years | 0 (0.0%) | 20 (7.4%) |
| 35 to 44 Years | 0 (0.0%) | 0 (0.0%) |
| 45 to 54 Years | 7 (4.1%) | 0 (0.0%) |
| 55 to 64 Years | 0 (0.0%) | 30 (18.3%) |
| 65 to 74 Years | 0 (0.0%) | 21 (18.8%) |
| 75 Years and over | 0 (0.0%) | 34 (59.7%) |
| Total | 19 (2.0%) | 128 (9.6%) |
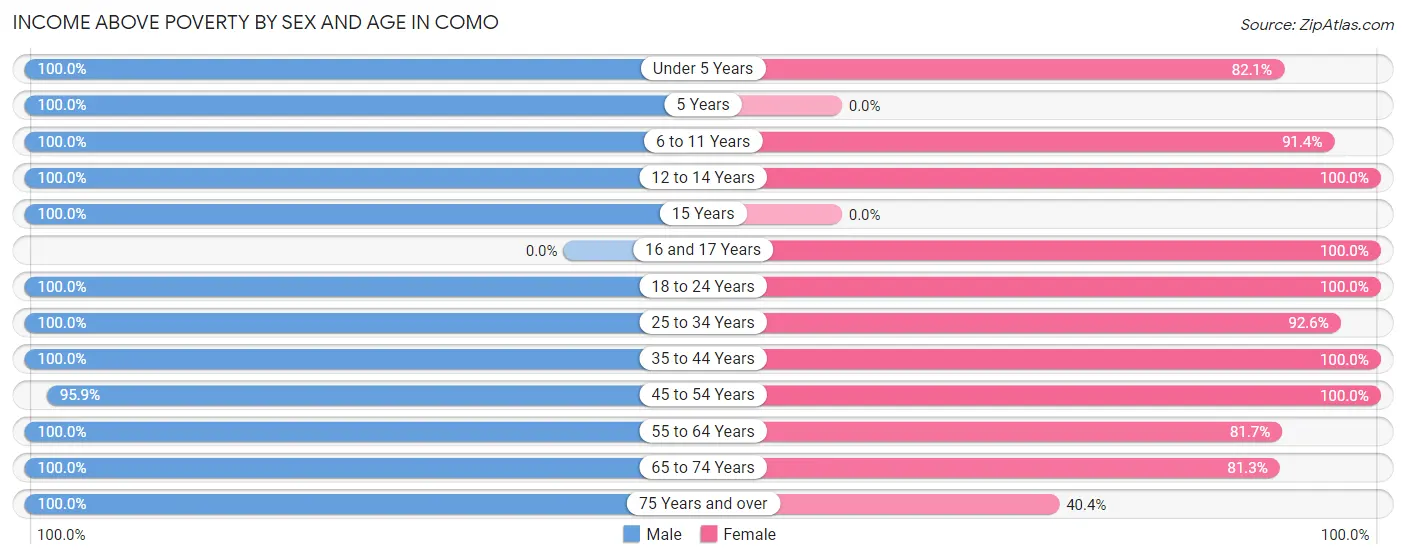
Income Above Poverty by Sex and Age in Como
According to the poverty statistics in Como, males aged under 5 years and females aged 12 to 14 years are the age groups that are most secure financially, with 100.0% of males and 100.0% of females in these age groups living above the poverty line.
| Age Bracket | Male | Female |
| Under 5 Years | 32 (100.0%) | 32 (82.1%) |
| 5 Years | 15 (100.0%) | 0 (0.0%) |
| 6 to 11 Years | 87 (100.0%) | 170 (91.4%) |
| 12 to 14 Years | 25 (100.0%) | 29 (100.0%) |
| 15 Years | 3 (100.0%) | 0 (0.0%) |
| 16 and 17 Years | 0 (0.0%) | 55 (100.0%) |
| 18 to 24 Years | 70 (100.0%) | 141 (100.0%) |
| 25 to 34 Years | 171 (100.0%) | 249 (92.6%) |
| 35 to 44 Years | 78 (100.0%) | 139 (100.0%) |
| 45 to 54 Years | 163 (95.9%) | 143 (100.0%) |
| 55 to 64 Years | 121 (100.0%) | 134 (81.7%) |
| 65 to 74 Years | 134 (100.0%) | 91 (81.2%) |
| 75 Years and over | 50 (100.0%) | 23 (40.4%) |
| Total | 949 (98.0%) | 1,206 (90.4%) |
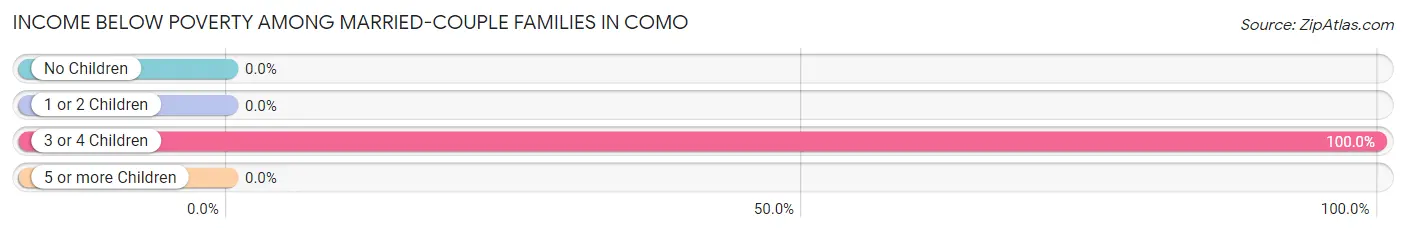
Income Below Poverty Among Married-Couple Families in Como
The poverty statistics for married-couple families in Como show that 1.4% or 7 of the total 516 families live below the poverty line. Families with 3 or 4 children have the highest poverty rate of 100.0%, comprising of 7 families. On the other hand, families with no children have the lowest poverty rate of 0.0%, which includes 0 families.
| Children | Above Poverty | Below Poverty |
| No Children | 275 (100.0%) | 0 (0.0%) |
| 1 or 2 Children | 234 (100.0%) | 0 (0.0%) |
| 3 or 4 Children | 0 (0.0%) | 7 (100.0%) |
| 5 or more Children | 0 (0.0%) | 0 (0.0%) |
| Total | 509 (98.6%) | 7 (1.4%) |
Income Below Poverty Among Single-Parent Households in Como
| Children | Single Father | Single Mother |
| No Children | 0 (0.0%) | 0 (0.0%) |
| 1 or 2 Children | 0 (0.0%) | 0 (0.0%) |
| 3 or 4 Children | 0 (0.0%) | 0 (0.0%) |
| 5 or more Children | 0 (0.0%) | 0 (0.0%) |
| Total | 0 (0.0%) | 0 (0.0%) |
Income Below Poverty Among Married-Couple vs Single-Parent Households in Como
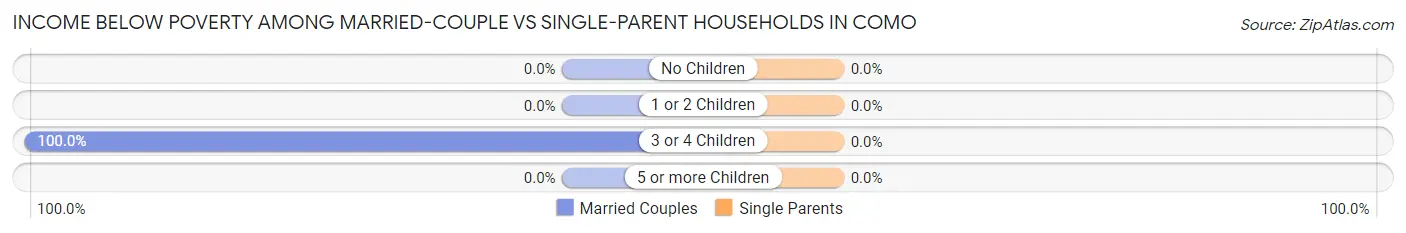
| Children | Married-Couple Families | Single-Parent Households |
| No Children | 0 (0.0%) | 0 (0.0%) |
| 1 or 2 Children | 0 (0.0%) | 0 (0.0%) |
| 3 or 4 Children | 7 (100.0%) | 0 (0.0%) |
| 5 or more Children | 0 (0.0%) | 0 (0.0%) |
| Total | 7 (1.4%) | 0 (0.0%) |
Race in Como
The most populous races in Como are White / Caucasian (1,970 | 85.3%), Hispanic or Latino (192 | 8.3%), and Some other Race (170 | 7.4%).
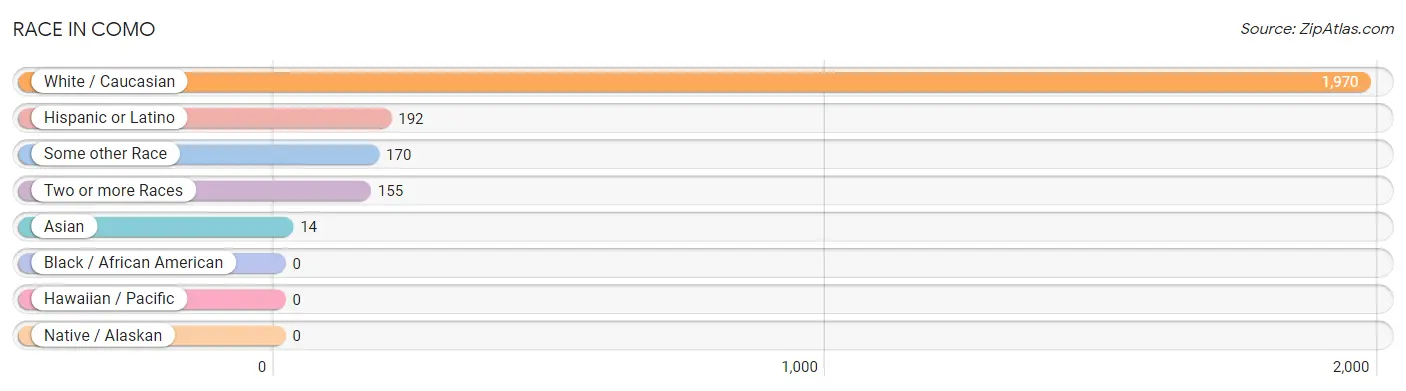
| Race | # Population | % Population |
| Asian | 14 | 0.6% |
| Black / African American | 0 | 0.0% |
| Hawaiian / Pacific | 0 | 0.0% |
| Hispanic or Latino | 192 | 8.3% |
| Native / Alaskan | 0 | 0.0% |
| White / Caucasian | 1,970 | 85.3% |
| Two or more Races | 155 | 6.7% |
| Some other Race | 170 | 7.4% |
| Total | 2,309 | 100.0% |
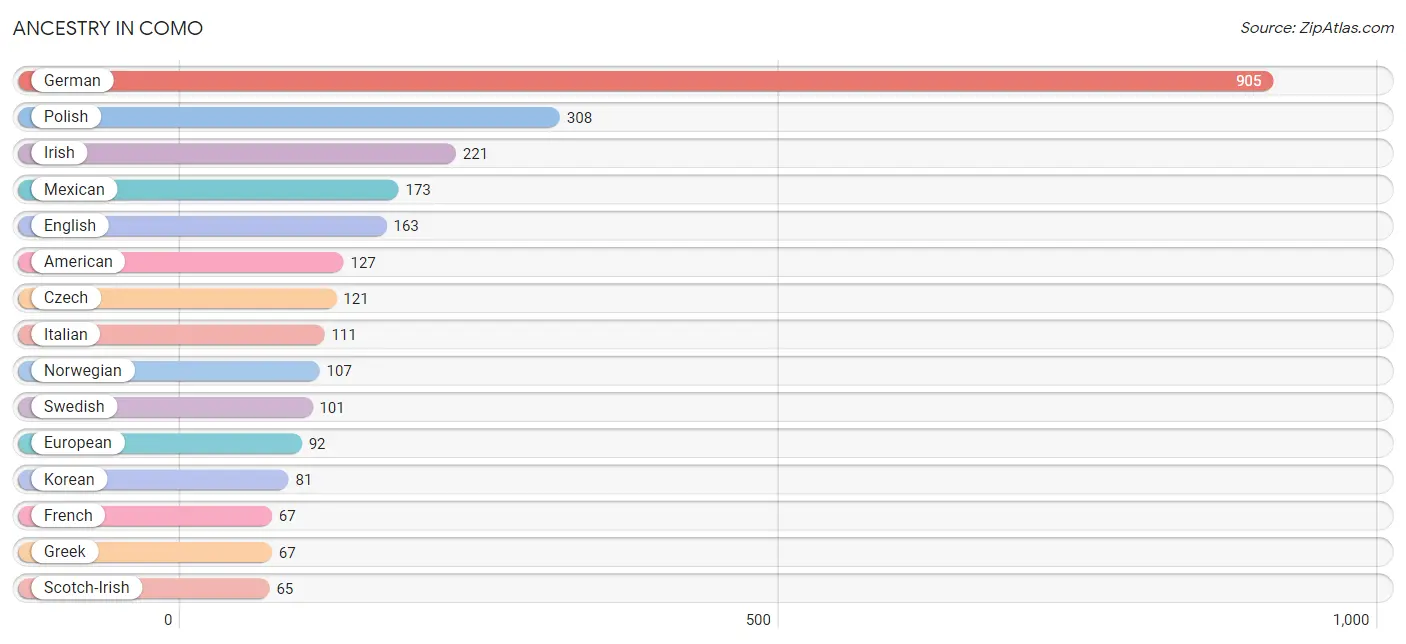
Ancestry in Como
The most populous ancestries reported in Como are German (905 | 39.2%), Polish (308 | 13.3%), Irish (221 | 9.6%), Mexican (173 | 7.5%), and English (163 | 7.1%), together accounting for 76.6% of all Como residents.
| Ancestry | # Population | % Population |
| American | 127 | 5.5% |
| Austrian | 20 | 0.9% |
| British | 6 | 0.3% |
| Chippewa | 10 | 0.4% |
| Cuban | 19 | 0.8% |
| Czech | 121 | 5.2% |
| Danish | 51 | 2.2% |
| Dutch | 15 | 0.6% |
| English | 163 | 7.1% |
| European | 92 | 4.0% |
| Finnish | 10 | 0.4% |
| French | 67 | 2.9% |
| French Canadian | 15 | 0.6% |
| German | 905 | 39.2% |
| Greek | 67 | 2.9% |
| Irish | 221 | 9.6% |
| Italian | 111 | 4.8% |
| Korean | 81 | 3.5% |
| Lithuanian | 6 | 0.3% |
| Malaysian | 14 | 0.6% |
| Mexican | 173 | 7.5% |
| Norwegian | 107 | 4.6% |
| Polish | 308 | 13.3% |
| Scotch-Irish | 65 | 2.8% |
| Swedish | 101 | 4.4% |
| Welsh | 14 | 0.6% |
| Yugoslavian | 7 | 0.3% | View All 27 Rows |
Immigrants in Como
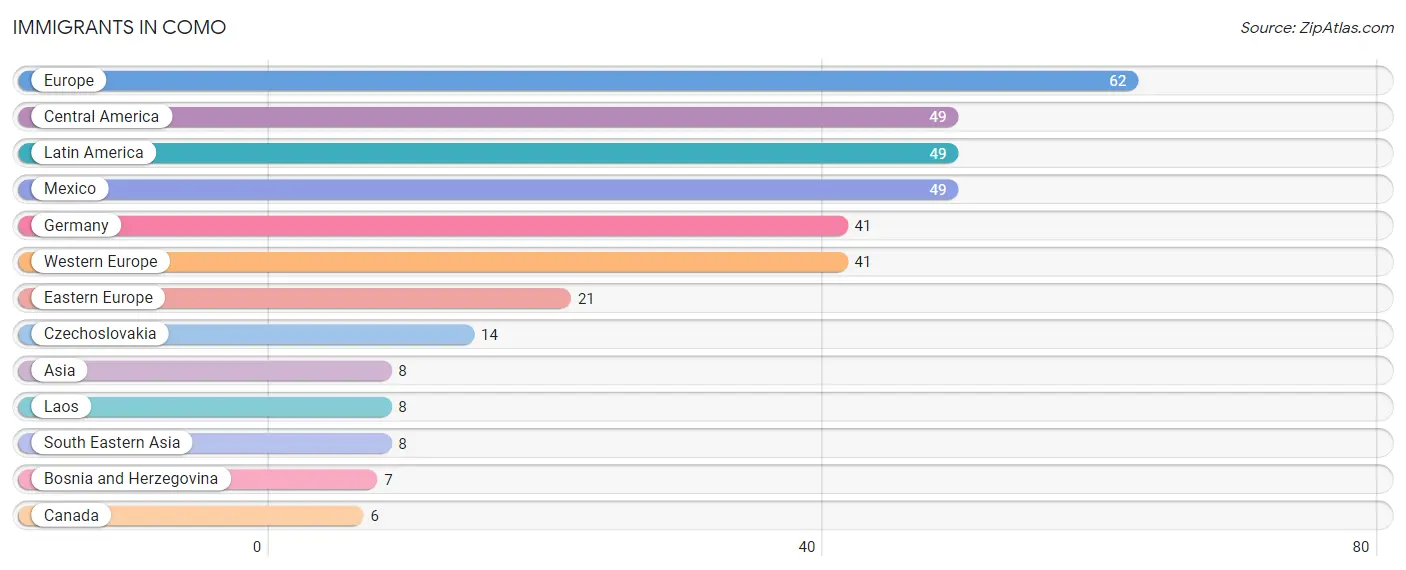
The most numerous immigrant groups reported in Como came from Europe (62 | 2.7%), Central America (49 | 2.1%), Latin America (49 | 2.1%), Mexico (49 | 2.1%), and Germany (41 | 1.8%), together accounting for 10.8% of all Como residents.
| Immigration Origin | # Population | % Population |
| Asia | 8 | 0.4% |
| Bosnia and Herzegovina | 7 | 0.3% |
| Canada | 6 | 0.3% |
| Central America | 49 | 2.1% |
| Czechoslovakia | 14 | 0.6% |
| Eastern Europe | 21 | 0.9% |
| Europe | 62 | 2.7% |
| Germany | 41 | 1.8% |
| Laos | 8 | 0.4% |
| Latin America | 49 | 2.1% |
| Mexico | 49 | 2.1% |
| South Eastern Asia | 8 | 0.4% |
| Western Europe | 41 | 1.8% | View All 13 Rows |
Sex and Age in Como
Sex and Age in Como
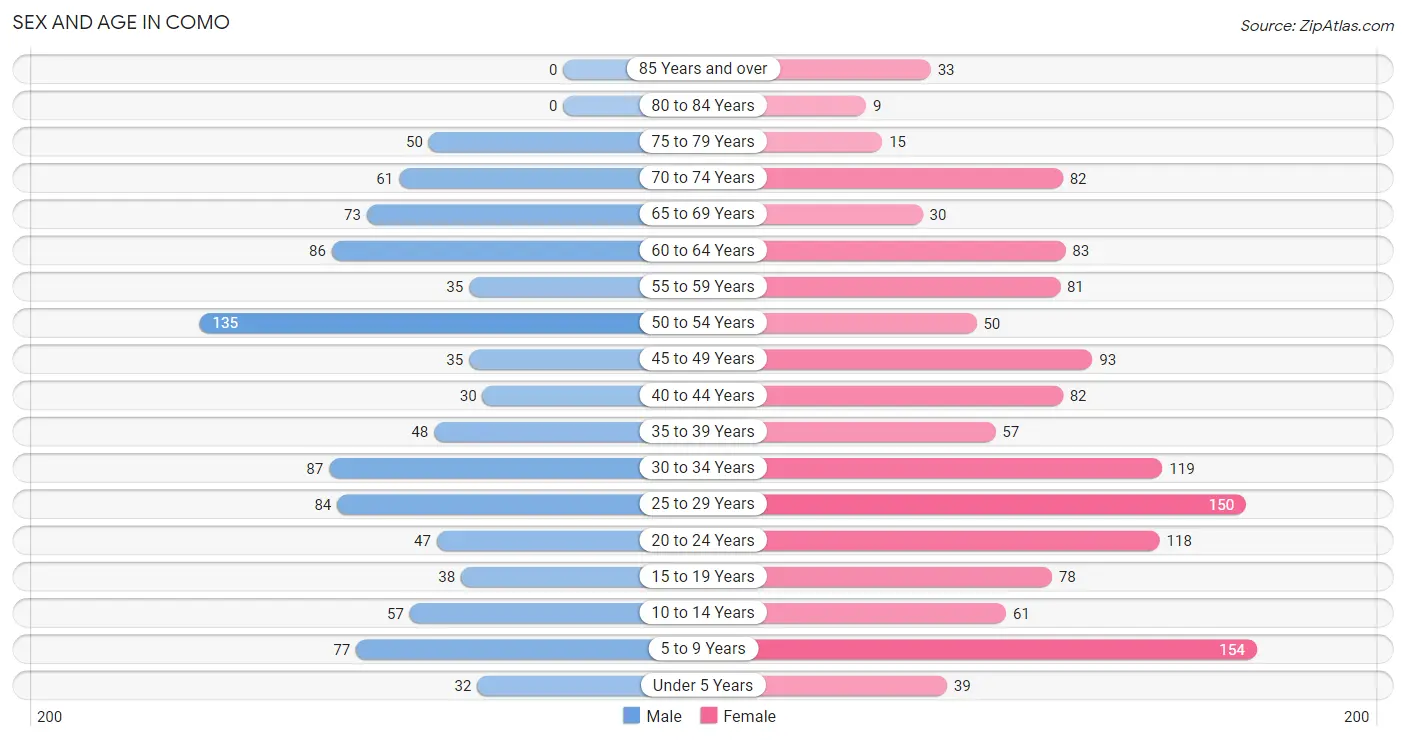
The most populous age groups in Como are 50 to 54 Years (135 | 13.9%) for men and 5 to 9 Years (154 | 11.5%) for women.
| Age Bracket | Male | Female |
| Under 5 Years | 32 (3.3%) | 39 (2.9%) |
| 5 to 9 Years | 77 (7.9%) | 154 (11.5%) |
| 10 to 14 Years | 57 (5.9%) | 61 (4.6%) |
| 15 to 19 Years | 38 (3.9%) | 78 (5.9%) |
| 20 to 24 Years | 47 (4.8%) | 118 (8.8%) |
| 25 to 29 Years | 84 (8.6%) | 150 (11.2%) |
| 30 to 34 Years | 87 (8.9%) | 119 (8.9%) |
| 35 to 39 Years | 48 (4.9%) | 57 (4.3%) |
| 40 to 44 Years | 30 (3.1%) | 82 (6.1%) |
| 45 to 49 Years | 35 (3.6%) | 93 (7.0%) |
| 50 to 54 Years | 135 (13.9%) | 50 (3.7%) |
| 55 to 59 Years | 35 (3.6%) | 81 (6.1%) |
| 60 to 64 Years | 86 (8.8%) | 83 (6.2%) |
| 65 to 69 Years | 73 (7.5%) | 30 (2.2%) |
| 70 to 74 Years | 61 (6.3%) | 82 (6.1%) |
| 75 to 79 Years | 50 (5.1%) | 15 (1.1%) |
| 80 to 84 Years | 0 (0.0%) | 9 (0.7%) |
| 85 Years and over | 0 (0.0%) | 33 (2.5%) |
| Total | 975 (100.0%) | 1,334 (100.0%) |
Families and Households in Como
Median Family Size in Como
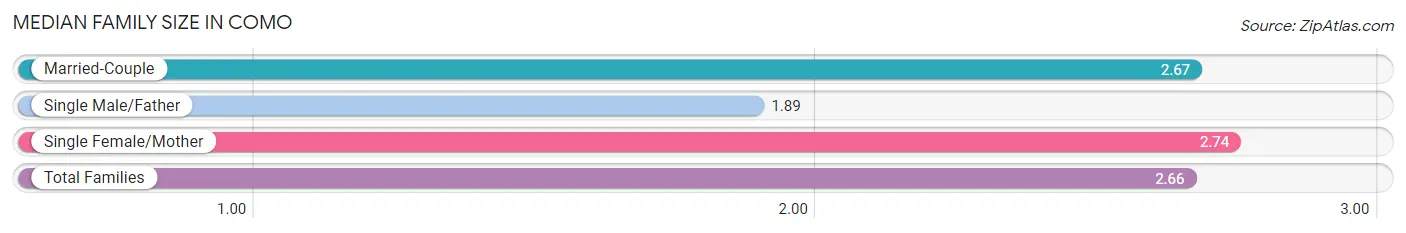
The median family size in Como is 2.66 persons per family, with single female/mother families (143 | 20.8%) accounting for the largest median family size of 2.74 persons per family. On the other hand, single male/father families (27 | 3.9%) represent the smallest median family size with 1.89 persons per family.
| Family Type | # Families | Family Size |
| Married-Couple | 516 (75.2%) | 2.67 |
| Single Male/Father | 27 (3.9%) | 1.89 |
| Single Female/Mother | 143 (20.8%) | 2.74 |
| Total Families | 686 (100.0%) | 2.66 |
Median Household Size in Como
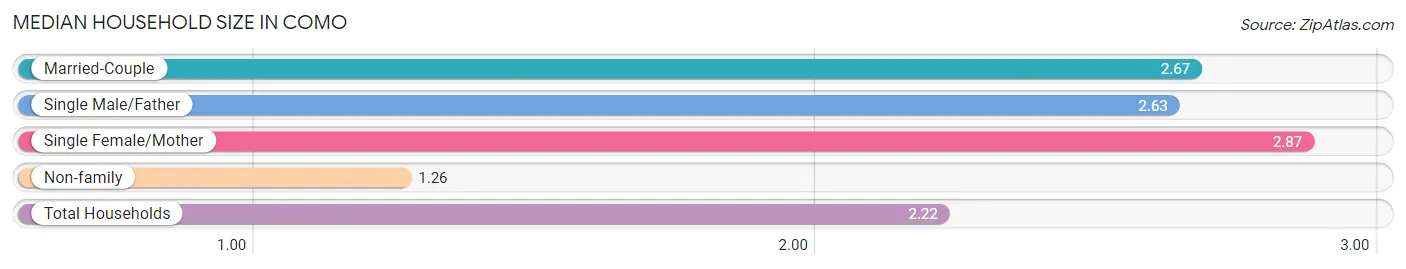
The median household size in Como is 2.22 persons per household, with single female/mother households (143 | 13.8%) accounting for the largest median household size of 2.87 persons per household. non-family households (354 | 34.0%) represent the smallest median household size with 1.26 persons per household.
| Household Type | # Households | Household Size |
| Married-Couple | 516 (49.6%) | 2.67 |
| Single Male/Father | 27 (2.6%) | 2.63 |
| Single Female/Mother | 143 (13.8%) | 2.87 |
| Non-family | 354 (34.0%) | 1.26 |
| Total Households | 1,040 (100.0%) | 2.22 |
Household Size by Marriage Status in Como
Out of a total of 1,040 households in Como, 686 (66.0%) are family households, while 354 (34.0%) are nonfamily households. The most numerous type of family households are 2-person households, comprising 295, and the most common type of nonfamily households are 1-person households, comprising 289.
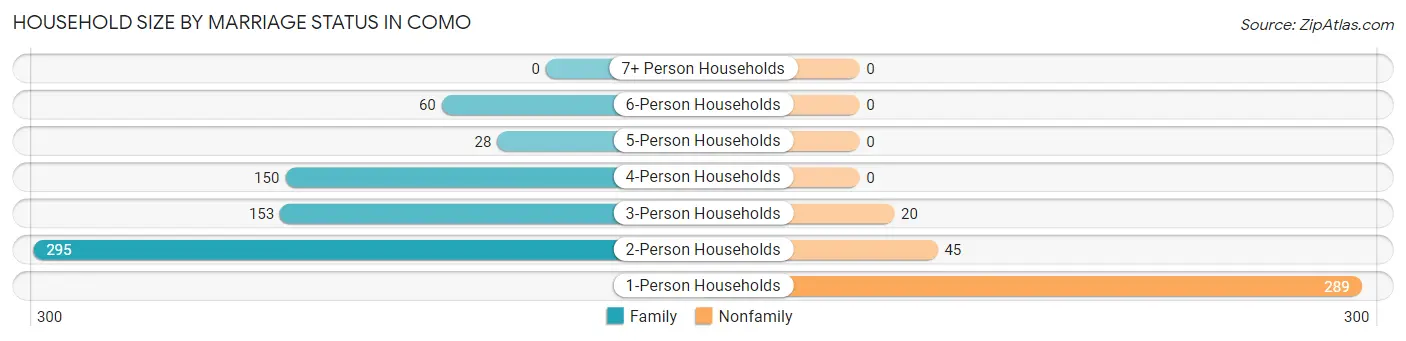
| Household Size | Family Households | Nonfamily Households |
| 1-Person Households | - | 289 (27.8%) |
| 2-Person Households | 295 (28.4%) | 45 (4.3%) |
| 3-Person Households | 153 (14.7%) | 20 (1.9%) |
| 4-Person Households | 150 (14.4%) | 0 (0.0%) |
| 5-Person Households | 28 (2.7%) | 0 (0.0%) |
| 6-Person Households | 60 (5.8%) | 0 (0.0%) |
| 7+ Person Households | 0 (0.0%) | 0 (0.0%) |
| Total | 686 (66.0%) | 354 (34.0%) |
Female Fertility in Como
Fertility by Age in Como
Average fertility rate in Como is 43.0 births per 1,000 women. Women in the age bracket of 20 to 34 years have the highest fertility rate with 62.0 births per 1,000 women. Women in the age bracket of 20 to 34 years acount for 80.0% of all women with births.
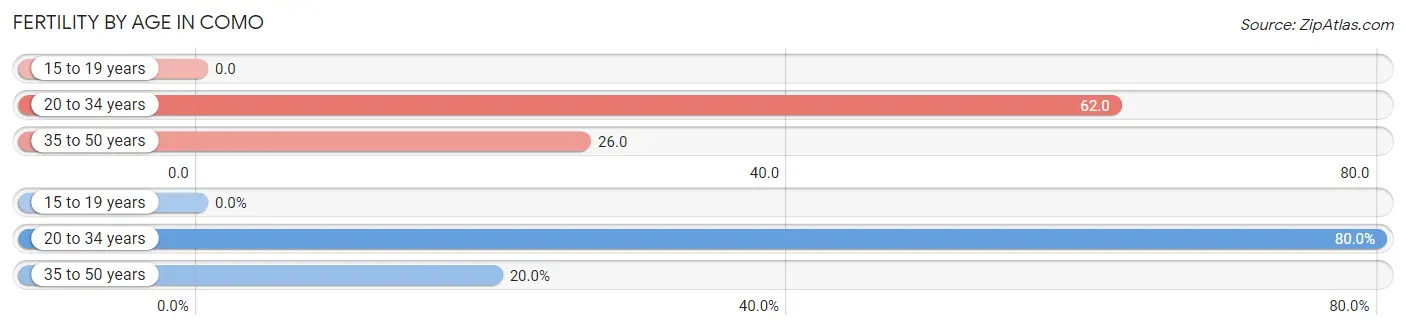
| Age Bracket | Women with Births | Births / 1,000 Women |
| 15 to 19 years | 0 (0.0%) | 0.0 |
| 20 to 34 years | 24 (80.0%) | 62.0 |
| 35 to 50 years | 6 (20.0%) | 26.0 |
| Total | 30 (100.0%) | 43.0 |
Fertility by Age by Marriage Status in Como
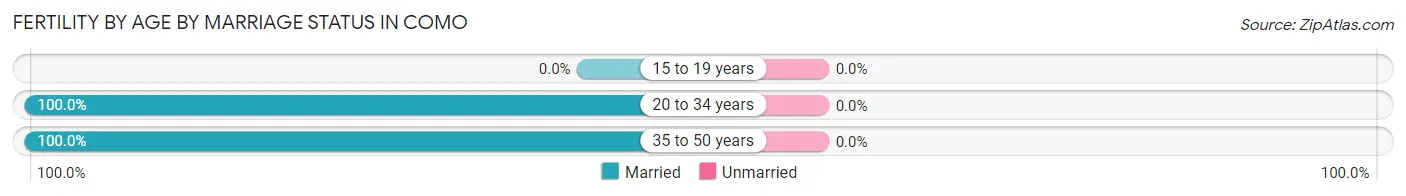
| Age Bracket | Married | Unmarried |
| 15 to 19 years | 0 (0.0%) | 0 (0.0%) |
| 20 to 34 years | 24 (100.0%) | 0 (0.0%) |
| 35 to 50 years | 6 (100.0%) | 0 (0.0%) |
| Total | 30 (100.0%) | 0 (0.0%) |
Fertility by Education in Como
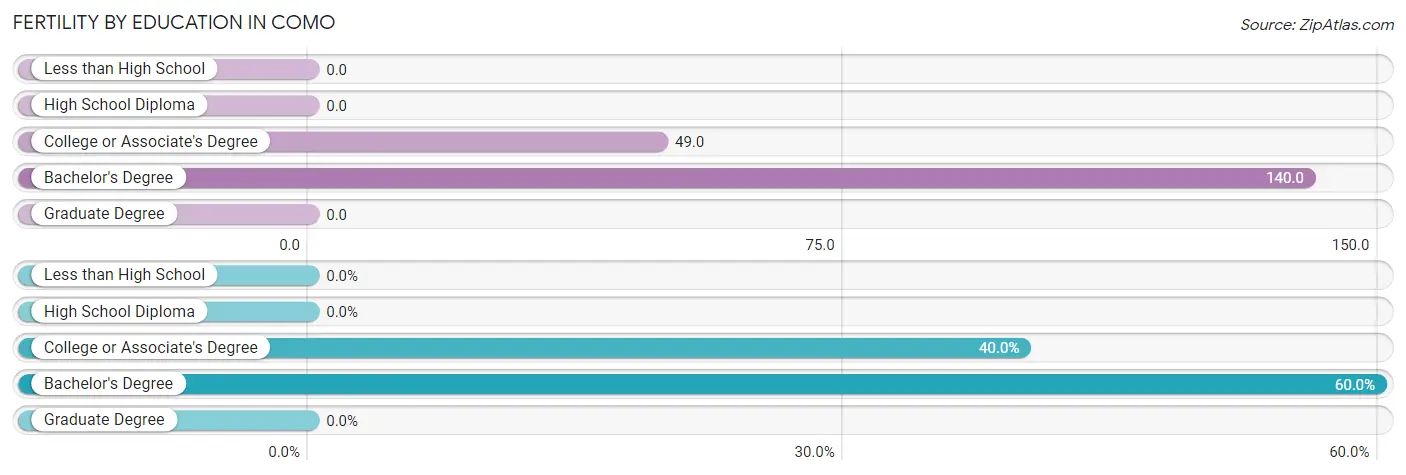
| Educational Attainment | Women with Births | Births / 1,000 Women |
| Less than High School | 0 (0.0%) | 0.0 |
| High School Diploma | 0 (0.0%) | 0.0 |
| College or Associate's Degree | 12 (40.0%) | 49.0 |
| Bachelor's Degree | 18 (60.0%) | 140.0 |
| Graduate Degree | 0 (0.0%) | 0.0 |
| Total | 30 (100.0%) | 43.0 |
Fertility by Education by Marriage Status in Como
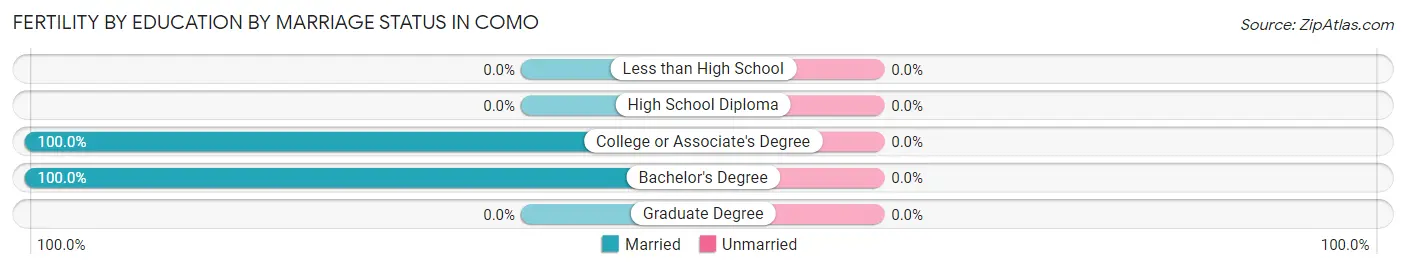
| Educational Attainment | Married | Unmarried |
| Less than High School | 0 (0.0%) | 0 (0.0%) |
| High School Diploma | 0 (0.0%) | 0 (0.0%) |
| College or Associate's Degree | 12 (100.0%) | 0 (0.0%) |
| Bachelor's Degree | 18 (100.0%) | 0 (0.0%) |
| Graduate Degree | 0 (0.0%) | 0 (0.0%) |
| Total | 30 (100.0%) | 0 (0.0%) |
Employment Characteristics in Como
Employment by Class of Employer in Como
Among the 1,291 employed individuals in Como, private company employees (929 | 72.0%), not-for-profit organizations (170 | 13.2%), and local government employees (86 | 6.7%) make up the most common classes of employment.
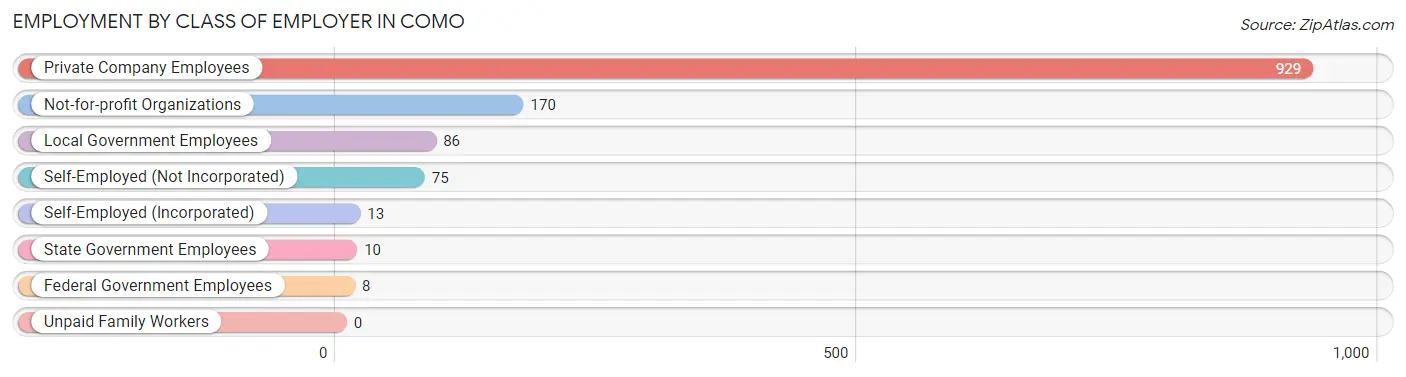
| Employer Class | # Employees | % Employees |
| Private Company Employees | 929 | 72.0% |
| Self-Employed (Incorporated) | 13 | 1.0% |
| Self-Employed (Not Incorporated) | 75 | 5.8% |
| Not-for-profit Organizations | 170 | 13.2% |
| Local Government Employees | 86 | 6.7% |
| State Government Employees | 10 | 0.8% |
| Federal Government Employees | 8 | 0.6% |
| Unpaid Family Workers | 0 | 0.0% |
| Total | 1,291 | 100.0% |
Employment Status by Age in Como
According to the labor force statistics for Como, out of the total population over 16 years of age (1,886), 70.8% or 1,335 individuals are in the labor force, with 3.4% or 45 of them unemployed. The age group with the highest labor force participation rate is 20 to 24 years, with 100.0% or 165 individuals in the labor force. Within the labor force, the 65 to 74 years age range has the highest percentage of unemployed individuals, with 22.2% or 10 of them being unemployed.
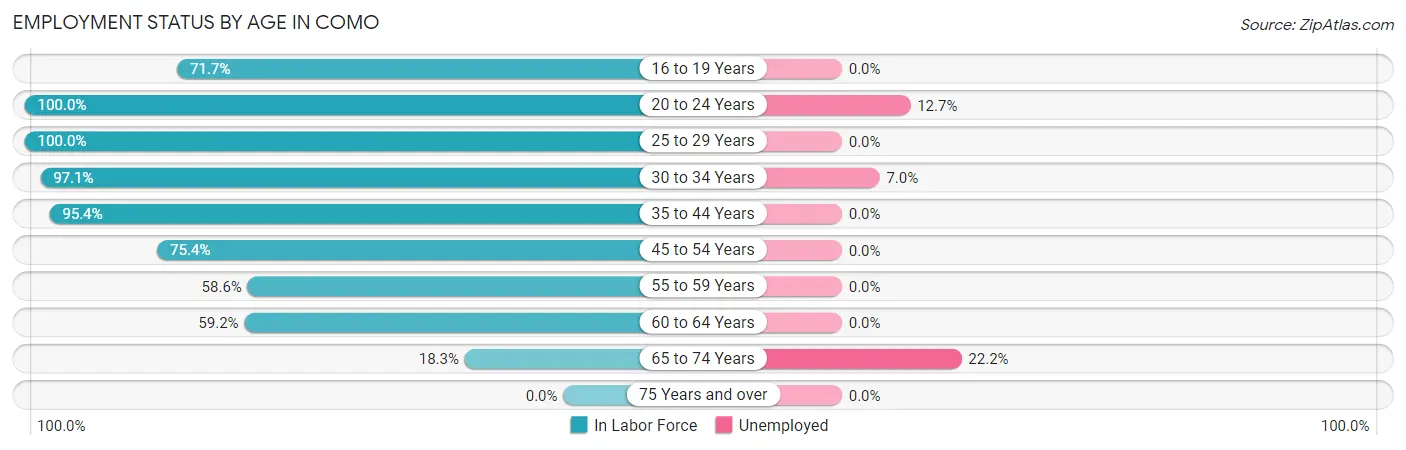
| Age Bracket | In Labor Force | Unemployed |
| 16 to 19 Years | 81 (71.7%) | 0 (0.0%) |
| 20 to 24 Years | 165 (100.0%) | 21 (12.7%) |
| 25 to 29 Years | 234 (100.0%) | 0 (0.0%) |
| 30 to 34 Years | 200 (97.1%) | 14 (7.0%) |
| 35 to 44 Years | 207 (95.4%) | 0 (0.0%) |
| 45 to 54 Years | 236 (75.4%) | 0 (0.0%) |
| 55 to 59 Years | 68 (58.6%) | 0 (0.0%) |
| 60 to 64 Years | 100 (59.2%) | 0 (0.0%) |
| 65 to 74 Years | 45 (18.3%) | 10 (22.2%) |
| 75 Years and over | 0 (0.0%) | 0 (0.0%) |
| Total | 1,335 (70.8%) | 45 (3.4%) |
Employment Status by Educational Attainment in Como
According to labor force statistics for Como, 83.3% of individuals (1,045) out of the total population between 25 and 64 years of age (1,255) are in the labor force, with 1.3% or 14 of them being unemployed. The group with the highest labor force participation rate are those with the educational attainment of bachelor's degree or higher, with 93.3% or 264 individuals in the labor force. Within the labor force, individuals with bachelor's degree or higher education have the highest percentage of unemployment, with 2.7% or 7 of them being unemployed.
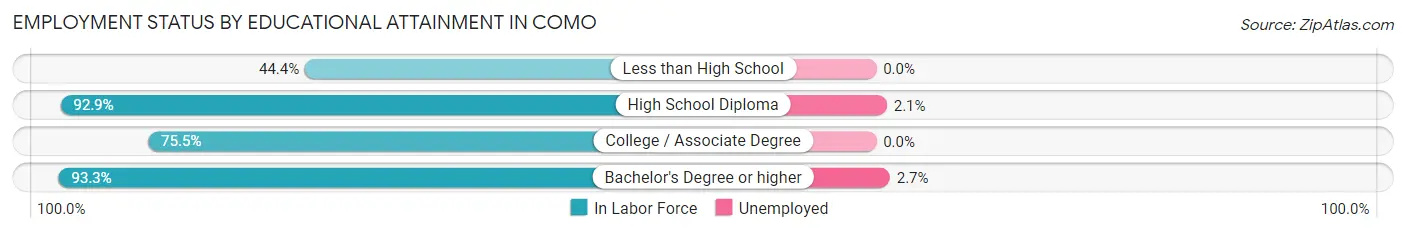
| Educational Attainment | In Labor Force | Unemployed |
| Less than High School | 20 (44.4%) | 0 (0.0%) |
| High School Diploma | 327 (92.9%) | 7 (2.1%) |
| College / Associate Degree | 434 (75.5%) | 0 (0.0%) |
| Bachelor's Degree or higher | 264 (93.3%) | 8 (2.7%) |
| Total | 1,045 (83.3%) | 16 (1.3%) |
Employment Occupations by Sex in Como
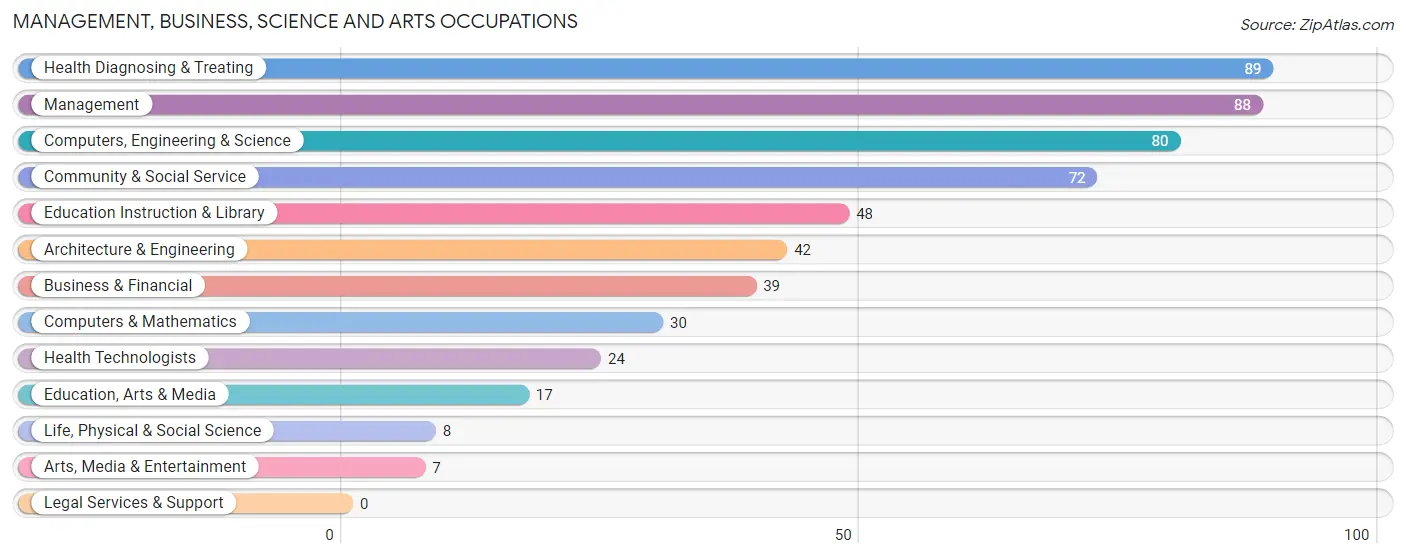
Management, Business, Science and Arts Occupations
The most common Management, Business, Science and Arts occupations in Como are Health Diagnosing & Treating (89 | 6.9%), Management (88 | 6.8%), Computers, Engineering & Science (80 | 6.2%), Community & Social Service (72 | 5.6%), and Education Instruction & Library (48 | 3.7%).
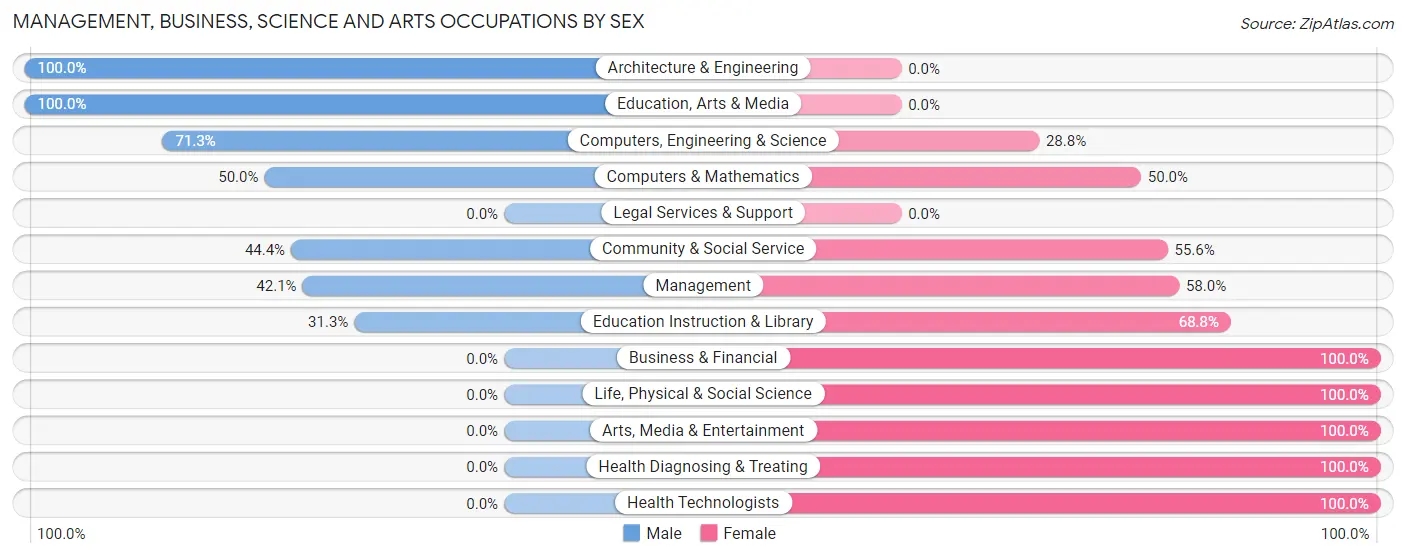
Management, Business, Science and Arts Occupations by Sex
Within the Management, Business, Science and Arts occupations in Como, the most male-oriented occupations are Architecture & Engineering (100.0%), Education, Arts & Media (100.0%), and Computers, Engineering & Science (71.3%), while the most female-oriented occupations are Business & Financial (100.0%), Life, Physical & Social Science (100.0%), and Arts, Media & Entertainment (100.0%).
| Occupation | Male | Female |
| Management | 37 (42.0%) | 51 (58.0%) |
| Business & Financial | 0 (0.0%) | 39 (100.0%) |
| Computers, Engineering & Science | 57 (71.3%) | 23 (28.7%) |
| Computers & Mathematics | 15 (50.0%) | 15 (50.0%) |
| Architecture & Engineering | 42 (100.0%) | 0 (0.0%) |
| Life, Physical & Social Science | 0 (0.0%) | 8 (100.0%) |
| Community & Social Service | 32 (44.4%) | 40 (55.6%) |
| Education, Arts & Media | 17 (100.0%) | 0 (0.0%) |
| Legal Services & Support | 0 (0.0%) | 0 (0.0%) |
| Education Instruction & Library | 15 (31.2%) | 33 (68.8%) |
| Arts, Media & Entertainment | 0 (0.0%) | 7 (100.0%) |
| Health Diagnosing & Treating | 0 (0.0%) | 89 (100.0%) |
| Health Technologists | 0 (0.0%) | 24 (100.0%) |
| Total (Category) | 126 (34.2%) | 242 (65.8%) |
| Total (Overall) | 493 (38.2%) | 798 (61.8%) |
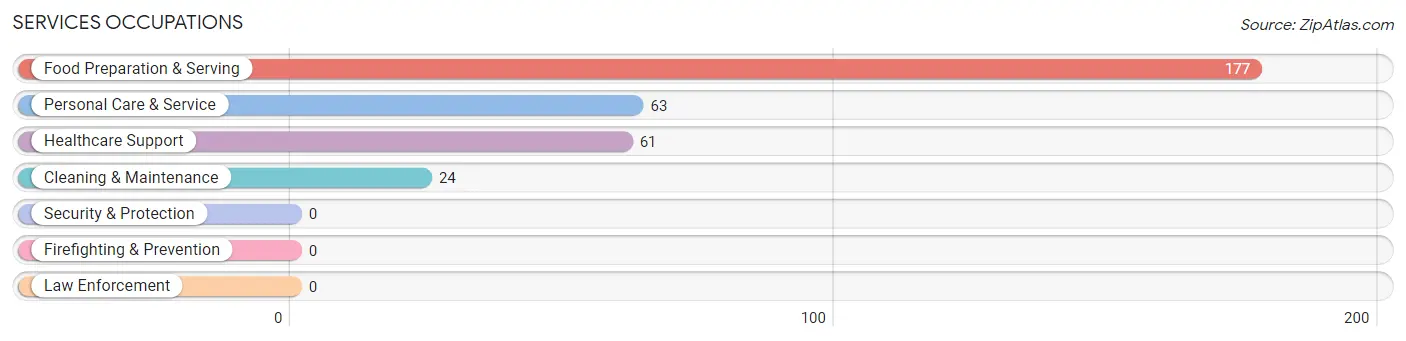
Services Occupations
The most common Services occupations in Como are Food Preparation & Serving (177 | 13.7%), Personal Care & Service (63 | 4.9%), Healthcare Support (61 | 4.7%), and Cleaning & Maintenance (24 | 1.9%).
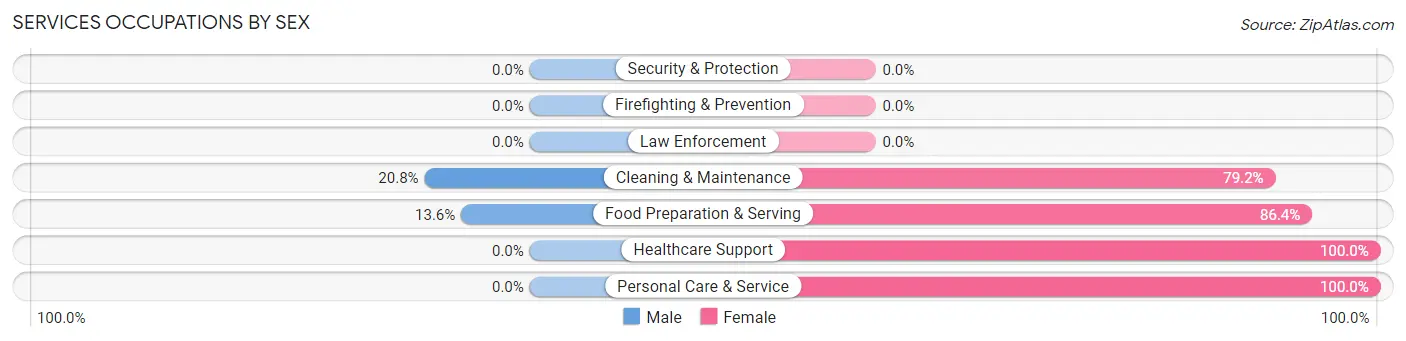
Services Occupations by Sex
Within the Services occupations in Como, the most male-oriented occupations are Cleaning & Maintenance (20.8%), and Food Preparation & Serving (13.6%), while the most female-oriented occupations are Healthcare Support (100.0%), Personal Care & Service (100.0%), and Food Preparation & Serving (86.4%).
| Occupation | Male | Female |
| Healthcare Support | 0 (0.0%) | 61 (100.0%) |
| Security & Protection | 0 (0.0%) | 0 (0.0%) |
| Firefighting & Prevention | 0 (0.0%) | 0 (0.0%) |
| Law Enforcement | 0 (0.0%) | 0 (0.0%) |
| Food Preparation & Serving | 24 (13.6%) | 153 (86.4%) |
| Cleaning & Maintenance | 5 (20.8%) | 19 (79.2%) |
| Personal Care & Service | 0 (0.0%) | 63 (100.0%) |
| Total (Category) | 29 (8.9%) | 296 (91.1%) |
| Total (Overall) | 493 (38.2%) | 798 (61.8%) |
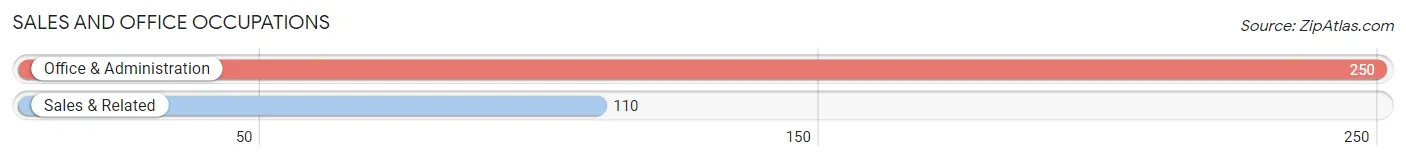
Sales and Office Occupations
The most common Sales and Office occupations in Como are Office & Administration (250 | 19.4%), and Sales & Related (110 | 8.5%).
Sales and Office Occupations by Sex
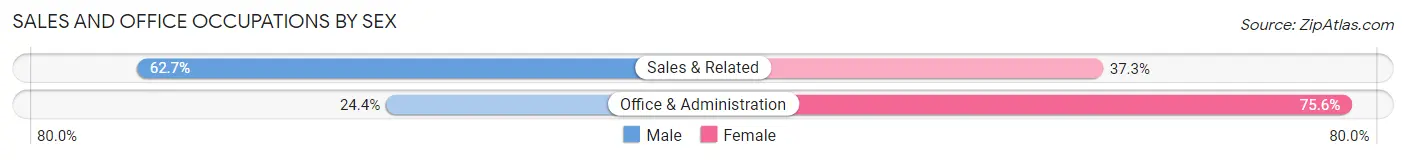
| Occupation | Male | Female |
| Sales & Related | 69 (62.7%) | 41 (37.3%) |
| Office & Administration | 61 (24.4%) | 189 (75.6%) |
| Total (Category) | 130 (36.1%) | 230 (63.9%) |
| Total (Overall) | 493 (38.2%) | 798 (61.8%) |
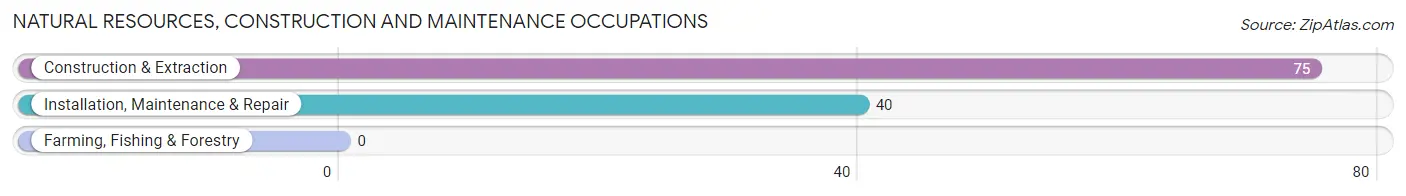
Natural Resources, Construction and Maintenance Occupations
The most common Natural Resources, Construction and Maintenance occupations in Como are Construction & Extraction (75 | 5.8%), and Installation, Maintenance & Repair (40 | 3.1%).
Natural Resources, Construction and Maintenance Occupations by Sex
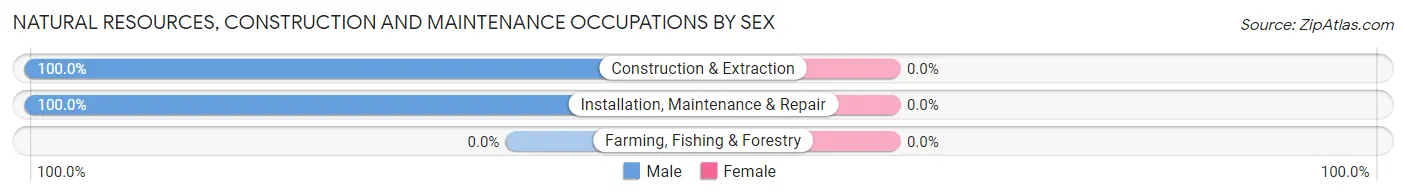
| Occupation | Male | Female |
| Farming, Fishing & Forestry | 0 (0.0%) | 0 (0.0%) |
| Construction & Extraction | 75 (100.0%) | 0 (0.0%) |
| Installation, Maintenance & Repair | 40 (100.0%) | 0 (0.0%) |
| Total (Category) | 115 (100.0%) | 0 (0.0%) |
| Total (Overall) | 493 (38.2%) | 798 (61.8%) |
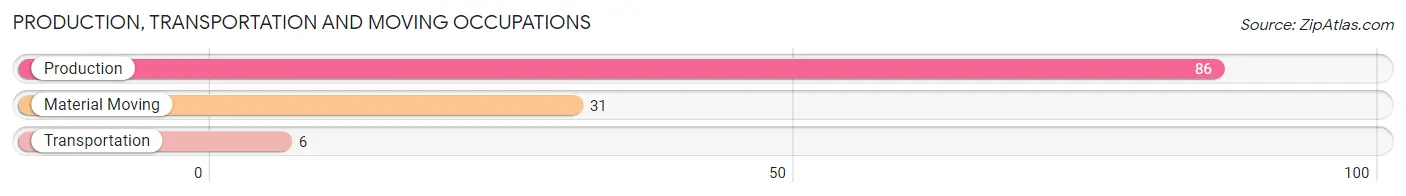
Production, Transportation and Moving Occupations
The most common Production, Transportation and Moving occupations in Como are Production (86 | 6.7%), Material Moving (31 | 2.4%), and Transportation (6 | 0.5%).
Production, Transportation and Moving Occupations by Sex
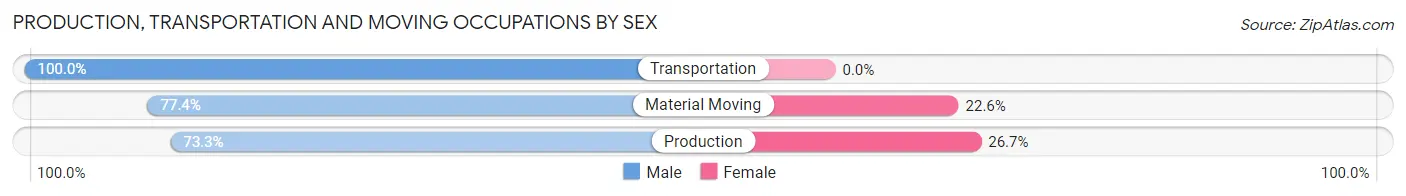
| Occupation | Male | Female |
| Production | 63 (73.3%) | 23 (26.7%) |
| Transportation | 6 (100.0%) | 0 (0.0%) |
| Material Moving | 24 (77.4%) | 7 (22.6%) |
| Total (Category) | 93 (75.6%) | 30 (24.4%) |
| Total (Overall) | 493 (38.2%) | 798 (61.8%) |
Employment Industries by Sex in Como
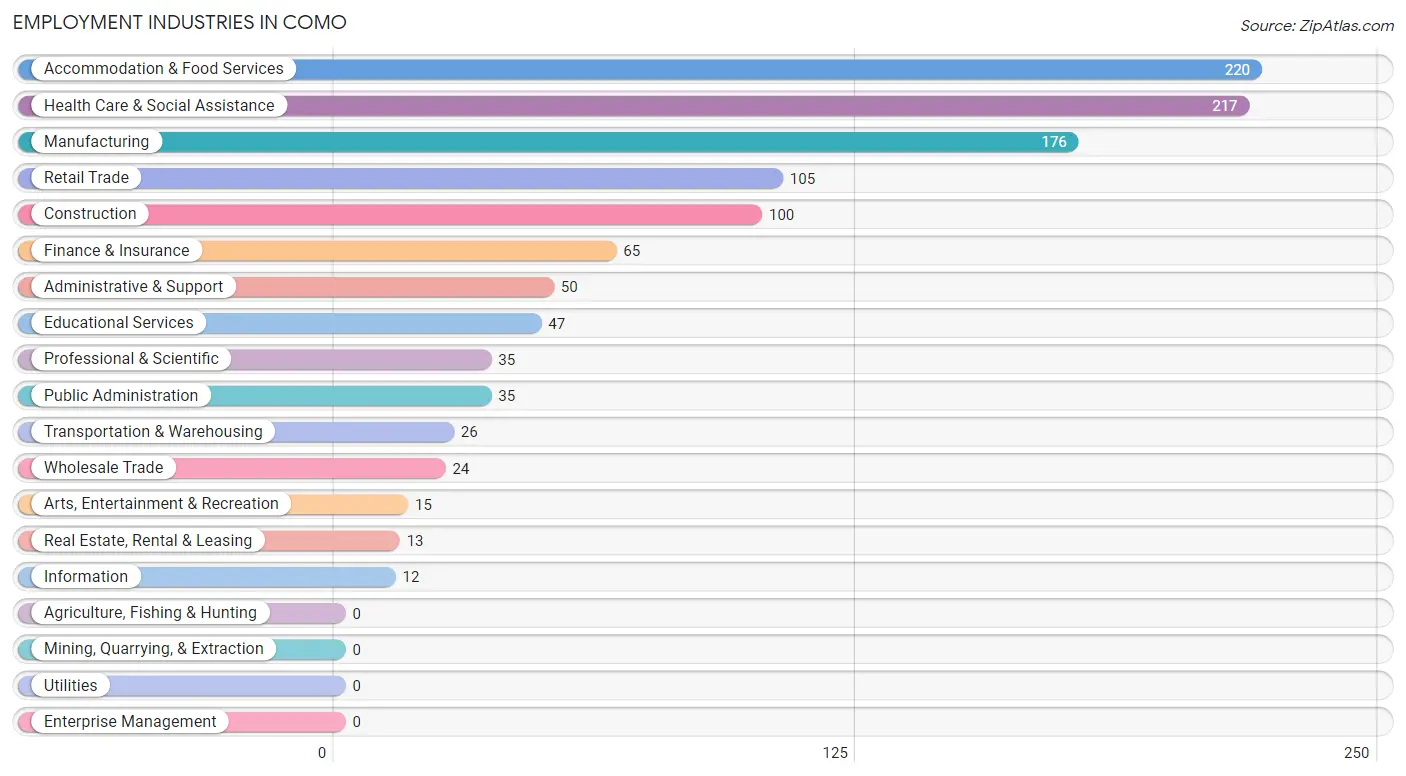
Employment Industries in Como
The major employment industries in Como include Accommodation & Food Services (220 | 17.0%), Health Care & Social Assistance (217 | 16.8%), Manufacturing (176 | 13.6%), Retail Trade (105 | 8.1%), and Construction (100 | 7.7%).
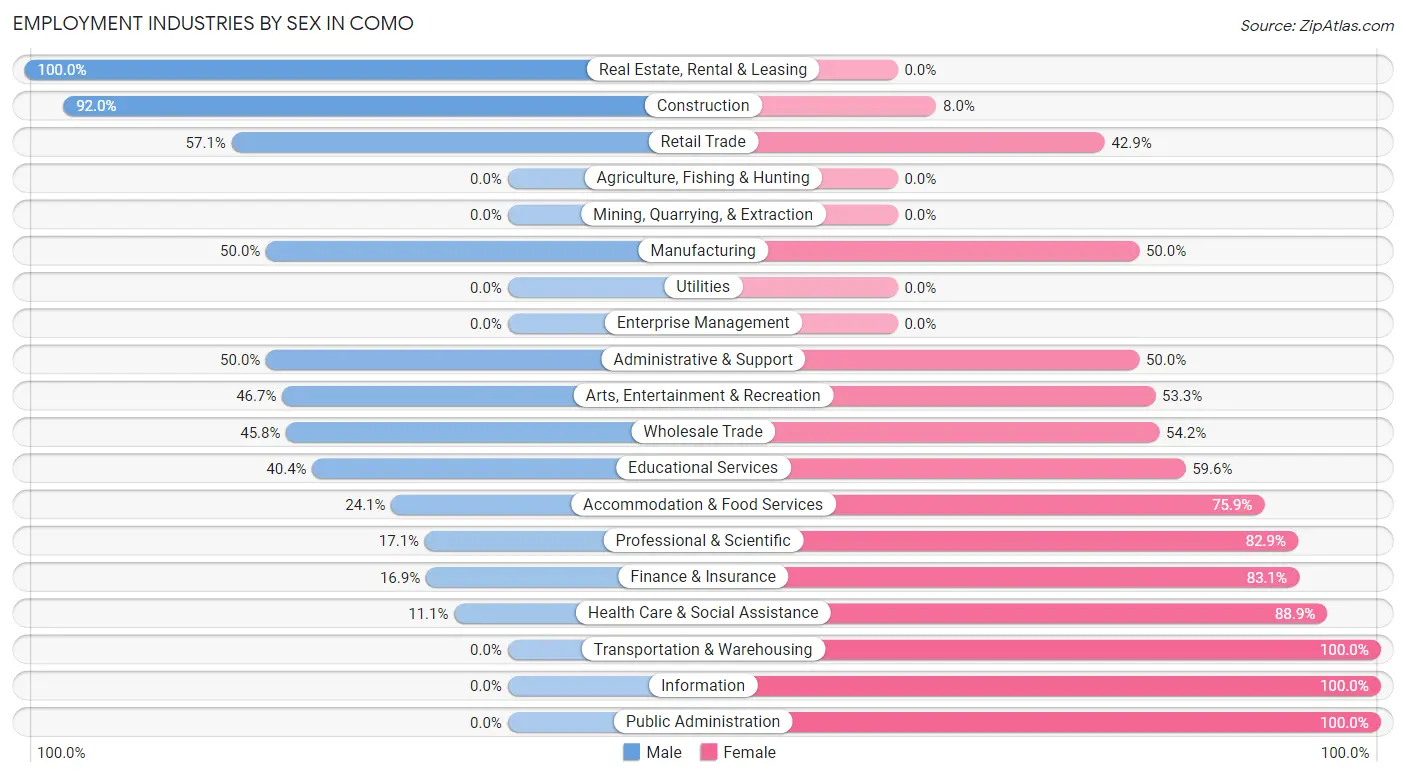
Employment Industries by Sex in Como
The Como industries that see more men than women are Real Estate, Rental & Leasing (100.0%), Construction (92.0%), and Retail Trade (57.1%), whereas the industries that tend to have a higher number of women are Transportation & Warehousing (100.0%), Information (100.0%), and Public Administration (100.0%).
| Industry | Male | Female |
| Agriculture, Fishing & Hunting | 0 (0.0%) | 0 (0.0%) |
| Mining, Quarrying, & Extraction | 0 (0.0%) | 0 (0.0%) |
| Construction | 92 (92.0%) | 8 (8.0%) |
| Manufacturing | 88 (50.0%) | 88 (50.0%) |
| Wholesale Trade | 11 (45.8%) | 13 (54.2%) |
| Retail Trade | 60 (57.1%) | 45 (42.9%) |
| Transportation & Warehousing | 0 (0.0%) | 26 (100.0%) |
| Utilities | 0 (0.0%) | 0 (0.0%) |
| Information | 0 (0.0%) | 12 (100.0%) |
| Finance & Insurance | 11 (16.9%) | 54 (83.1%) |
| Real Estate, Rental & Leasing | 13 (100.0%) | 0 (0.0%) |
| Professional & Scientific | 6 (17.1%) | 29 (82.9%) |
| Enterprise Management | 0 (0.0%) | 0 (0.0%) |
| Administrative & Support | 25 (50.0%) | 25 (50.0%) |
| Educational Services | 19 (40.4%) | 28 (59.6%) |
| Health Care & Social Assistance | 24 (11.1%) | 193 (88.9%) |
| Arts, Entertainment & Recreation | 7 (46.7%) | 8 (53.3%) |
| Accommodation & Food Services | 53 (24.1%) | 167 (75.9%) |
| Public Administration | 0 (0.0%) | 35 (100.0%) |
| Total | 493 (38.2%) | 798 (61.8%) |
Education in Como
School Enrollment in Como
The most common levels of schooling among the 690 students in Como are college / undergraduate (185 | 26.8%), elementary school (180 | 26.1%), and middle school (106 | 15.4%).
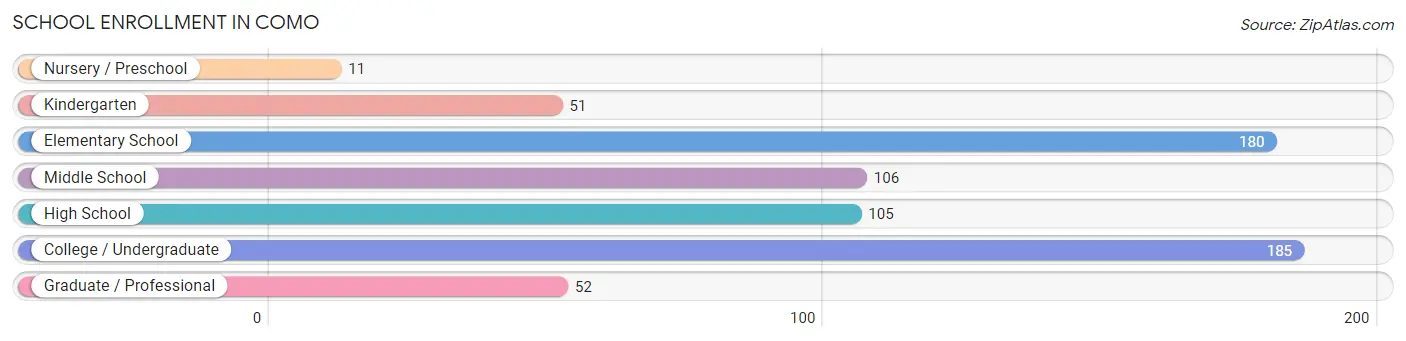
| School Level | # Students | % Students |
| Nursery / Preschool | 11 | 1.6% |
| Kindergarten | 51 | 7.4% |
| Elementary School | 180 | 26.1% |
| Middle School | 106 | 15.4% |
| High School | 105 | 15.2% |
| College / Undergraduate | 185 | 26.8% |
| Graduate / Professional | 52 | 7.5% |
| Total | 690 | 100.0% |
School Enrollment by Age by Funding Source in Como
Out of a total of 690 students who are enrolled in schools in Como, 47 (6.8%) attend a private institution, while the remaining 643 (93.2%) are enrolled in public schools. The age group of 20 to 24 year olds has the highest likelihood of being enrolled in private schools, with 34 (30.9% in the age bracket) enrolled. Conversely, the age group of 3 to 4 year olds has the lowest likelihood of being enrolled in a private school, with 11 (100.0% in the age bracket) attending a public institution.
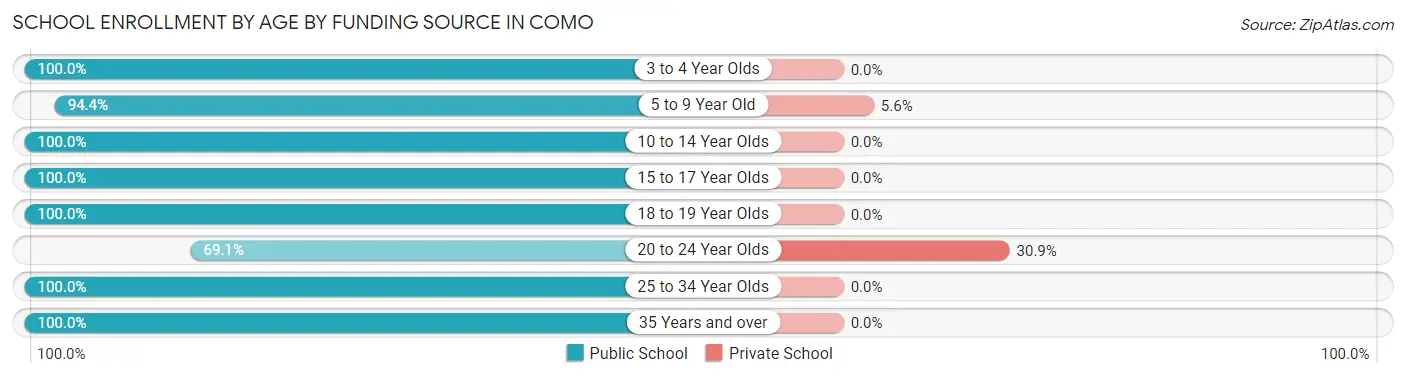
| Age Bracket | Public School | Private School |
| 3 to 4 Year Olds | 11 (100.0%) | 0 (0.0%) |
| 5 to 9 Year Old | 218 (94.4%) | 13 (5.6%) |
| 10 to 14 Year Olds | 118 (100.0%) | 0 (0.0%) |
| 15 to 17 Year Olds | 70 (100.0%) | 0 (0.0%) |
| 18 to 19 Year Olds | 42 (100.0%) | 0 (0.0%) |
| 20 to 24 Year Olds | 76 (69.1%) | 34 (30.9%) |
| 25 to 34 Year Olds | 61 (100.0%) | 0 (0.0%) |
| 35 Years and over | 47 (100.0%) | 0 (0.0%) |
| Total | 643 (93.2%) | 47 (6.8%) |
Educational Attainment by Field of Study in Como
Education (104 | 28.2%), business (88 | 23.8%), arts & humanities (36 | 9.8%), liberal arts & history (34 | 9.2%), and social sciences (30 | 8.1%) are the most common fields of study among 369 individuals in Como who have obtained a bachelor's degree or higher.
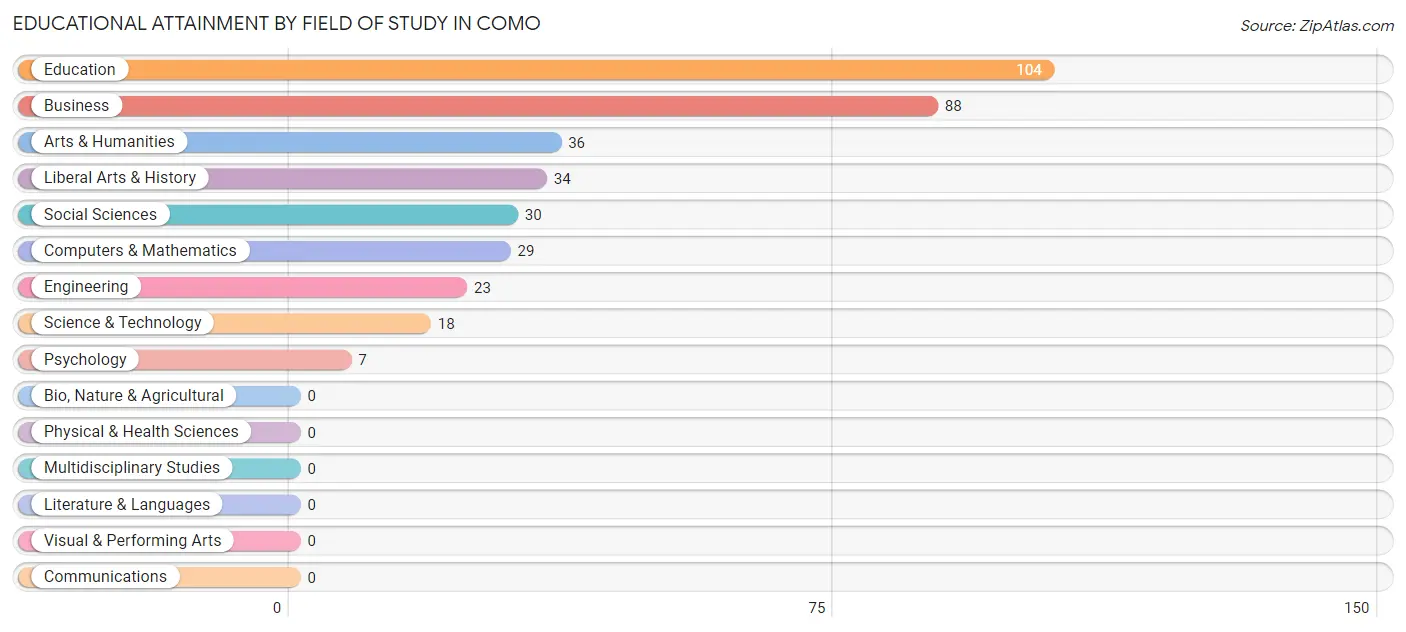
| Field of Study | # Graduates | % Graduates |
| Computers & Mathematics | 29 | 7.9% |
| Bio, Nature & Agricultural | 0 | 0.0% |
| Physical & Health Sciences | 0 | 0.0% |
| Psychology | 7 | 1.9% |
| Social Sciences | 30 | 8.1% |
| Engineering | 23 | 6.2% |
| Multidisciplinary Studies | 0 | 0.0% |
| Science & Technology | 18 | 4.9% |
| Business | 88 | 23.8% |
| Education | 104 | 28.2% |
| Literature & Languages | 0 | 0.0% |
| Liberal Arts & History | 34 | 9.2% |
| Visual & Performing Arts | 0 | 0.0% |
| Communications | 0 | 0.0% |
| Arts & Humanities | 36 | 9.8% |
| Total | 369 | 100.0% |
Transportation & Commute in Como
Vehicle Availability by Sex in Como
The most prevalent vehicle ownership categories in Como are males with 3 vehicles (185, accounting for 37.5%) and females with 3 vehicles (216, making up 23.2%).
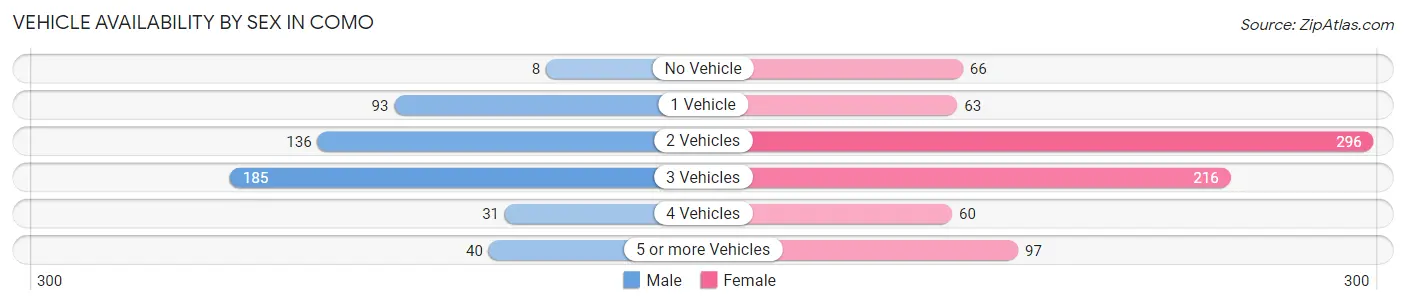
| Vehicles Available | Male | Female |
| No Vehicle | 8 (1.6%) | 66 (8.3%) |
| 1 Vehicle | 93 (18.9%) | 63 (7.9%) |
| 2 Vehicles | 136 (27.6%) | 296 (37.1%) |
| 3 Vehicles | 185 (37.5%) | 216 (27.1%) |
| 4 Vehicles | 31 (6.3%) | 60 (7.5%) |
| 5 or more Vehicles | 40 (8.1%) | 97 (12.2%) |
| Total | 493 (100.0%) | 798 (100.0%) |
Commute Time in Como
The most frequently occuring commute durations in Como are 10 to 14 minutes (379 commuters, 30.8%), 15 to 19 minutes (252 commuters, 20.5%), and 45 to 59 minutes (158 commuters, 12.9%).
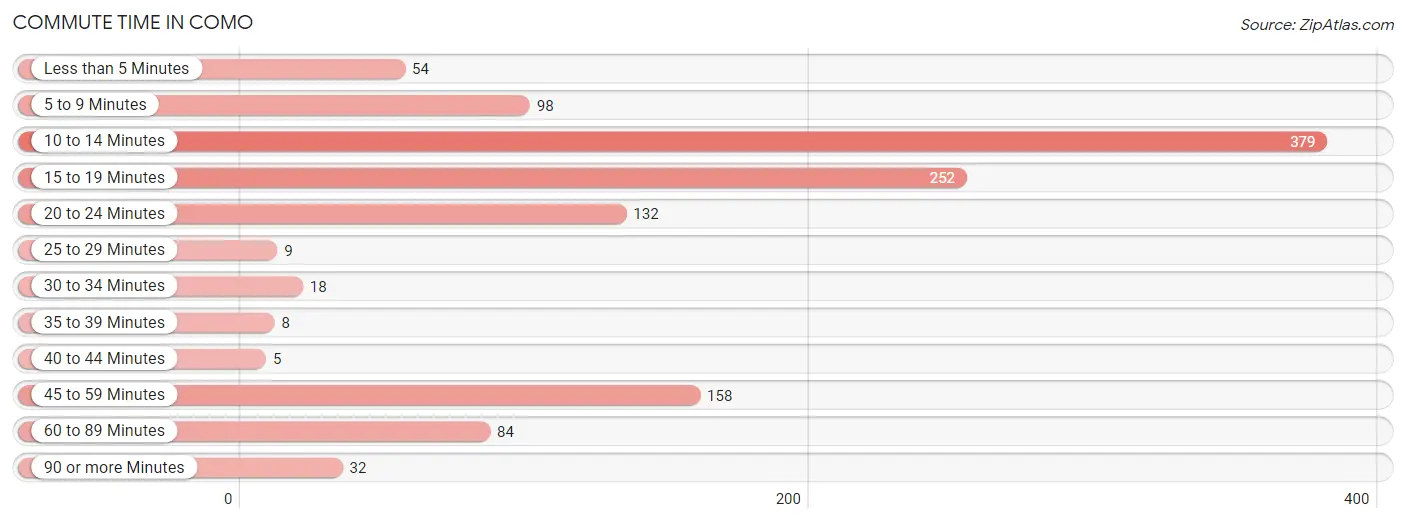
| Commute Time | # Commuters | % Commuters |
| Less than 5 Minutes | 54 | 4.4% |
| 5 to 9 Minutes | 98 | 8.0% |
| 10 to 14 Minutes | 379 | 30.8% |
| 15 to 19 Minutes | 252 | 20.5% |
| 20 to 24 Minutes | 132 | 10.7% |
| 25 to 29 Minutes | 9 | 0.7% |
| 30 to 34 Minutes | 18 | 1.5% |
| 35 to 39 Minutes | 8 | 0.6% |
| 40 to 44 Minutes | 5 | 0.4% |
| 45 to 59 Minutes | 158 | 12.9% |
| 60 to 89 Minutes | 84 | 6.8% |
| 90 or more Minutes | 32 | 2.6% |
Commute Time by Sex in Como
The most common commute times in Como are 15 to 19 minutes (188 commuters, 39.3%) for males and 10 to 14 minutes (282 commuters, 37.6%) for females.
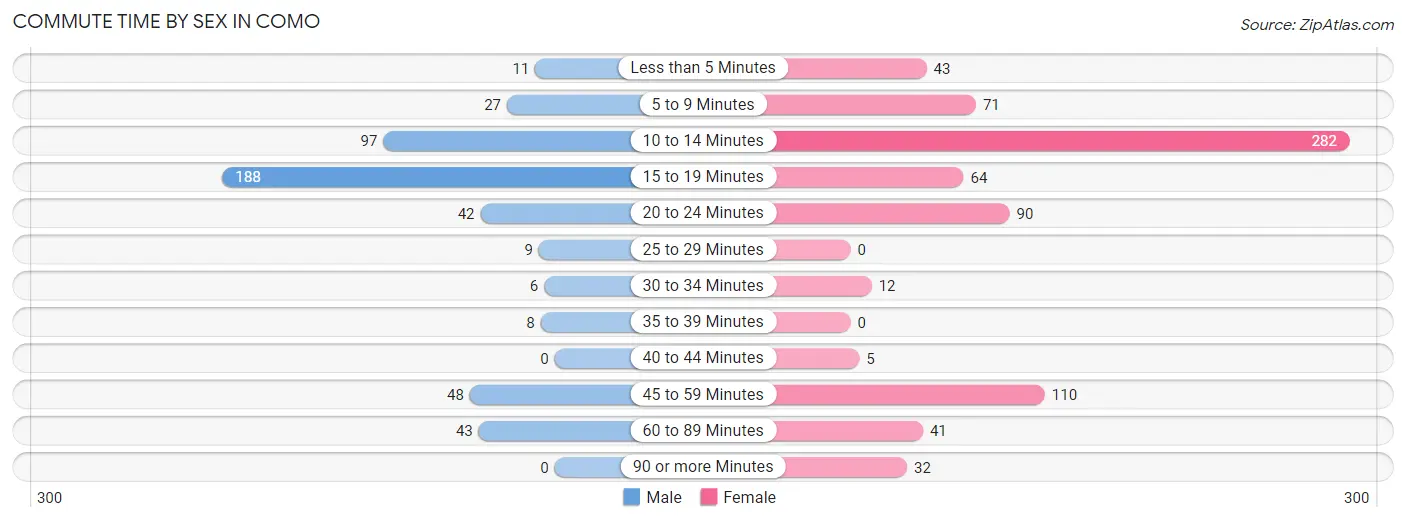
| Commute Time | Male | Female |
| Less than 5 Minutes | 11 (2.3%) | 43 (5.7%) |
| 5 to 9 Minutes | 27 (5.6%) | 71 (9.5%) |
| 10 to 14 Minutes | 97 (20.3%) | 282 (37.6%) |
| 15 to 19 Minutes | 188 (39.3%) | 64 (8.5%) |
| 20 to 24 Minutes | 42 (8.8%) | 90 (12.0%) |
| 25 to 29 Minutes | 9 (1.9%) | 0 (0.0%) |
| 30 to 34 Minutes | 6 (1.3%) | 12 (1.6%) |
| 35 to 39 Minutes | 8 (1.7%) | 0 (0.0%) |
| 40 to 44 Minutes | 0 (0.0%) | 5 (0.7%) |
| 45 to 59 Minutes | 48 (10.0%) | 110 (14.7%) |
| 60 to 89 Minutes | 43 (9.0%) | 41 (5.5%) |
| 90 or more Minutes | 0 (0.0%) | 32 (4.3%) |
Time of Departure to Work by Sex in Como
The most frequent times of departure to work in Como are 7:00 AM to 7:29 AM (129, 26.9%) for males and 12:00 PM to 3:59 PM (155, 20.7%) for females.
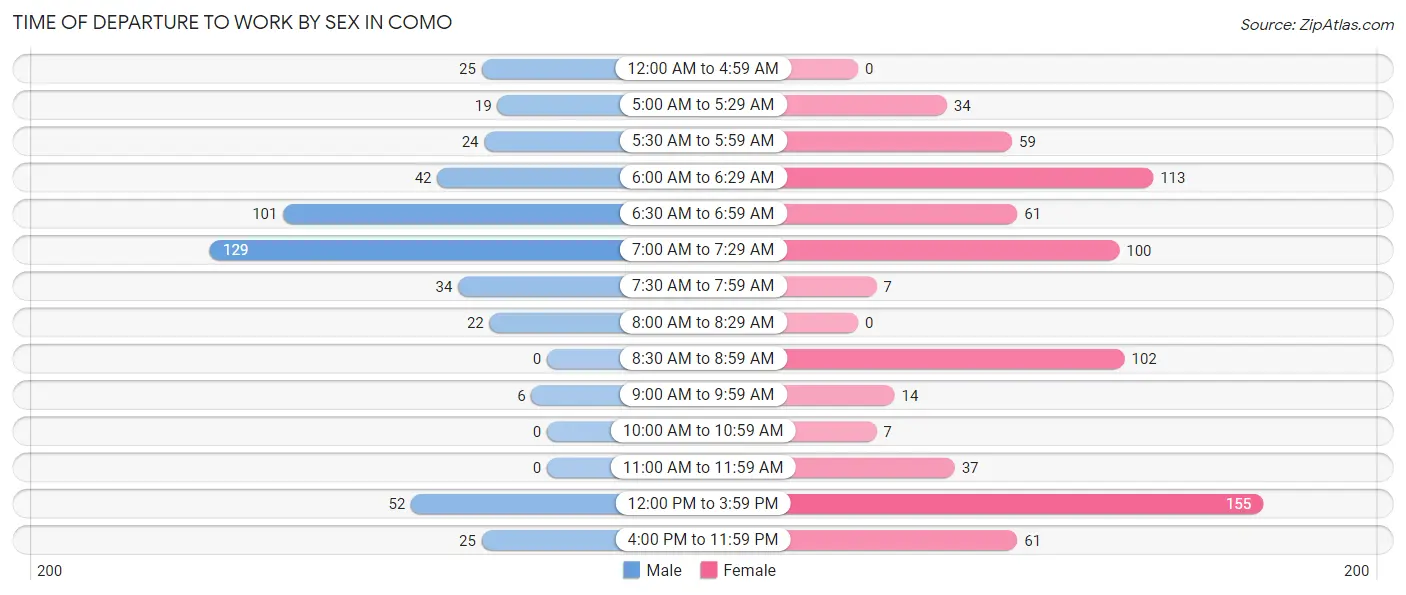
| Time of Departure | Male | Female |
| 12:00 AM to 4:59 AM | 25 (5.2%) | 0 (0.0%) |
| 5:00 AM to 5:29 AM | 19 (4.0%) | 34 (4.5%) |
| 5:30 AM to 5:59 AM | 24 (5.0%) | 59 (7.9%) |
| 6:00 AM to 6:29 AM | 42 (8.8%) | 113 (15.1%) |
| 6:30 AM to 6:59 AM | 101 (21.1%) | 61 (8.1%) |
| 7:00 AM to 7:29 AM | 129 (26.9%) | 100 (13.3%) |
| 7:30 AM to 7:59 AM | 34 (7.1%) | 7 (0.9%) |
| 8:00 AM to 8:29 AM | 22 (4.6%) | 0 (0.0%) |
| 8:30 AM to 8:59 AM | 0 (0.0%) | 102 (13.6%) |
| 9:00 AM to 9:59 AM | 6 (1.3%) | 14 (1.9%) |
| 10:00 AM to 10:59 AM | 0 (0.0%) | 7 (0.9%) |
| 11:00 AM to 11:59 AM | 0 (0.0%) | 37 (4.9%) |
| 12:00 PM to 3:59 PM | 52 (10.9%) | 155 (20.7%) |
| 4:00 PM to 11:59 PM | 25 (5.2%) | 61 (8.1%) |
| Total | 479 (100.0%) | 750 (100.0%) |
Housing Occupancy in Como
Occupancy by Ownership in Como
Of the total 1,040 dwellings in Como, owner-occupied units account for 755 (72.6%), while renter-occupied units make up 285 (27.4%).
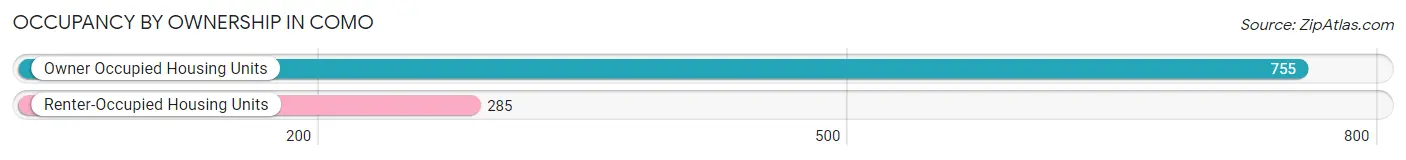
| Occupancy | # Housing Units | % Housing Units |
| Owner Occupied Housing Units | 755 | 72.6% |
| Renter-Occupied Housing Units | 285 | 27.4% |
| Total Occupied Housing Units | 1,040 | 100.0% |
Occupancy by Household Size in Como
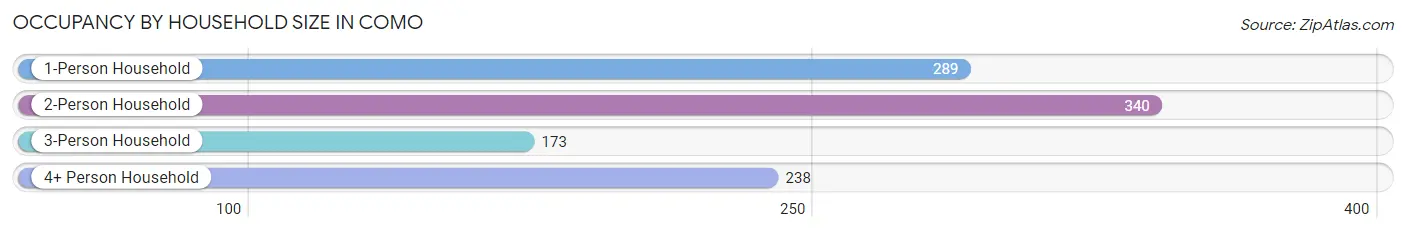
| Household Size | # Housing Units | % Housing Units |
| 1-Person Household | 289 | 27.8% |
| 2-Person Household | 340 | 32.7% |
| 3-Person Household | 173 | 16.6% |
| 4+ Person Household | 238 | 22.9% |
| Total Housing Units | 1,040 | 100.0% |
Occupancy by Ownership by Household Size in Como
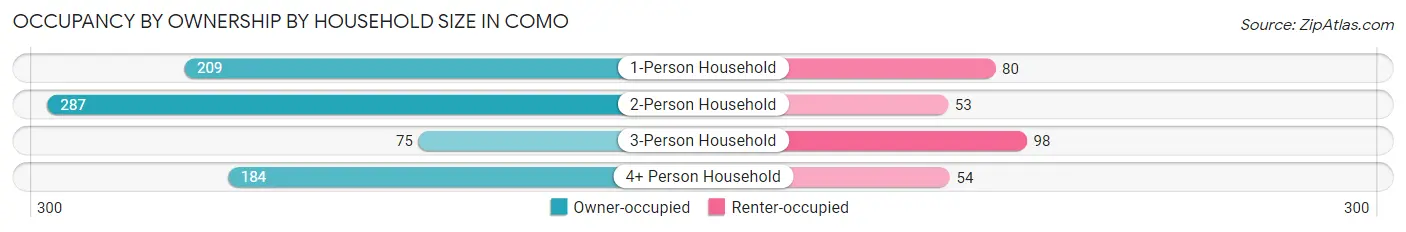
| Household Size | Owner-occupied | Renter-occupied |
| 1-Person Household | 209 (72.3%) | 80 (27.7%) |
| 2-Person Household | 287 (84.4%) | 53 (15.6%) |
| 3-Person Household | 75 (43.3%) | 98 (56.7%) |
| 4+ Person Household | 184 (77.3%) | 54 (22.7%) |
| Total Housing Units | 755 (72.6%) | 285 (27.4%) |
Occupancy by Educational Attainment in Como
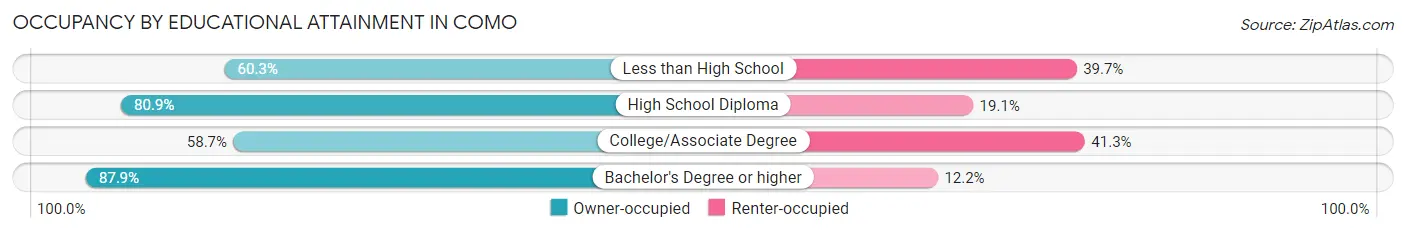
| Household Size | Owner-occupied | Renter-occupied |
| Less than High School | 35 (60.3%) | 23 (39.7%) |
| High School Diploma | 296 (80.9%) | 70 (19.1%) |
| College/Associate Degree | 236 (58.7%) | 166 (41.3%) |
| Bachelor's Degree or higher | 188 (87.8%) | 26 (12.1%) |
Occupancy by Age of Householder in Como
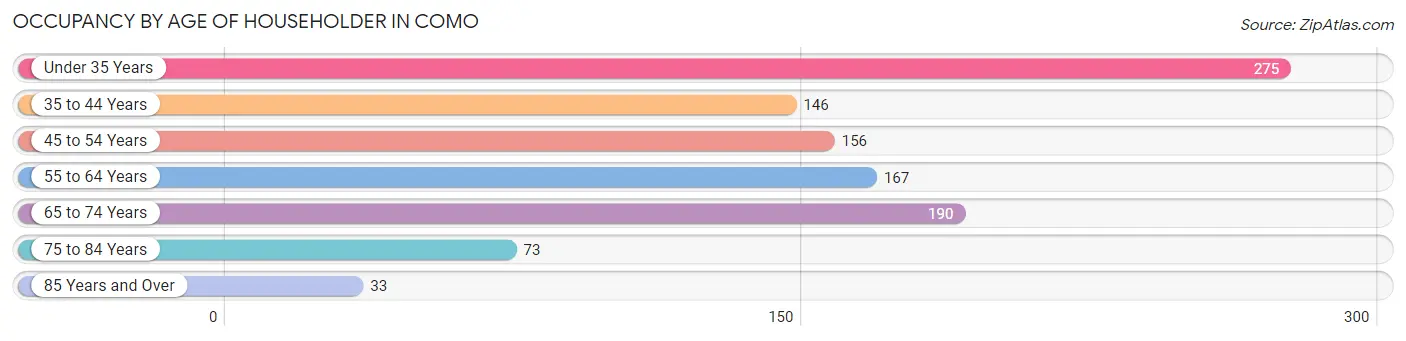
| Age Bracket | # Households | % Households |
| Under 35 Years | 275 | 26.4% |
| 35 to 44 Years | 146 | 14.0% |
| 45 to 54 Years | 156 | 15.0% |
| 55 to 64 Years | 167 | 16.1% |
| 65 to 74 Years | 190 | 18.3% |
| 75 to 84 Years | 73 | 7.0% |
| 85 Years and Over | 33 | 3.2% |
| Total | 1,040 | 100.0% |
Housing Finances in Como
Median Income by Occupancy in Como
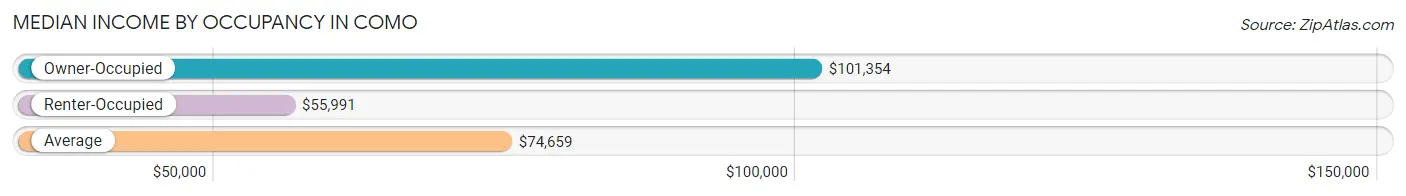
| Occupancy Type | # Households | Median Income |
| Owner-Occupied | 755 (72.6%) | $101,354 |
| Renter-Occupied | 285 (27.4%) | $55,991 |
| Average | 1,040 (100.0%) | $74,659 |
Occupancy by Householder Income Bracket in Como
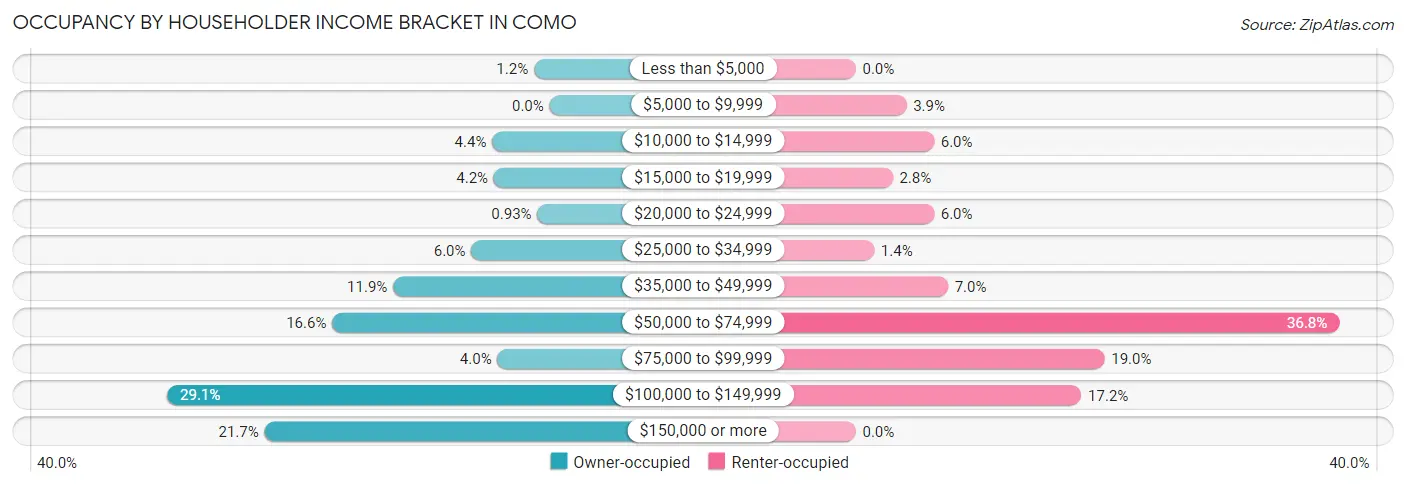
| Income Bracket | Owner-occupied | Renter-occupied |
| Less than $5,000 | 9 (1.2%) | 0 (0.0%) |
| $5,000 to $9,999 | 0 (0.0%) | 11 (3.9%) |
| $10,000 to $14,999 | 33 (4.4%) | 17 (6.0%) |
| $15,000 to $19,999 | 32 (4.2%) | 8 (2.8%) |
| $20,000 to $24,999 | 7 (0.9%) | 17 (6.0%) |
| $25,000 to $34,999 | 45 (6.0%) | 4 (1.4%) |
| $35,000 to $49,999 | 90 (11.9%) | 20 (7.0%) |
| $50,000 to $74,999 | 125 (16.6%) | 105 (36.8%) |
| $75,000 to $99,999 | 30 (4.0%) | 54 (19.0%) |
| $100,000 to $149,999 | 220 (29.1%) | 49 (17.2%) |
| $150,000 or more | 164 (21.7%) | 0 (0.0%) |
| Total | 755 (100.0%) | 285 (100.0%) |
Monthly Housing Cost Tiers in Como
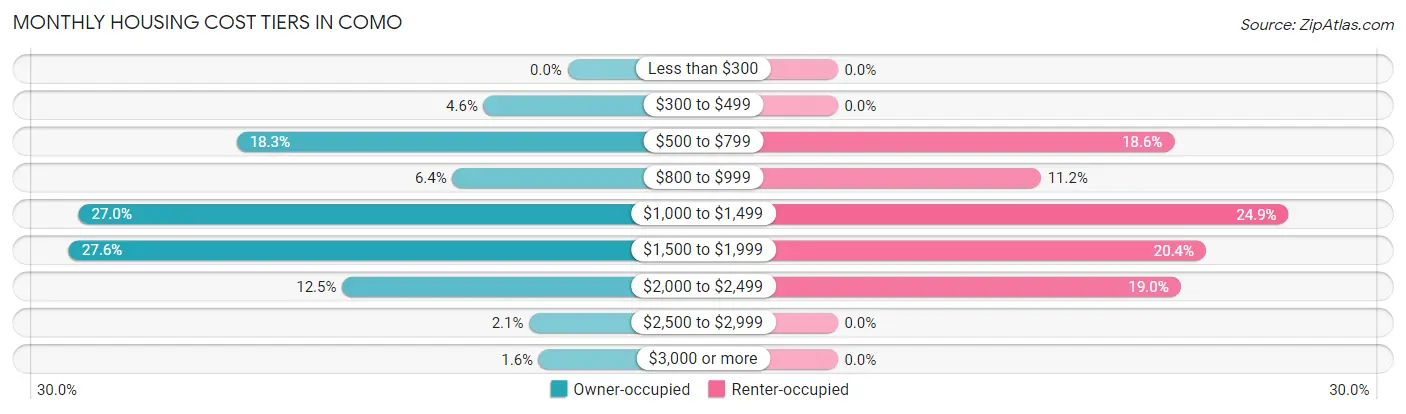
| Monthly Cost | Owner-occupied | Renter-occupied |
| Less than $300 | 0 (0.0%) | 0 (0.0%) |
| $300 to $499 | 35 (4.6%) | 0 (0.0%) |
| $500 to $799 | 138 (18.3%) | 53 (18.6%) |
| $800 to $999 | 48 (6.4%) | 32 (11.2%) |
| $1,000 to $1,499 | 204 (27.0%) | 71 (24.9%) |
| $1,500 to $1,999 | 208 (27.6%) | 58 (20.3%) |
| $2,000 to $2,499 | 94 (12.4%) | 54 (19.0%) |
| $2,500 to $2,999 | 16 (2.1%) | 0 (0.0%) |
| $3,000 or more | 12 (1.6%) | 0 (0.0%) |
| Total | 755 (100.0%) | 285 (100.0%) |
Physical Housing Characteristics in Como
Housing Structures in Como
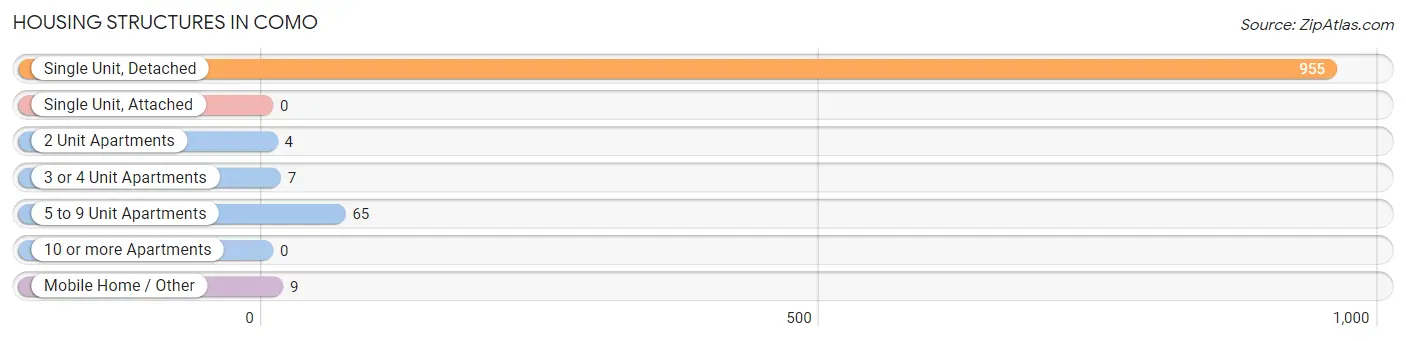
| Structure Type | # Housing Units | % Housing Units |
| Single Unit, Detached | 955 | 91.8% |
| Single Unit, Attached | 0 | 0.0% |
| 2 Unit Apartments | 4 | 0.4% |
| 3 or 4 Unit Apartments | 7 | 0.7% |
| 5 to 9 Unit Apartments | 65 | 6.2% |
| 10 or more Apartments | 0 | 0.0% |
| Mobile Home / Other | 9 | 0.9% |
| Total | 1,040 | 100.0% |
Housing Structures by Occupancy in Como
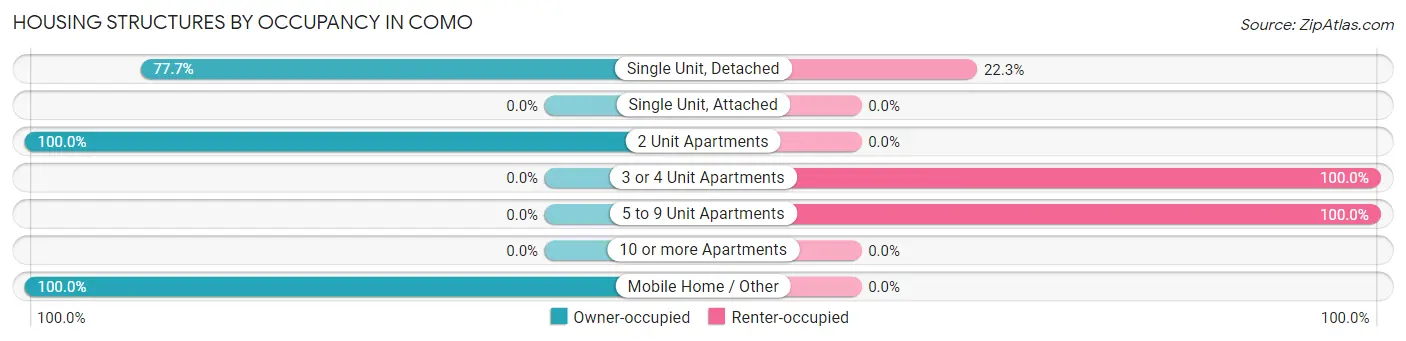
| Structure Type | Owner-occupied | Renter-occupied |
| Single Unit, Detached | 742 (77.7%) | 213 (22.3%) |
| Single Unit, Attached | 0 (0.0%) | 0 (0.0%) |
| 2 Unit Apartments | 4 (100.0%) | 0 (0.0%) |
| 3 or 4 Unit Apartments | 0 (0.0%) | 7 (100.0%) |
| 5 to 9 Unit Apartments | 0 (0.0%) | 65 (100.0%) |
| 10 or more Apartments | 0 (0.0%) | 0 (0.0%) |
| Mobile Home / Other | 9 (100.0%) | 0 (0.0%) |
| Total | 755 (72.6%) | 285 (27.4%) |
Housing Structures by Number of Rooms in Como
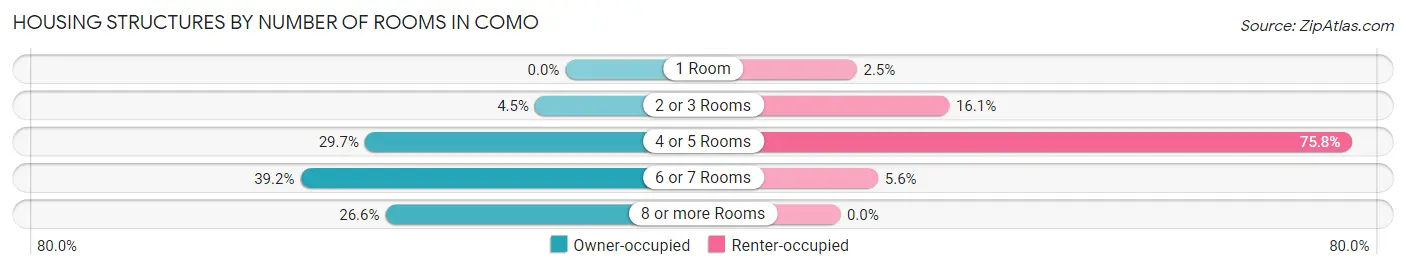
| Number of Rooms | Owner-occupied | Renter-occupied |
| 1 Room | 0 (0.0%) | 7 (2.5%) |
| 2 or 3 Rooms | 34 (4.5%) | 46 (16.1%) |
| 4 or 5 Rooms | 224 (29.7%) | 216 (75.8%) |
| 6 or 7 Rooms | 296 (39.2%) | 16 (5.6%) |
| 8 or more Rooms | 201 (26.6%) | 0 (0.0%) |
| Total | 755 (100.0%) | 285 (100.0%) |
Housing Structure by Heating Type in Como
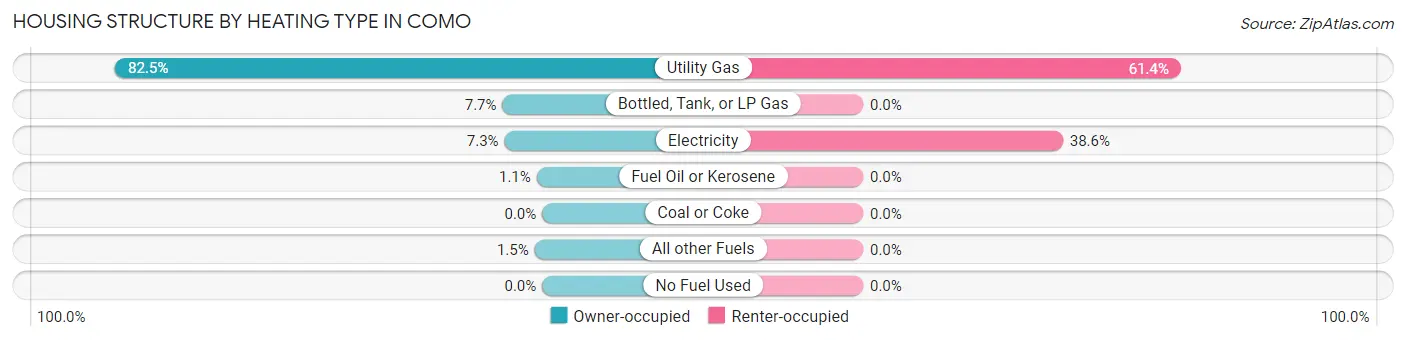
| Heating Type | Owner-occupied | Renter-occupied |
| Utility Gas | 623 (82.5%) | 175 (61.4%) |
| Bottled, Tank, or LP Gas | 58 (7.7%) | 0 (0.0%) |
| Electricity | 55 (7.3%) | 110 (38.6%) |
| Fuel Oil or Kerosene | 8 (1.1%) | 0 (0.0%) |
| Coal or Coke | 0 (0.0%) | 0 (0.0%) |
| All other Fuels | 11 (1.5%) | 0 (0.0%) |
| No Fuel Used | 0 (0.0%) | 0 (0.0%) |
| Total | 755 (100.0%) | 285 (100.0%) |
Household Vehicle Usage in Como
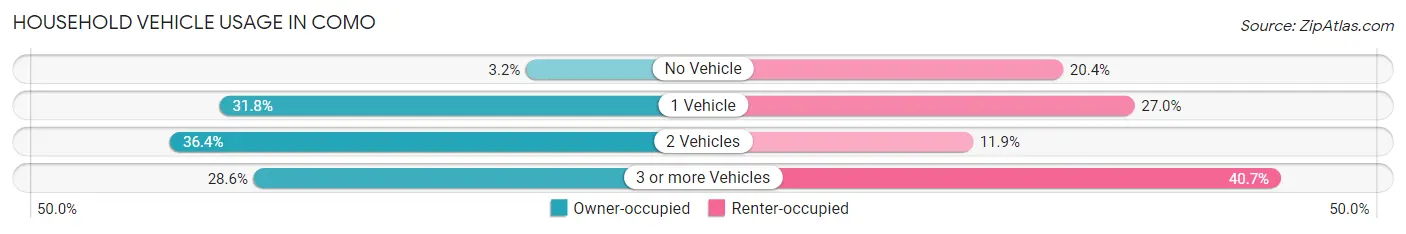
| Vehicles per Household | Owner-occupied | Renter-occupied |
| No Vehicle | 24 (3.2%) | 58 (20.3%) |
| 1 Vehicle | 240 (31.8%) | 77 (27.0%) |
| 2 Vehicles | 275 (36.4%) | 34 (11.9%) |
| 3 or more Vehicles | 216 (28.6%) | 116 (40.7%) |
| Total | 755 (100.0%) | 285 (100.0%) |
Real Estate & Mortgages in Como
Real Estate and Mortgage Overview in Como
| Characteristic | Without Mortgage | With Mortgage |
| Housing Units | 186 | 569 |
| Median Property Value | $226,200 | $248,700 |
| Median Household Income | $72,500 | $158 |
| Monthly Housing Costs | $591 | $12 |
| Real Estate Taxes | $3,843 | $0 |
Property Value by Mortgage Status in Como
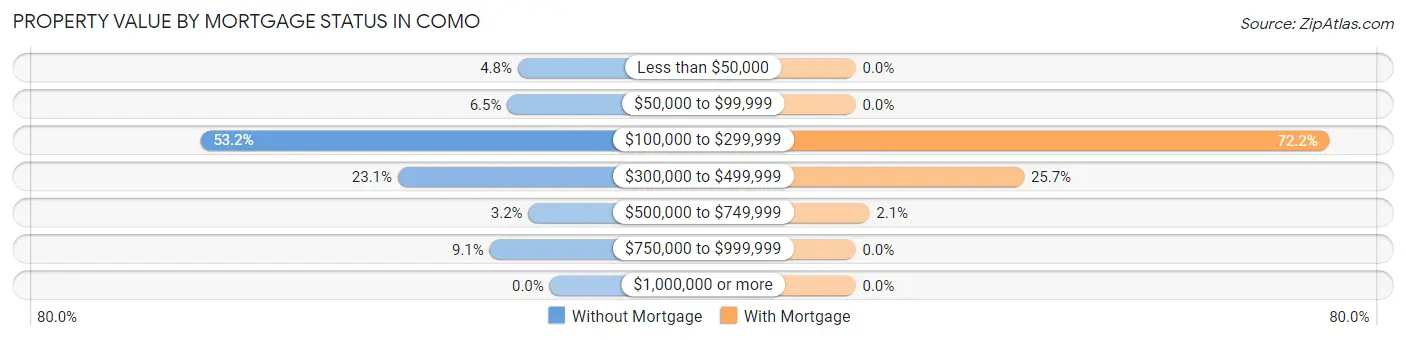
| Property Value | Without Mortgage | With Mortgage |
| Less than $50,000 | 9 (4.8%) | 0 (0.0%) |
| $50,000 to $99,999 | 12 (6.5%) | 0 (0.0%) |
| $100,000 to $299,999 | 99 (53.2%) | 411 (72.2%) |
| $300,000 to $499,999 | 43 (23.1%) | 146 (25.7%) |
| $500,000 to $749,999 | 6 (3.2%) | 12 (2.1%) |
| $750,000 to $999,999 | 17 (9.1%) | 0 (0.0%) |
| $1,000,000 or more | 0 (0.0%) | 0 (0.0%) |
| Total | 186 (100.0%) | 569 (100.0%) |
Household Income by Mortgage Status in Como
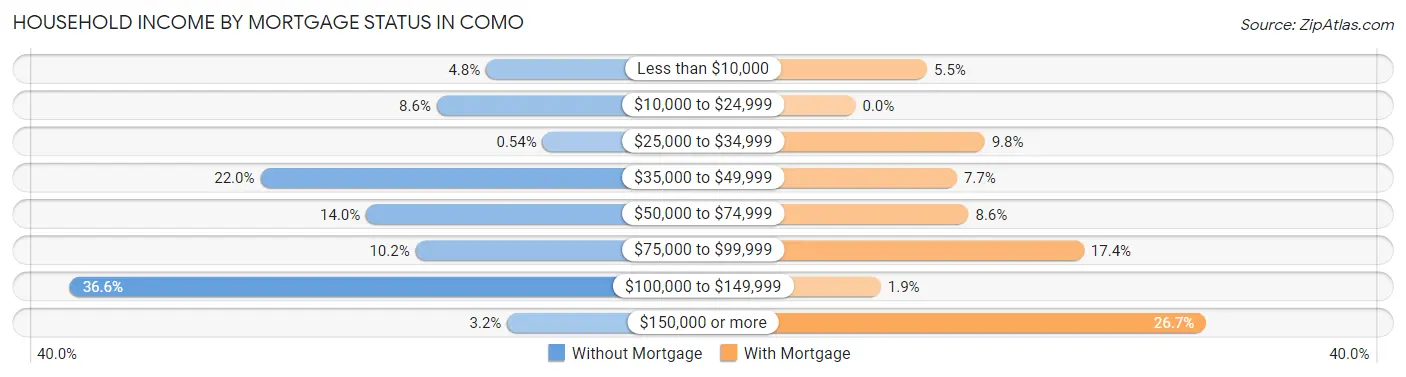
| Household Income | Without Mortgage | With Mortgage |
| Less than $10,000 | 9 (4.8%) | 31 (5.4%) |
| $10,000 to $24,999 | 16 (8.6%) | 0 (0.0%) |
| $25,000 to $34,999 | 1 (0.5%) | 56 (9.8%) |
| $35,000 to $49,999 | 41 (22.0%) | 44 (7.7%) |
| $50,000 to $74,999 | 26 (14.0%) | 49 (8.6%) |
| $75,000 to $99,999 | 19 (10.2%) | 99 (17.4%) |
| $100,000 to $149,999 | 68 (36.6%) | 11 (1.9%) |
| $150,000 or more | 6 (3.2%) | 152 (26.7%) |
| Total | 186 (100.0%) | 569 (100.0%) |
Property Value to Household Income Ratio in Como
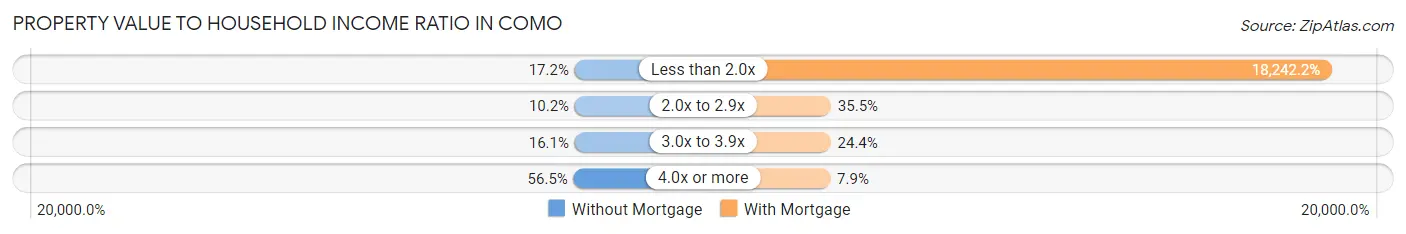
| Value-to-Income Ratio | Without Mortgage | With Mortgage |
| Less than 2.0x | 32 (17.2%) | 103,798 (18,242.2%) |
| 2.0x to 2.9x | 19 (10.2%) | 202 (35.5%) |
| 3.0x to 3.9x | 30 (16.1%) | 139 (24.4%) |
| 4.0x or more | 105 (56.5%) | 45 (7.9%) |
| Total | 186 (100.0%) | 569 (100.0%) |
Real Estate Taxes by Mortgage Status in Como
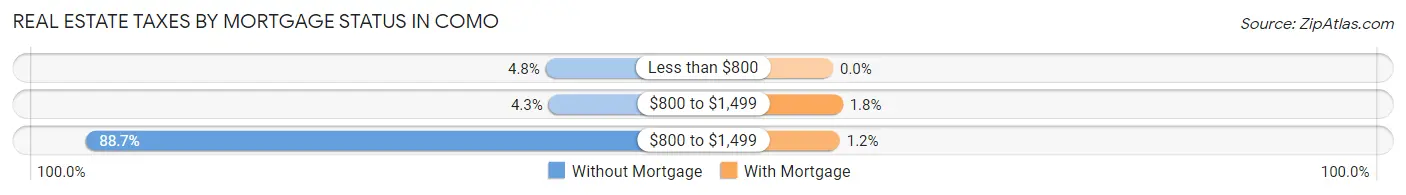
| Property Taxes | Without Mortgage | With Mortgage |
| Less than $800 | 9 (4.8%) | 0 (0.0%) |
| $800 to $1,499 | 8 (4.3%) | 10 (1.8%) |
| $800 to $1,499 | 165 (88.7%) | 7 (1.2%) |
| Total | 186 (100.0%) | 569 (100.0%) |
Health & Disability in Como
Health Insurance Coverage by Age in Como
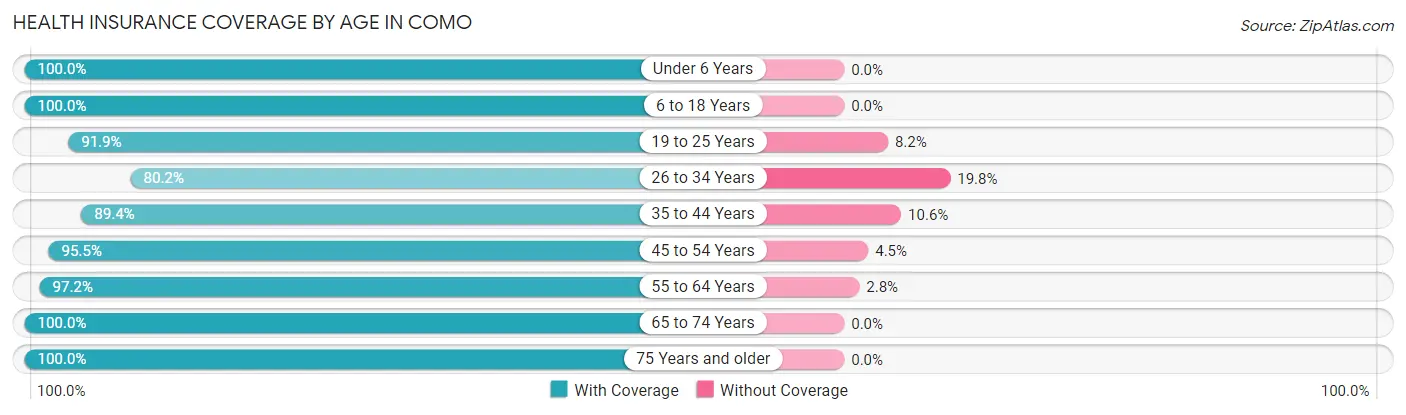
| Age Bracket | With Coverage | Without Coverage |
| Under 6 Years | 86 (100.0%) | 0 (0.0%) |
| 6 to 18 Years | 431 (100.0%) | 0 (0.0%) |
| 19 to 25 Years | 169 (91.8%) | 15 (8.2%) |
| 26 to 34 Years | 353 (80.2%) | 87 (19.8%) |
| 35 to 44 Years | 194 (89.4%) | 23 (10.6%) |
| 45 to 54 Years | 299 (95.5%) | 14 (4.5%) |
| 55 to 64 Years | 277 (97.2%) | 8 (2.8%) |
| 65 to 74 Years | 246 (100.0%) | 0 (0.0%) |
| 75 Years and older | 107 (100.0%) | 0 (0.0%) |
| Total | 2,162 (93.6%) | 147 (6.4%) |
Health Insurance Coverage by Citizenship Status in Como
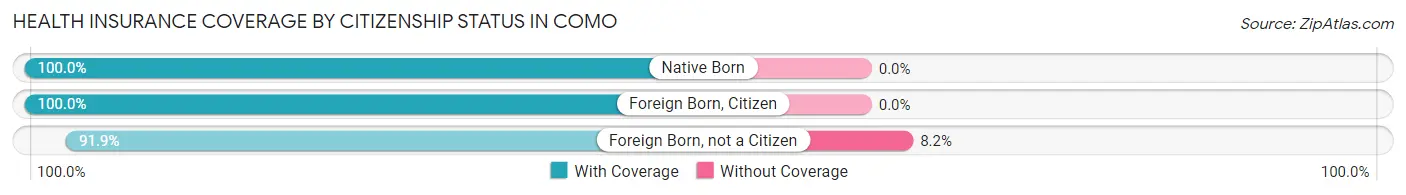
| Citizenship Status | With Coverage | Without Coverage |
| Native Born | 86 (100.0%) | 0 (0.0%) |
| Foreign Born, Citizen | 431 (100.0%) | 0 (0.0%) |
| Foreign Born, not a Citizen | 169 (91.8%) | 15 (8.2%) |
Health Insurance Coverage by Household Income in Como
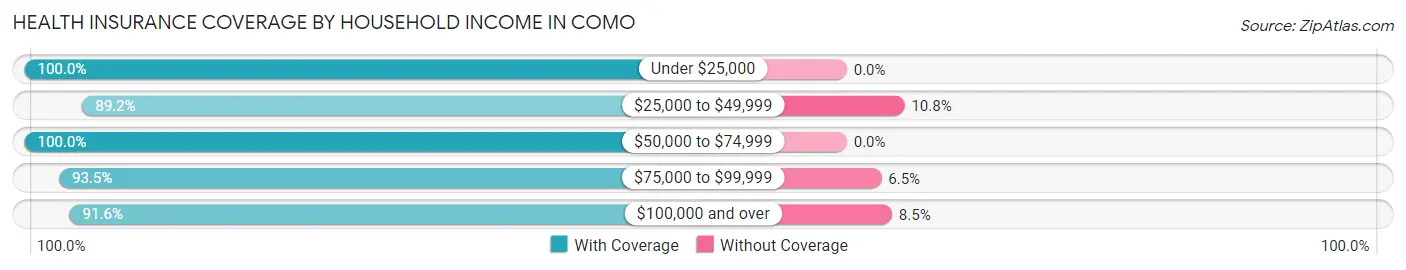
| Household Income | With Coverage | Without Coverage |
| Under $25,000 | 163 (100.0%) | 0 (0.0%) |
| $25,000 to $49,999 | 264 (89.2%) | 32 (10.8%) |
| $50,000 to $74,999 | 442 (100.0%) | 0 (0.0%) |
| $75,000 to $99,999 | 188 (93.5%) | 13 (6.5%) |
| $100,000 and over | 1,105 (91.5%) | 102 (8.5%) |
Public vs Private Health Insurance Coverage by Age in Como
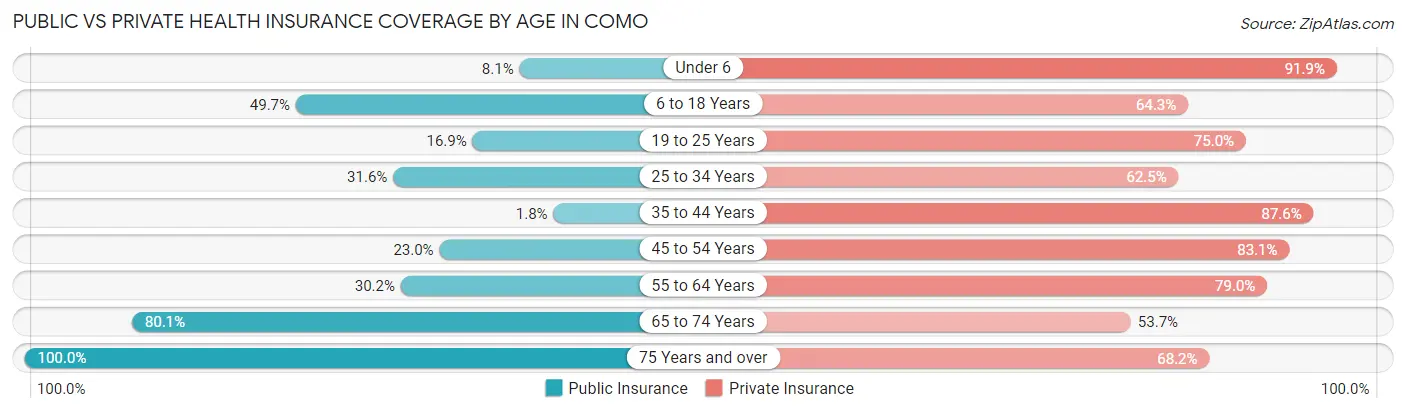
| Age Bracket | Public Insurance | Private Insurance |
| Under 6 | 7 (8.1%) | 79 (91.9%) |
| 6 to 18 Years | 214 (49.6%) | 277 (64.3%) |
| 19 to 25 Years | 31 (16.9%) | 138 (75.0%) |
| 25 to 34 Years | 139 (31.6%) | 275 (62.5%) |
| 35 to 44 Years | 4 (1.8%) | 190 (87.6%) |
| 45 to 54 Years | 72 (23.0%) | 260 (83.1%) |
| 55 to 64 Years | 86 (30.2%) | 225 (78.9%) |
| 65 to 74 Years | 197 (80.1%) | 132 (53.7%) |
| 75 Years and over | 107 (100.0%) | 73 (68.2%) |
| Total | 857 (37.1%) | 1,649 (71.4%) |
Disability Status by Sex by Age in Como
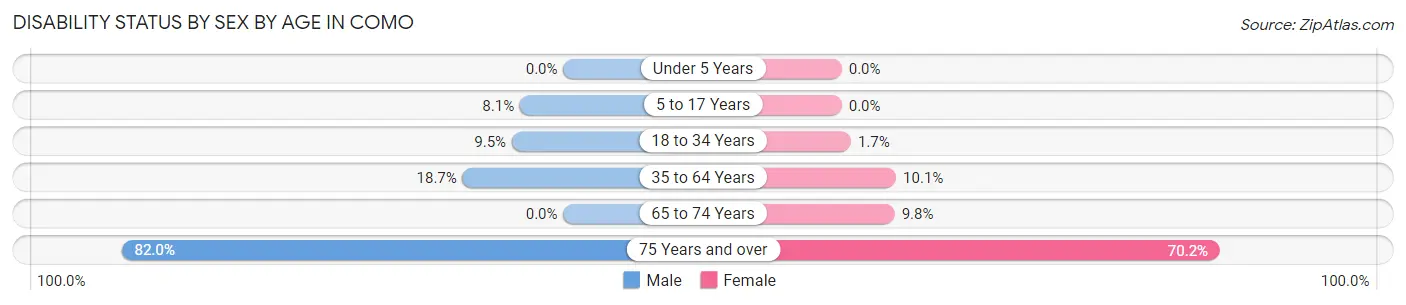
| Age Bracket | Male | Female |
| Under 5 Years | 0 (0.0%) | 0 (0.0%) |
| 5 to 17 Years | 12 (8.1%) | 0 (0.0%) |
| 18 to 34 Years | 23 (9.5%) | 7 (1.7%) |
| 35 to 64 Years | 69 (18.7%) | 45 (10.1%) |
| 65 to 74 Years | 0 (0.0%) | 11 (9.8%) |
| 75 Years and over | 41 (82.0%) | 40 (70.2%) |
Disability Class by Sex by Age in Como
Disability Class: Hearing Difficulty
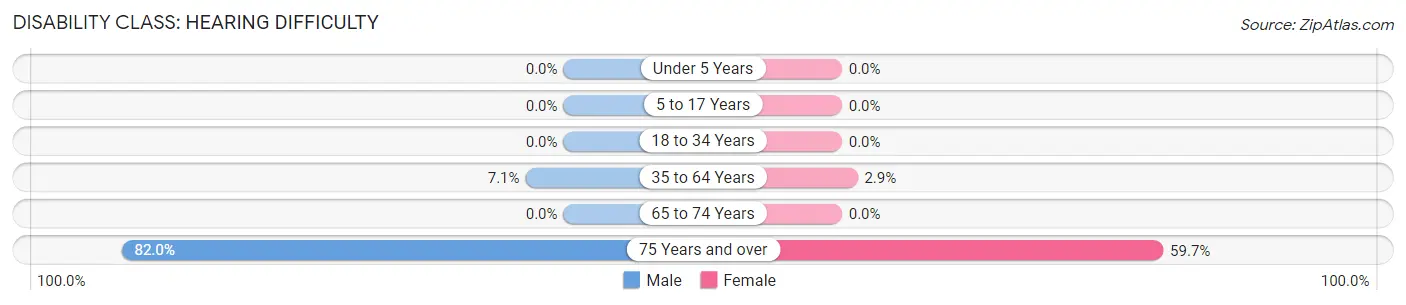
| Age Bracket | Male | Female |
| Under 5 Years | 0 (0.0%) | 0 (0.0%) |
| 5 to 17 Years | 0 (0.0%) | 0 (0.0%) |
| 18 to 34 Years | 0 (0.0%) | 0 (0.0%) |
| 35 to 64 Years | 26 (7.0%) | 13 (2.9%) |
| 65 to 74 Years | 0 (0.0%) | 0 (0.0%) |
| 75 Years and over | 41 (82.0%) | 34 (59.7%) |
Disability Class: Vision Difficulty
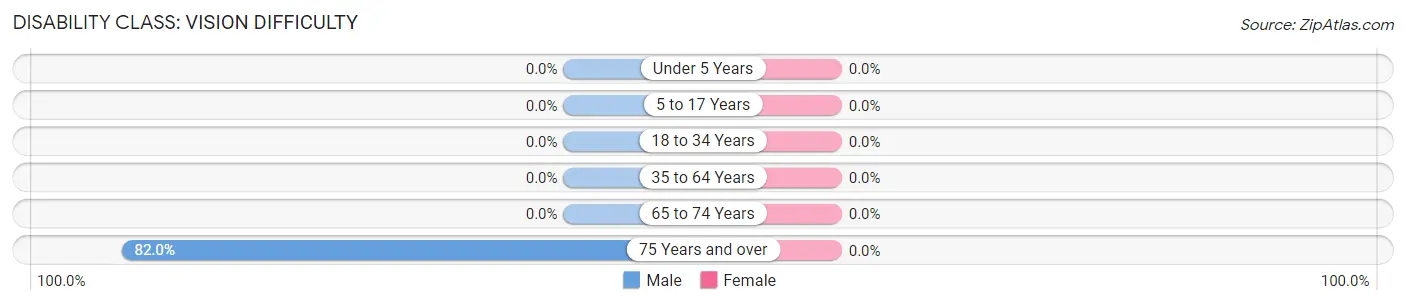
| Age Bracket | Male | Female |
| Under 5 Years | 0 (0.0%) | 0 (0.0%) |
| 5 to 17 Years | 0 (0.0%) | 0 (0.0%) |
| 18 to 34 Years | 0 (0.0%) | 0 (0.0%) |
| 35 to 64 Years | 0 (0.0%) | 0 (0.0%) |
| 65 to 74 Years | 0 (0.0%) | 0 (0.0%) |
| 75 Years and over | 41 (82.0%) | 0 (0.0%) |
Disability Class: Cognitive Difficulty
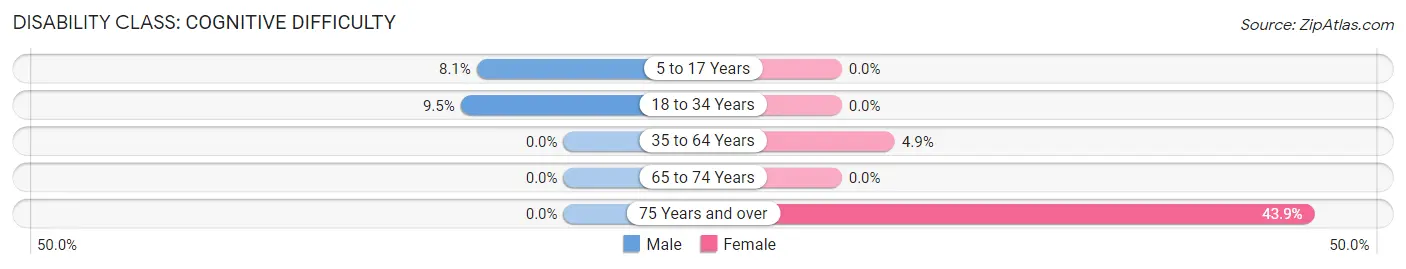
| Age Bracket | Male | Female |
| 5 to 17 Years | 12 (8.1%) | 0 (0.0%) |
| 18 to 34 Years | 23 (9.5%) | 0 (0.0%) |
| 35 to 64 Years | 0 (0.0%) | 22 (4.9%) |
| 65 to 74 Years | 0 (0.0%) | 0 (0.0%) |
| 75 Years and over | 0 (0.0%) | 25 (43.9%) |
Disability Class: Ambulatory Difficulty
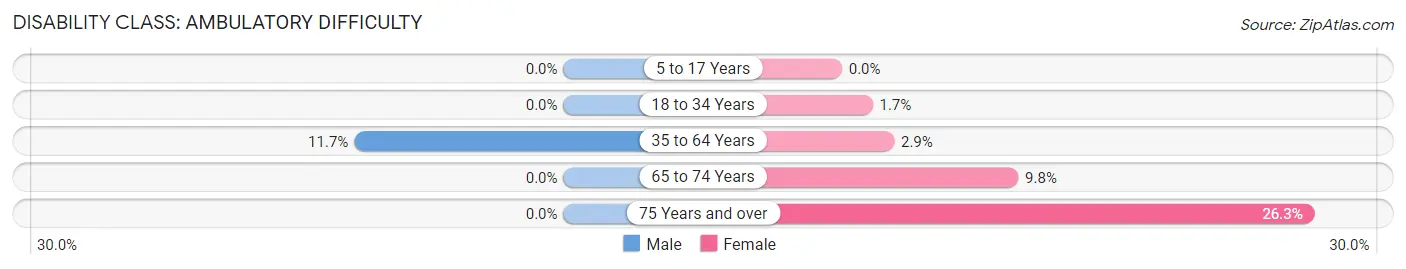
| Age Bracket | Male | Female |
| 5 to 17 Years | 0 (0.0%) | 0 (0.0%) |
| 18 to 34 Years | 0 (0.0%) | 7 (1.7%) |
| 35 to 64 Years | 43 (11.7%) | 13 (2.9%) |
| 65 to 74 Years | 0 (0.0%) | 11 (9.8%) |
| 75 Years and over | 0 (0.0%) | 15 (26.3%) |
Disability Class: Self-Care Difficulty
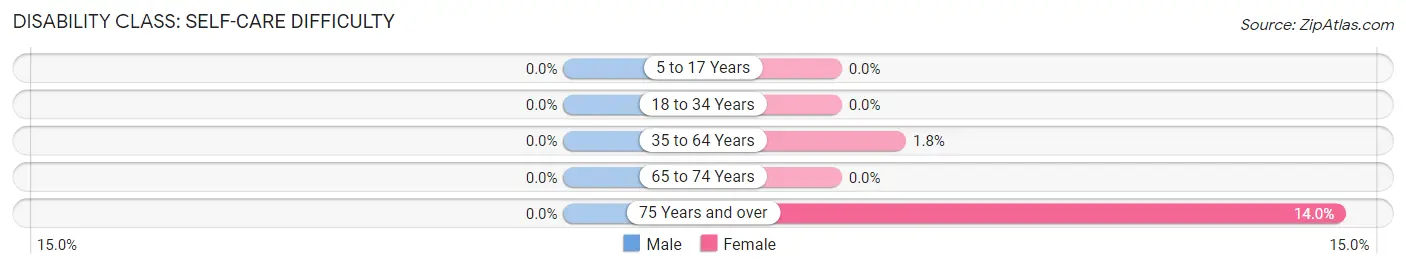
| Age Bracket | Male | Female |
| 5 to 17 Years | 0 (0.0%) | 0 (0.0%) |
| 18 to 34 Years | 0 (0.0%) | 0 (0.0%) |
| 35 to 64 Years | 0 (0.0%) | 8 (1.8%) |
| 65 to 74 Years | 0 (0.0%) | 0 (0.0%) |
| 75 Years and over | 0 (0.0%) | 8 (14.0%) |
Technology Access in Como
Computing Device Access in Como
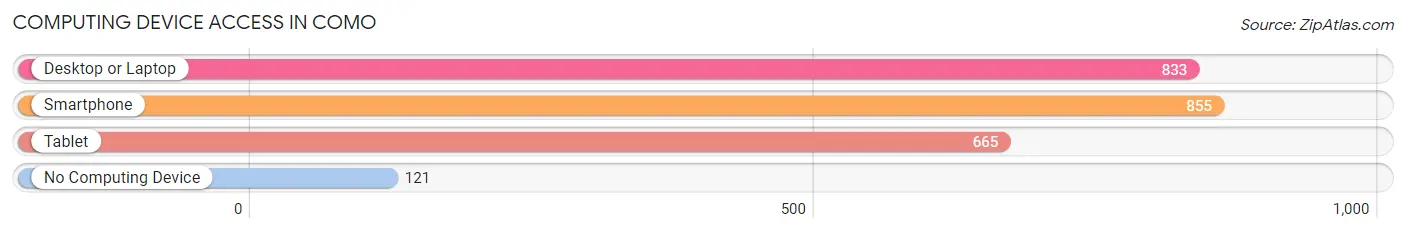
| Device Type | # Households | % Households |
| Desktop or Laptop | 833 | 80.1% |
| Smartphone | 855 | 82.2% |
| Tablet | 665 | 63.9% |
| No Computing Device | 121 | 11.6% |
| Total | 1,040 | 100.0% |
Internet Access in Como
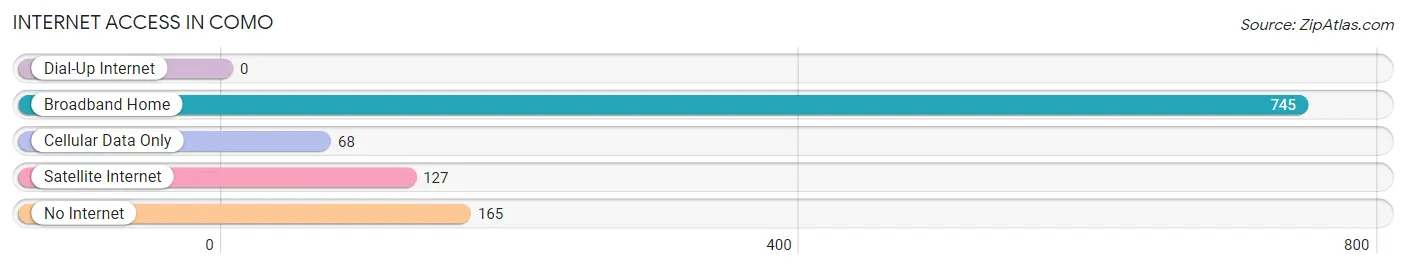
| Internet Type | # Households | % Households |
| Dial-Up Internet | 0 | 0.0% |
| Broadband Home | 745 | 71.6% |
| Cellular Data Only | 68 | 6.5% |
| Satellite Internet | 127 | 12.2% |
| No Internet | 165 | 15.9% |
| Total | 1,040 | 100.0% |
Como Summary
Como is a small unincorporated community located in St. Croix County, Wisconsin, United States. It is situated on the banks of the St. Croix River, just south of the city of Hudson. The community is named after the Italian city of Como, and was founded in 1854 by settlers from New England.
History
The first settlers in the area of Como were from New England, and they arrived in 1854. They were attracted to the area by the abundance of timber and the potential for farming. The settlers built a sawmill and a gristmill, and the community began to grow. By the late 1800s, Como had become a thriving community, with a post office, a school, a church, and several stores.
In the early 1900s, Como was a popular destination for tourists, who came to enjoy the scenery and the fishing on the St. Croix River. The community also had a thriving lumber industry, and several sawmills were located in the area.
In the 1950s, Como began to decline as the lumber industry moved away and the population began to decline. The post office closed in the 1960s, and the school closed in the 1970s. Today, Como is a small, quiet community, with a population of just over 200 people.
Geography
Como is located in St. Croix County, Wisconsin, on the banks of the St. Croix River. The community is situated just south of the city of Hudson, and is bordered by the towns of Troy and Kinnickinnic. The terrain in the area is mostly flat, with some rolling hills. The climate is humid continental, with cold winters and warm summers.
Economy
Como is a small, rural community, and the economy is largely based on agriculture. The area is home to several farms, which produce a variety of crops, including corn, soybeans, and hay. There are also several small businesses in the area, including a gas station, a convenience store, and a restaurant.
Demographics
As of the 2010 census, the population of Como was 206. The racial makeup of the community was 97.1% White, 0.5% African American, 0.5% Native American, 0.5% Asian, and 1.5% from other races. The median household income was $45,833, and the median family income was $50,000. The per capita income was $20,945.
Conclusion
Como is a small, rural community located in St. Croix County, Wisconsin. It was founded in 1854 by settlers from New England, and was once a thriving community with a post office, a school, a church, and several stores. Today, Como is a quiet community, with a population of just over 200 people. The economy is largely based on agriculture, and there are several small businesses in the area. The population is mostly White, with a small percentage of African American, Native American, and Asian residents.
Common Questions
What is Per Capita Income in Como?
Per Capita income in Como is $37,641.
What is the Median Family Income in Como?
Median Family Income in Como is $78,542.
What is the Median Household income in Como?
Median Household Income in Como is $74,659.
What is Income or Wage Gap in Como?
Income or Wage Gap in Como is 25.1%.
Women in Como earn 74.9 cents for every dollar earned by a man.
What is Inequality or Gini Index in Como?
Inequality or Gini Index in Como is 0.38.
What is the Total Population of Como?
Total Population of Como is 2,309.
What is the Total Male Population of Como?
Total Male Population of Como is 975.
What is the Total Female Population of Como?
Total Female Population of Como is 1,334.
What is the Ratio of Males per 100 Females in Como?
There are 73.09 Males per 100 Females in Como.
What is the Ratio of Females per 100 Males in Como?
There are 136.82 Females per 100 Males in Como.
What is the Median Population Age in Como?
Median Population Age in Como is 36.6 Years.
What is the Average Family Size in Como
Average Family Size in Como is 2.7 People.
What is the Average Household Size in Como
Average Household Size in Como is 2.2 People.
How Large is the Labor Force in Como?
There are 1,335 People in the Labor Forcein in Como.
What is the Percentage of People in the Labor Force in Como?
70.8% of People are in the Labor Force in Como.
What is the Unemployment Rate in Como?
Unemployment Rate in Como is 3.4%.