Plymouth, WI Map & Demographics
Plymouth Map
Plymouth Overview
$34,630
PER CAPITA INCOME
$84,747
AVG FAMILY INCOME
$65,893
AVG HOUSEHOLD INCOME
17.1%
WAGE / INCOME GAP [ % ]
82.9¢/ $1
WAGE / INCOME GAP [ $ ]
0.38
INEQUALITY / GINI INDEX
8,907
TOTAL POPULATION
4,183
MALE POPULATION
4,724
FEMALE POPULATION
88.55
MALES / 100 FEMALES
112.93
FEMALES / 100 MALES
44.1
MEDIAN AGE
3.0
AVG FAMILY SIZE
2.2
AVG HOUSEHOLD SIZE
4,542
LABOR FORCE [ PEOPLE ]
63.0%
PERCENT IN LABOR FORCE
5.1%
UNEMPLOYMENT RATE
Plymouth Zip Codes
Plymouth Area Codes
Income in Plymouth
Income Overview in Plymouth
Per Capita Income in Plymouth is $34,630, while median incomes of families and households are $84,747 and $65,893 respectively.
| Characteristic | Number | Measure |
| Per Capita Income | 8,907 | $34,630 |
| Median Family Income | 2,191 | $84,747 |
| Mean Family Income | 2,191 | $98,035 |
| Median Household Income | 4,011 | $65,893 |
| Mean Household Income | 4,011 | $75,339 |
| Income Deficit | 2,191 | $0 |
| Wage / Income Gap (%) | 8,907 | 17.06% |
| Wage / Income Gap ($) | 8,907 | 82.94¢ per $1 |
| Gini / Inequality Index | 8,907 | 0.38 |
Earnings by Sex in Plymouth
Average Earnings in Plymouth are $41,903, $46,380 for men and $38,466 for women, a difference of 17.1%.
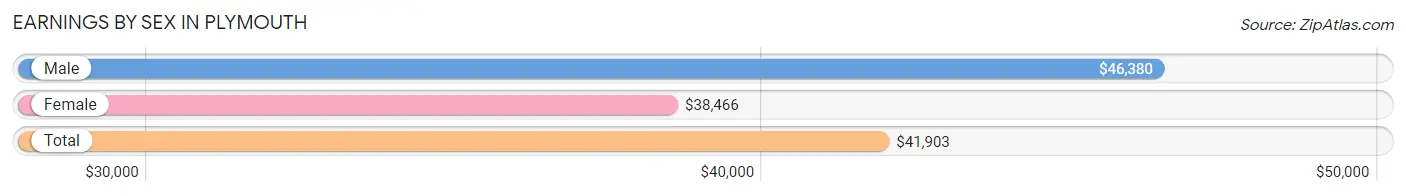
| Sex | Number | Average Earnings |
| Male | 2,437 (50.5%) | $46,380 |
| Female | 2,384 (49.4%) | $38,466 |
| Total | 4,821 (100.0%) | $41,903 |
Earnings by Sex by Income Bracket in Plymouth
The most common earnings brackets in Plymouth are $100,000+ for men (299 | 12.3%) and $65,000 to $74,999 for women (237 | 9.9%).
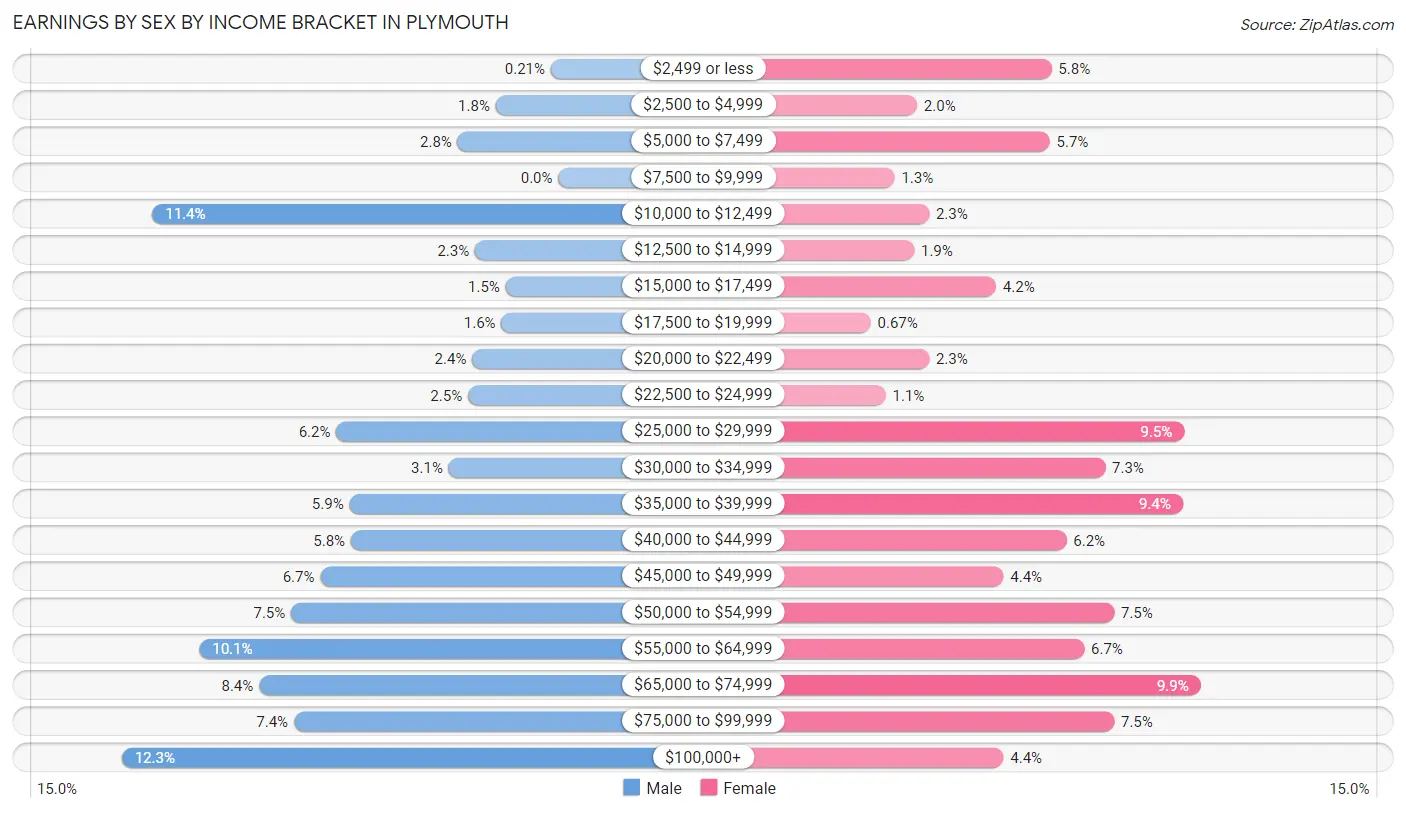
| Income | Male | Female |
| $2,499 or less | 5 (0.2%) | 137 (5.8%) |
| $2,500 to $4,999 | 43 (1.8%) | 47 (2.0%) |
| $5,000 to $7,499 | 69 (2.8%) | 136 (5.7%) |
| $7,500 to $9,999 | 0 (0.0%) | 32 (1.3%) |
| $10,000 to $12,499 | 278 (11.4%) | 55 (2.3%) |
| $12,500 to $14,999 | 57 (2.3%) | 45 (1.9%) |
| $15,000 to $17,499 | 36 (1.5%) | 100 (4.2%) |
| $17,500 to $19,999 | 39 (1.6%) | 16 (0.7%) |
| $20,000 to $22,499 | 59 (2.4%) | 55 (2.3%) |
| $22,500 to $24,999 | 62 (2.5%) | 26 (1.1%) |
| $25,000 to $29,999 | 152 (6.2%) | 226 (9.5%) |
| $30,000 to $34,999 | 75 (3.1%) | 173 (7.3%) |
| $35,000 to $39,999 | 143 (5.9%) | 225 (9.4%) |
| $40,000 to $44,999 | 142 (5.8%) | 147 (6.2%) |
| $45,000 to $49,999 | 163 (6.7%) | 105 (4.4%) |
| $50,000 to $54,999 | 183 (7.5%) | 179 (7.5%) |
| $55,000 to $64,999 | 246 (10.1%) | 159 (6.7%) |
| $65,000 to $74,999 | 205 (8.4%) | 237 (9.9%) |
| $75,000 to $99,999 | 181 (7.4%) | 179 (7.5%) |
| $100,000+ | 299 (12.3%) | 105 (4.4%) |
| Total | 2,437 (100.0%) | 2,384 (100.0%) |
Earnings by Sex by Educational Attainment in Plymouth
Average earnings in Plymouth are $50,250 for men and $43,538 for women, a difference of 13.4%. Men with an educational attainment of graduate degree enjoy the highest average annual earnings of $107,500, while those with high school diploma education earn the least with $34,886. Women with an educational attainment of bachelor's degree earn the most with the average annual earnings of $67,321, while those with high school diploma education have the smallest earnings of $36,316.
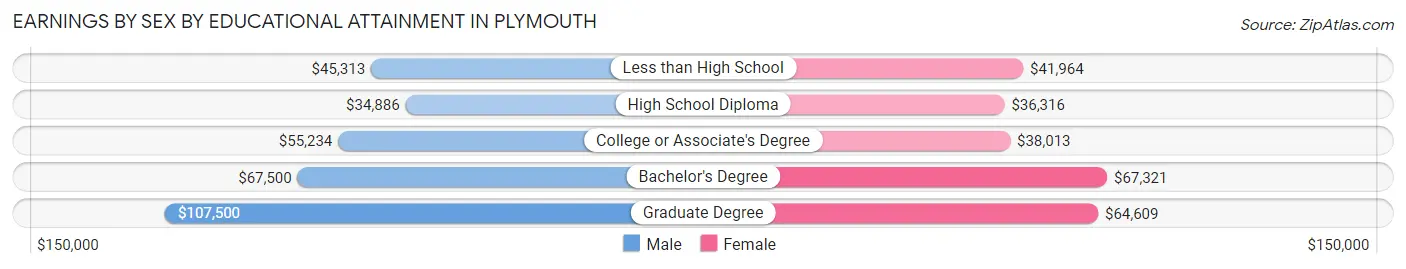
| Educational Attainment | Male Income | Female Income |
| Less than High School | $45,313 | $41,964 |
| High School Diploma | $34,886 | $36,316 |
| College or Associate's Degree | $55,234 | $38,013 |
| Bachelor's Degree | $67,500 | $67,321 |
| Graduate Degree | $107,500 | $64,609 |
| Total | $50,250 | $43,538 |
Family Income in Plymouth
Family Income Brackets in Plymouth
According to the Plymouth family income data, there are 570 families falling into the $100,000 to $149,999 income range, which is the most common income bracket and makes up 26.0% of all families. Conversely, the $10,000 to $14,999 income bracket is the least frequent group with only 11 families (0.5%) belonging to this category.
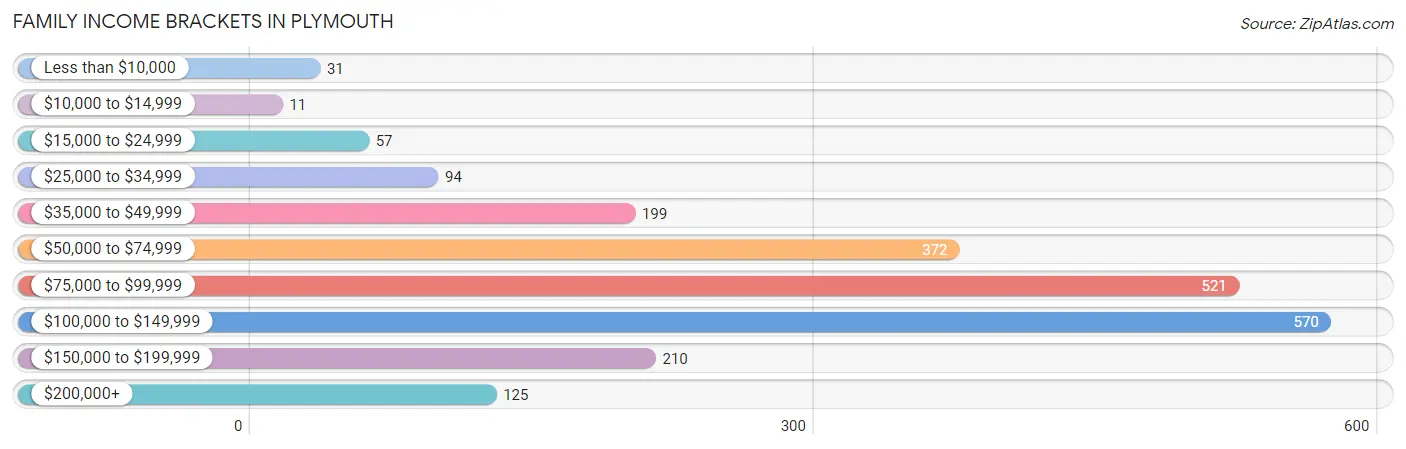
| Income Bracket | # Families | % Families |
| Less than $10,000 | 31 | 1.4% |
| $10,000 to $14,999 | 11 | 0.5% |
| $15,000 to $24,999 | 57 | 2.6% |
| $25,000 to $34,999 | 94 | 4.3% |
| $35,000 to $49,999 | 199 | 9.1% |
| $50,000 to $74,999 | 372 | 17.0% |
| $75,000 to $99,999 | 521 | 23.8% |
| $100,000 to $149,999 | 570 | 26.0% |
| $150,000 to $199,999 | 210 | 9.6% |
| $200,000+ | 125 | 5.7% |
Family Income by Famaliy Size in Plymouth
6-person families (66 | 3.0%) account for the highest median family income in Plymouth with $160,000 per family, while 2-person families (1,252 | 57.1%) have the highest median income of $39,506 per family member.
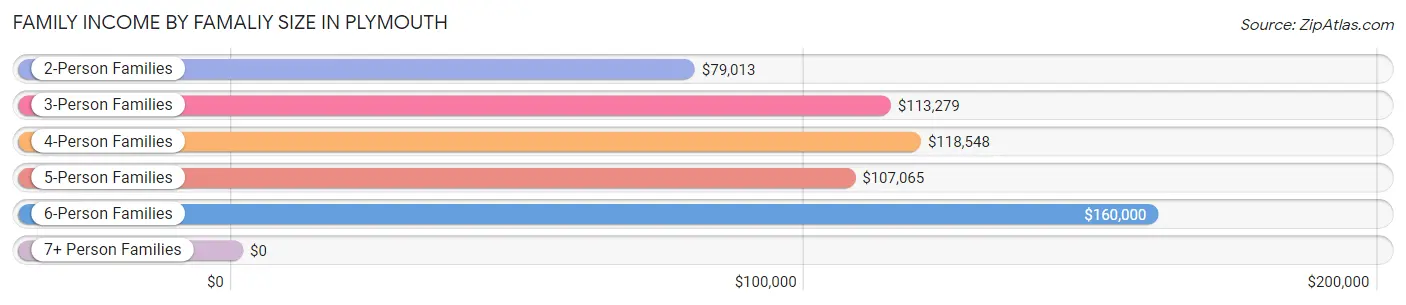
| Income Bracket | # Families | Median Income |
| 2-Person Families | 1,252 (57.1%) | $79,013 |
| 3-Person Families | 361 (16.5%) | $113,279 |
| 4-Person Families | 348 (15.9%) | $118,548 |
| 5-Person Families | 146 (6.7%) | $107,065 |
| 6-Person Families | 66 (3.0%) | $160,000 |
| 7+ Person Families | 18 (0.8%) | $0 |
| Total | 2,191 (100.0%) | $84,747 |
Family Income by Number of Earners in Plymouth
The median family income in Plymouth is $84,747, with families comprising 3+ earners (304) having the highest median family income of $140,588, while families with no earners (413) have the lowest median family income of $46,985, accounting for 13.9% and 18.9% of families, respectively.
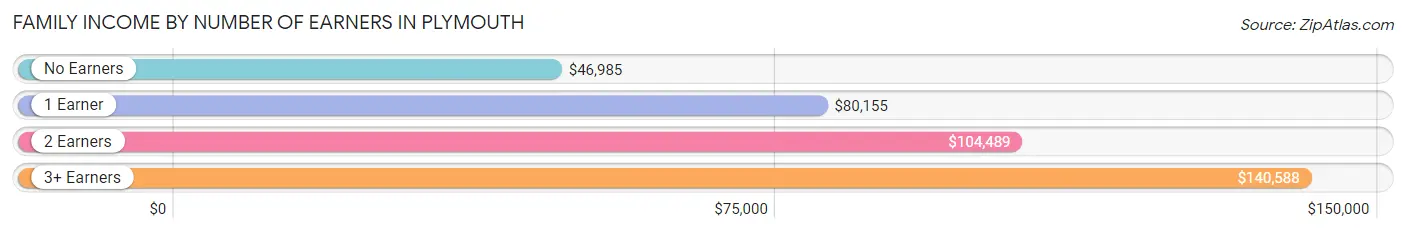
| Number of Earners | # Families | Median Income |
| No Earners | 413 (18.9%) | $46,985 |
| 1 Earner | 659 (30.1%) | $80,155 |
| 2 Earners | 815 (37.2%) | $104,489 |
| 3+ Earners | 304 (13.9%) | $140,588 |
| Total | 2,191 (100.0%) | $84,747 |
Household Income in Plymouth
Household Income Brackets in Plymouth
With 766 households falling in the category, the $100,000 to $149,999 income range is the most frequent in Plymouth, accounting for 19.1% of all households. In contrast, only 52 households (1.3%) fall into the $10,000 to $14,999 income bracket, making it the least populous group.
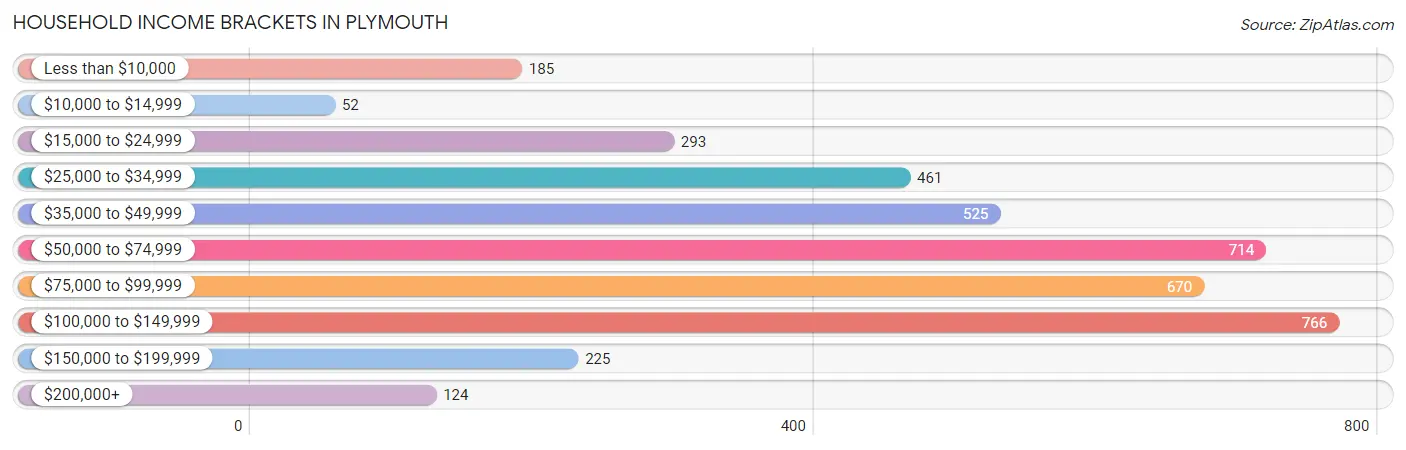
| Income Bracket | # Households | % Households |
| Less than $10,000 | 185 | 4.6% |
| $10,000 to $14,999 | 52 | 1.3% |
| $15,000 to $24,999 | 293 | 7.3% |
| $25,000 to $34,999 | 461 | 11.5% |
| $35,000 to $49,999 | 525 | 13.1% |
| $50,000 to $74,999 | 714 | 17.8% |
| $75,000 to $99,999 | 670 | 16.7% |
| $100,000 to $149,999 | 766 | 19.1% |
| $150,000 to $199,999 | 225 | 5.6% |
| $200,000+ | 124 | 3.1% |
Household Income by Householder Age in Plymouth
The median household income in Plymouth is $65,893, with the highest median household income of $82,080 found in the 45 to 64 years age bracket for the primary householder. A total of 1,468 households (36.6%) fall into this category. Meanwhile, the 15 to 24 years age bracket for the primary householder has the lowest median household income of $0, with 93 households (2.3%) in this group.
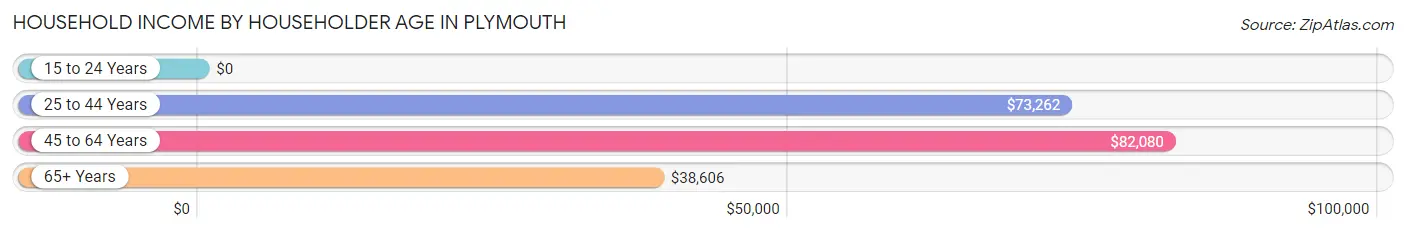
| Income Bracket | # Households | Median Income |
| 15 to 24 Years | 93 (2.3%) | $0 |
| 25 to 44 Years | 979 (24.4%) | $73,262 |
| 45 to 64 Years | 1,468 (36.6%) | $82,080 |
| 65+ Years | 1,471 (36.7%) | $38,606 |
| Total | 4,011 (100.0%) | $65,893 |
Poverty in Plymouth
Income Below Poverty by Sex and Age in Plymouth
With 5.5% poverty level for males and 9.3% for females among the residents of Plymouth, 6 to 11 year old males and 75 year old and over females are the most vulnerable to poverty, with 51 males (18.7%) and 125 females (24.7%) in their respective age groups living below the poverty level.
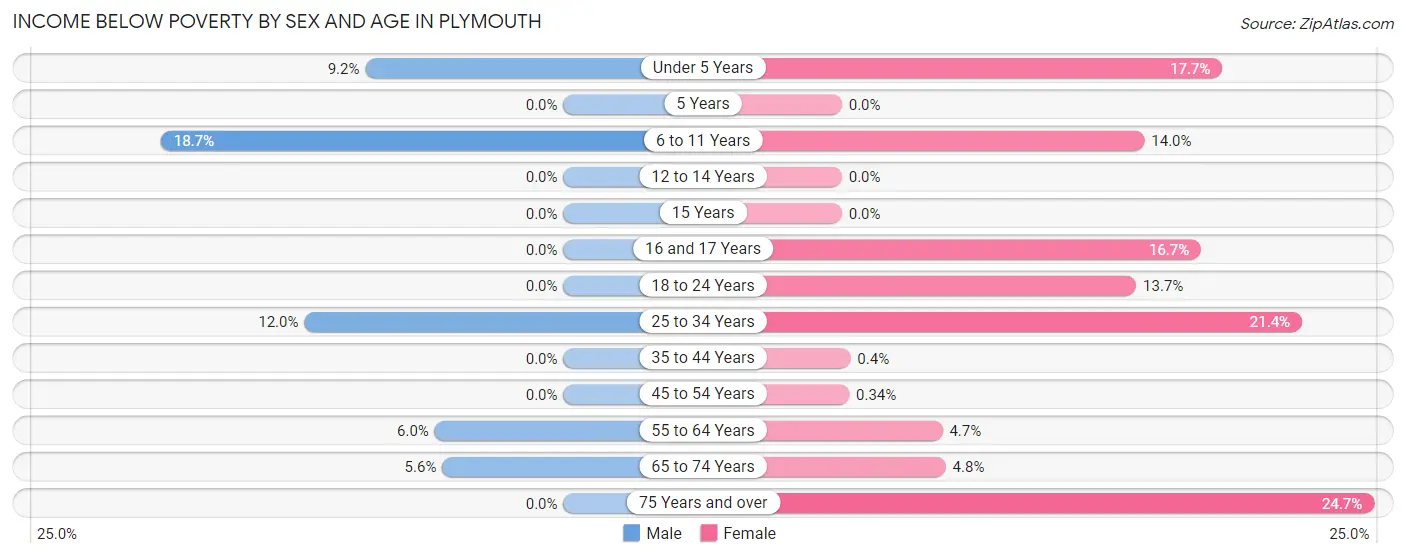
| Age Bracket | Male | Female |
| Under 5 Years | 17 (9.2%) | 48 (17.6%) |
| 5 Years | 0 (0.0%) | 0 (0.0%) |
| 6 to 11 Years | 51 (18.7%) | 56 (14.0%) |
| 12 to 14 Years | 0 (0.0%) | 0 (0.0%) |
| 15 Years | 0 (0.0%) | 0 (0.0%) |
| 16 and 17 Years | 0 (0.0%) | 11 (16.7%) |
| 18 to 24 Years | 0 (0.0%) | 44 (13.7%) |
| 25 to 34 Years | 93 (12.0%) | 79 (21.3%) |
| 35 to 44 Years | 0 (0.0%) | 2 (0.4%) |
| 45 to 54 Years | 0 (0.0%) | 2 (0.3%) |
| 55 to 64 Years | 32 (6.0%) | 36 (4.7%) |
| 65 to 74 Years | 36 (5.6%) | 31 (4.8%) |
| 75 Years and over | 0 (0.0%) | 125 (24.7%) |
| Total | 229 (5.5%) | 434 (9.3%) |
Income Above Poverty by Sex and Age in Plymouth
According to the poverty statistics in Plymouth, males aged 5 years and females aged 5 years are the age groups that are most secure financially, with 100.0% of males and 100.0% of females in these age groups living above the poverty line.
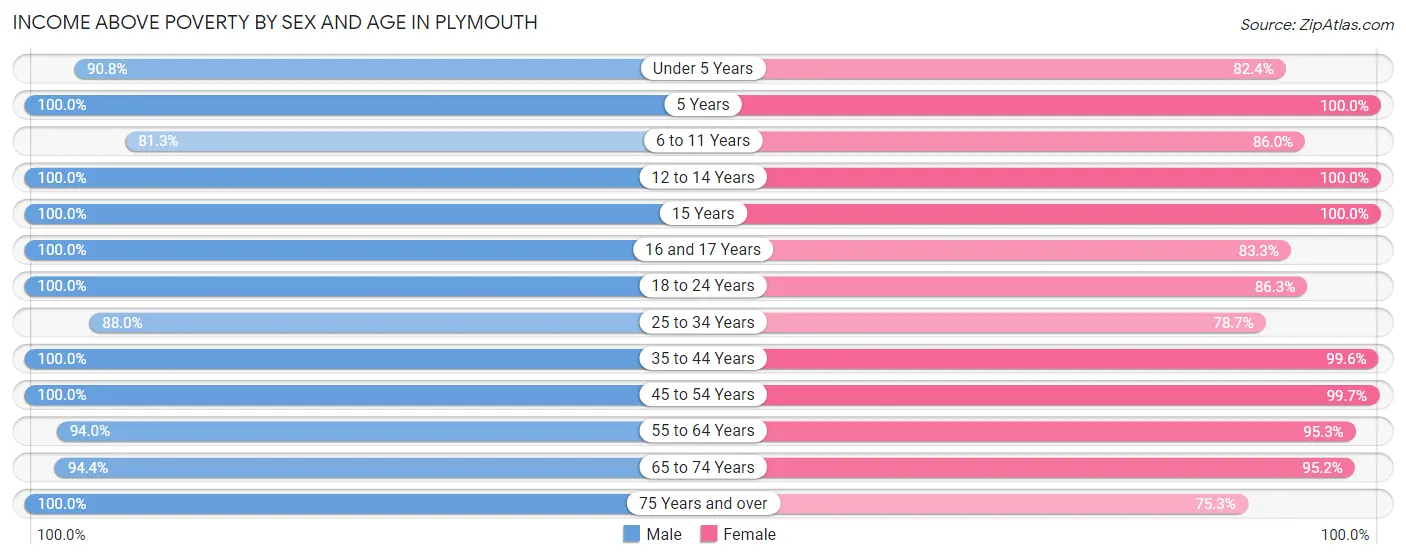
| Age Bracket | Male | Female |
| Under 5 Years | 168 (90.8%) | 224 (82.4%) |
| 5 Years | 48 (100.0%) | 23 (100.0%) |
| 6 to 11 Years | 222 (81.3%) | 343 (86.0%) |
| 12 to 14 Years | 188 (100.0%) | 122 (100.0%) |
| 15 Years | 49 (100.0%) | 87 (100.0%) |
| 16 and 17 Years | 91 (100.0%) | 55 (83.3%) |
| 18 to 24 Years | 371 (100.0%) | 278 (86.3%) |
| 25 to 34 Years | 681 (88.0%) | 291 (78.6%) |
| 35 to 44 Years | 352 (100.0%) | 496 (99.6%) |
| 45 to 54 Years | 467 (100.0%) | 580 (99.7%) |
| 55 to 64 Years | 504 (94.0%) | 735 (95.3%) |
| 65 to 74 Years | 605 (94.4%) | 612 (95.2%) |
| 75 Years and over | 156 (100.0%) | 381 (75.3%) |
| Total | 3,902 (94.5%) | 4,227 (90.7%) |
Income Below Poverty Among Married-Couple Families in Plymouth
The poverty statistics for married-couple families in Plymouth show that 2.1% or 38 of the total 1,792 families live below the poverty line. Families with 3 or 4 children have the highest poverty rate of 12.0%, comprising of 18 families. On the other hand, families with no children have the lowest poverty rate of 0.0%, which includes 0 families.
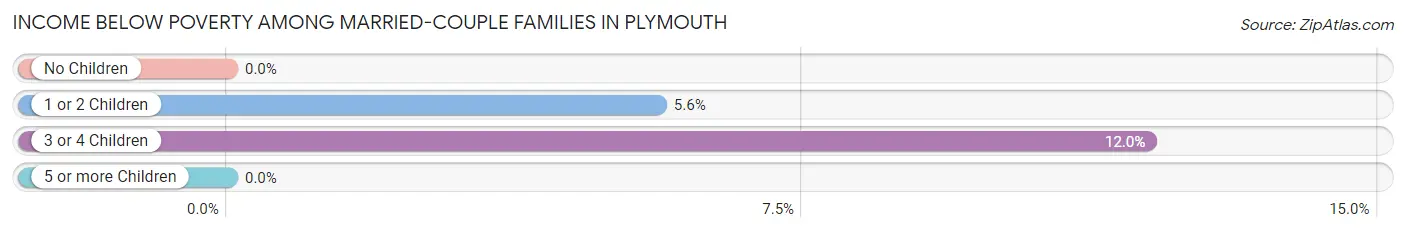
| Children | Above Poverty | Below Poverty |
| No Children | 1,267 (100.0%) | 0 (0.0%) |
| 1 or 2 Children | 337 (94.4%) | 20 (5.6%) |
| 3 or 4 Children | 132 (88.0%) | 18 (12.0%) |
| 5 or more Children | 18 (100.0%) | 0 (0.0%) |
| Total | 1,754 (97.9%) | 38 (2.1%) |
Income Below Poverty Among Single-Parent Households in Plymouth
| Children | Single Father | Single Mother |
| No Children | 0 (0.0%) | 26 (29.9%) |
| 1 or 2 Children | 0 (0.0%) | 31 (15.7%) |
| 3 or 4 Children | 0 (0.0%) | 11 (25.6%) |
| 5 or more Children | 0 (0.0%) | 0 (0.0%) |
| Total | 0 (0.0%) | 68 (20.8%) |
Income Below Poverty Among Married-Couple vs Single-Parent Households in Plymouth
The poverty data for Plymouth shows that 38 of the married-couple family households (2.1%) and 68 of the single-parent households (17.0%) are living below the poverty level. Within the married-couple family households, those with 3 or 4 children have the highest poverty rate, with 18 households (12.0%) falling below the poverty line. Among the single-parent households, those with 3 or 4 children have the highest poverty rate, with 11 household (25.6%) living below poverty.
| Children | Married-Couple Families | Single-Parent Households |
| No Children | 0 (0.0%) | 26 (23.0%) |
| 1 or 2 Children | 20 (5.6%) | 31 (12.8%) |
| 3 or 4 Children | 18 (12.0%) | 11 (25.6%) |
| 5 or more Children | 0 (0.0%) | 0 (0.0%) |
| Total | 38 (2.1%) | 68 (17.0%) |
Race in Plymouth
The most populous races in Plymouth are White / Caucasian (8,495 | 95.4%), Two or more Races (251 | 2.8%), and Hispanic or Latino (198 | 2.2%).
| Race | # Population | % Population |
| Asian | 55 | 0.6% |
| Black / African American | 85 | 0.9% |
| Hawaiian / Pacific | 0 | 0.0% |
| Hispanic or Latino | 198 | 2.2% |
| Native / Alaskan | 0 | 0.0% |
| White / Caucasian | 8,495 | 95.4% |
| Two or more Races | 251 | 2.8% |
| Some other Race | 21 | 0.2% |
| Total | 8,907 | 100.0% |
Ancestry in Plymouth
The most populous ancestries reported in Plymouth are German (5,025 | 56.4%), Irish (1,031 | 11.6%), English (455 | 5.1%), American (341 | 3.8%), and Polish (331 | 3.7%), together accounting for 80.7% of all Plymouth residents.
| Ancestry | # Population | % Population |
| American | 341 | 3.8% |
| Austrian | 47 | 0.5% |
| Belgian | 45 | 0.5% |
| British | 18 | 0.2% |
| Canadian | 18 | 0.2% |
| Croatian | 9 | 0.1% |
| Cuban | 3 | 0.0% |
| Czech | 134 | 1.5% |
| Czechoslovakian | 34 | 0.4% |
| Danish | 56 | 0.6% |
| Dutch | 299 | 3.4% |
| Eastern European | 98 | 1.1% |
| English | 455 | 5.1% |
| European | 117 | 1.3% |
| Finnish | 29 | 0.3% |
| French | 211 | 2.4% |
| French Canadian | 51 | 0.6% |
| German | 5,025 | 56.4% |
| Greek | 17 | 0.2% |
| Hungarian | 79 | 0.9% |
| Irish | 1,031 | 11.6% |
| Italian | 191 | 2.1% |
| Korean | 7 | 0.1% |
| Laotian | 44 | 0.5% |
| Lithuanian | 6 | 0.1% |
| Luxembourger | 11 | 0.1% |
| Mexican | 174 | 1.9% |
| Norwegian | 283 | 3.2% |
| Polish | 331 | 3.7% |
| Russian | 317 | 3.6% |
| Scandinavian | 35 | 0.4% |
| Scotch-Irish | 10 | 0.1% |
| Scottish | 21 | 0.2% |
| Serbian | 7 | 0.1% |
| Slovak | 36 | 0.4% |
| Spanish | 7 | 0.1% |
| Sri Lankan | 11 | 0.1% |
| Swedish | 202 | 2.3% |
| Swiss | 48 | 0.5% |
| Ukrainian | 9 | 0.1% | View All 40 Rows |
Immigrants in Plymouth
The most numerous immigrant groups reported in Plymouth came from Europe (81 | 0.9%), England (47 | 0.5%), Northern Europe (47 | 0.5%), Asia (44 | 0.5%), and Indonesia (44 | 0.5%), together accounting for 2.9% of all Plymouth residents.
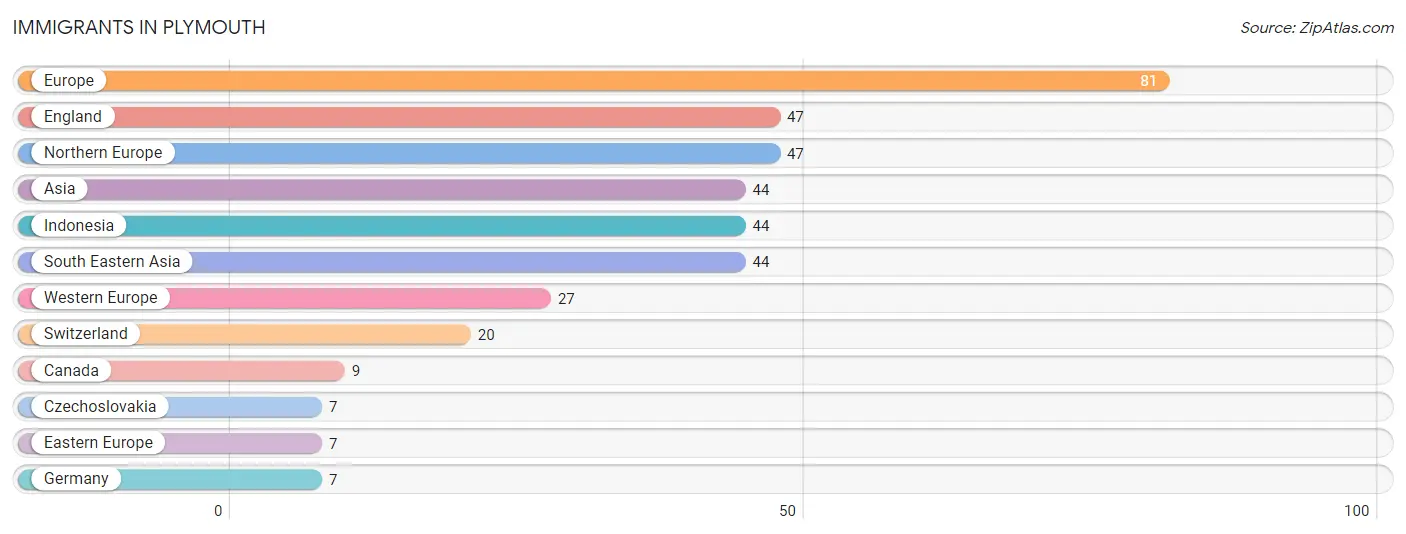
| Immigration Origin | # Population | % Population |
| Asia | 44 | 0.5% |
| Canada | 9 | 0.1% |
| Czechoslovakia | 7 | 0.1% |
| Eastern Europe | 7 | 0.1% |
| England | 47 | 0.5% |
| Europe | 81 | 0.9% |
| Germany | 7 | 0.1% |
| Indonesia | 44 | 0.5% |
| Northern Europe | 47 | 0.5% |
| South Eastern Asia | 44 | 0.5% |
| Switzerland | 20 | 0.2% |
| Western Europe | 27 | 0.3% | View All 12 Rows |
Sex and Age in Plymouth
Sex and Age in Plymouth
The most populous age groups in Plymouth are 25 to 29 Years (529 | 12.7%) for men and 60 to 64 Years (470 | 10.0%) for women.
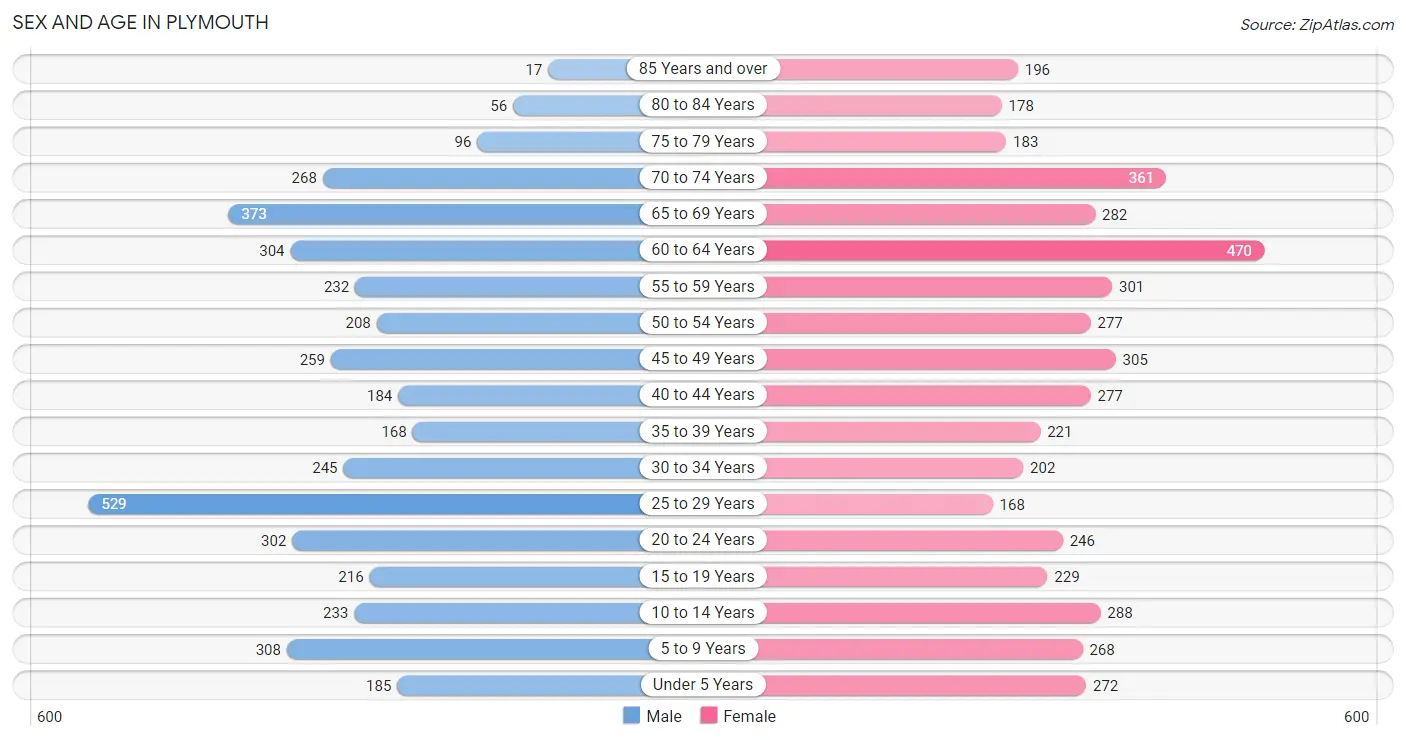
| Age Bracket | Male | Female |
| Under 5 Years | 185 (4.4%) | 272 (5.8%) |
| 5 to 9 Years | 308 (7.4%) | 268 (5.7%) |
| 10 to 14 Years | 233 (5.6%) | 288 (6.1%) |
| 15 to 19 Years | 216 (5.2%) | 229 (4.9%) |
| 20 to 24 Years | 302 (7.2%) | 246 (5.2%) |
| 25 to 29 Years | 529 (12.7%) | 168 (3.6%) |
| 30 to 34 Years | 245 (5.9%) | 202 (4.3%) |
| 35 to 39 Years | 168 (4.0%) | 221 (4.7%) |
| 40 to 44 Years | 184 (4.4%) | 277 (5.9%) |
| 45 to 49 Years | 259 (6.2%) | 305 (6.5%) |
| 50 to 54 Years | 208 (5.0%) | 277 (5.9%) |
| 55 to 59 Years | 232 (5.6%) | 301 (6.4%) |
| 60 to 64 Years | 304 (7.3%) | 470 (10.0%) |
| 65 to 69 Years | 373 (8.9%) | 282 (6.0%) |
| 70 to 74 Years | 268 (6.4%) | 361 (7.6%) |
| 75 to 79 Years | 96 (2.3%) | 183 (3.9%) |
| 80 to 84 Years | 56 (1.3%) | 178 (3.8%) |
| 85 Years and over | 17 (0.4%) | 196 (4.2%) |
| Total | 4,183 (100.0%) | 4,724 (100.0%) |
Families and Households in Plymouth
Median Family Size in Plymouth
The median family size in Plymouth is 2.97 persons per family, with married-couple families (1,792 | 81.8%) accounting for the largest median family size of 3 persons per family. On the other hand, single male/father families (72 | 3.3%) represent the smallest median family size with 2.04 persons per family.
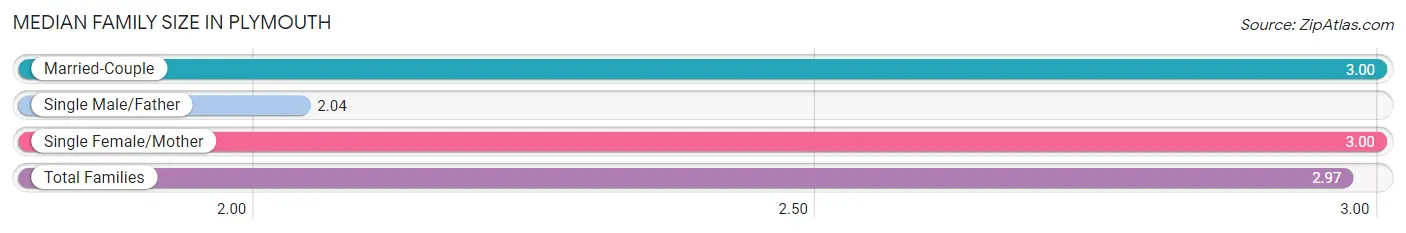
| Family Type | # Families | Family Size |
| Married-Couple | 1,792 (81.8%) | 3.00 |
| Single Male/Father | 72 (3.3%) | 2.04 |
| Single Female/Mother | 327 (14.9%) | 3.00 |
| Total Families | 2,191 (100.0%) | 2.97 |
Median Household Size in Plymouth
The median household size in Plymouth is 2.20 persons per household, with single female/mother households (327 | 8.2%) accounting for the largest median household size of 3.22 persons per household. non-family households (1,820 | 45.4%) represent the smallest median household size with 1.22 persons per household.
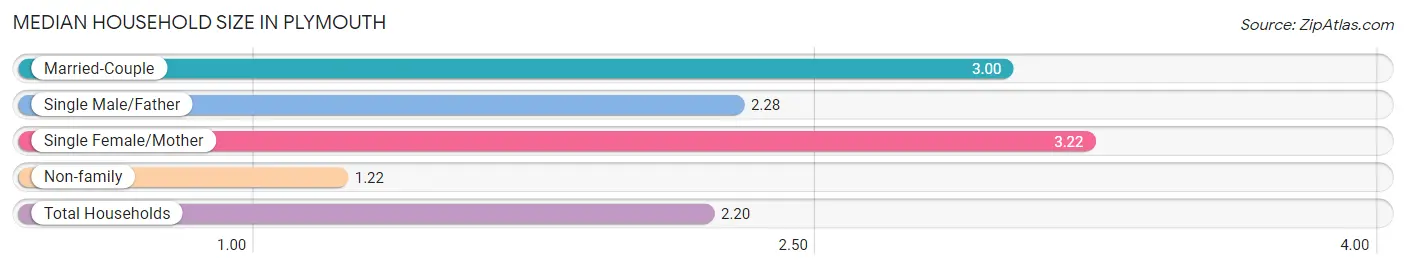
| Household Type | # Households | Household Size |
| Married-Couple | 1,792 (44.7%) | 3.00 |
| Single Male/Father | 72 (1.8%) | 2.28 |
| Single Female/Mother | 327 (8.2%) | 3.22 |
| Non-family | 1,820 (45.4%) | 1.22 |
| Total Households | 4,011 (100.0%) | 2.20 |
Household Size by Marriage Status in Plymouth
Out of a total of 4,011 households in Plymouth, 2,191 (54.6%) are family households, while 1,820 (45.4%) are nonfamily households. The most numerous type of family households are 2-person households, comprising 1,227, and the most common type of nonfamily households are 1-person households, comprising 1,530.
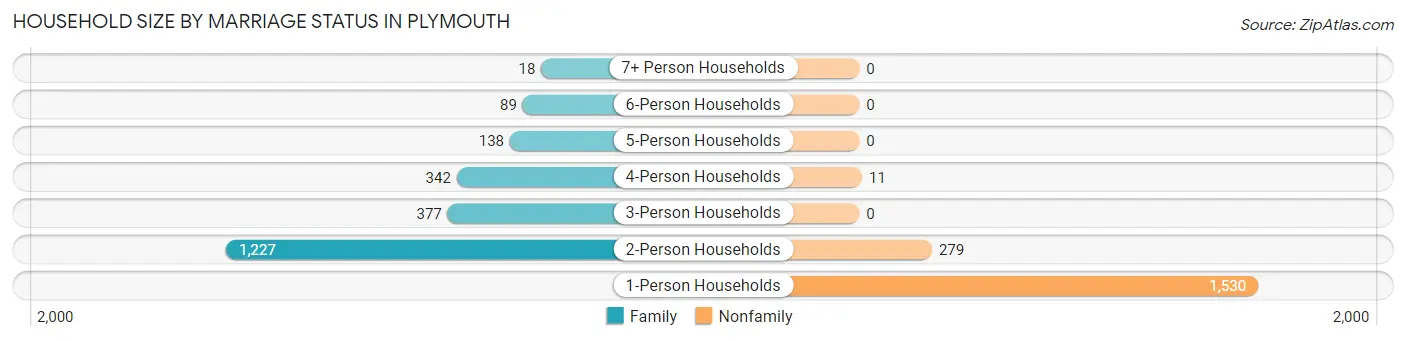
| Household Size | Family Households | Nonfamily Households |
| 1-Person Households | - | 1,530 (38.2%) |
| 2-Person Households | 1,227 (30.6%) | 279 (7.0%) |
| 3-Person Households | 377 (9.4%) | 0 (0.0%) |
| 4-Person Households | 342 (8.5%) | 11 (0.3%) |
| 5-Person Households | 138 (3.4%) | 0 (0.0%) |
| 6-Person Households | 89 (2.2%) | 0 (0.0%) |
| 7+ Person Households | 18 (0.4%) | 0 (0.0%) |
| Total | 2,191 (54.6%) | 1,820 (45.4%) |
Female Fertility in Plymouth
Fertility by Age in Plymouth
Average fertility rate in Plymouth is 63.0 births per 1,000 women. Women in the age bracket of 20 to 34 years have the highest fertility rate with 135.0 births per 1,000 women. Women in the age bracket of 20 to 34 years acount for 79.0% of all women with births.
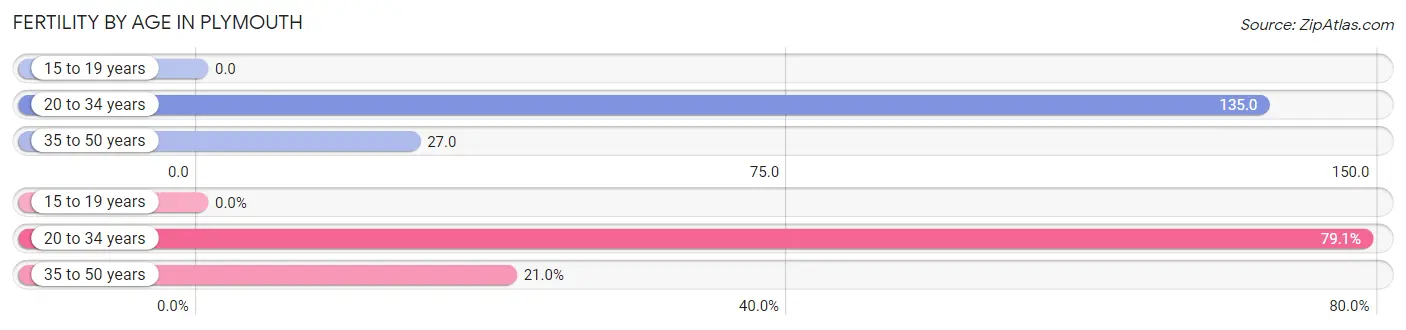
| Age Bracket | Women with Births | Births / 1,000 Women |
| 15 to 19 years | 0 (0.0%) | 0.0 |
| 20 to 34 years | 83 (79.0%) | 135.0 |
| 35 to 50 years | 22 (20.9%) | 27.0 |
| Total | 105 (100.0%) | 63.0 |
Fertility by Age by Marriage Status in Plymouth
66.7% of women with births (105) in Plymouth are married. The highest percentage of unmarried women with births falls into 35 to 50 years age bracket with 100.0% of them unmarried at the time of birth, while the lowest percentage of unmarried women with births belong to 20 to 34 years age bracket with 15.7% of them unmarried.
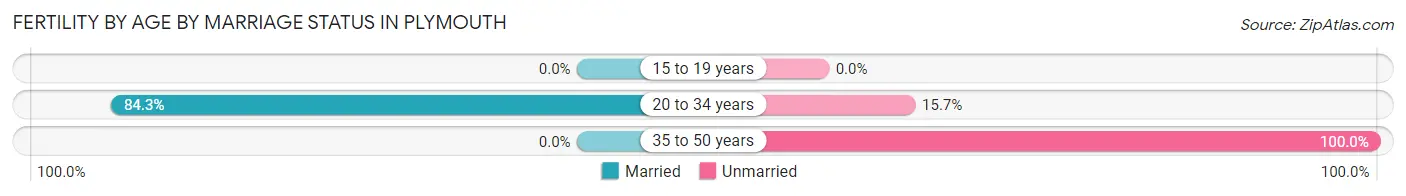
| Age Bracket | Married | Unmarried |
| 15 to 19 years | 0 (0.0%) | 0 (0.0%) |
| 20 to 34 years | 70 (84.3%) | 13 (15.7%) |
| 35 to 50 years | 0 (0.0%) | 22 (100.0%) |
| Total | 70 (66.7%) | 35 (33.3%) |
Fertility by Education in Plymouth
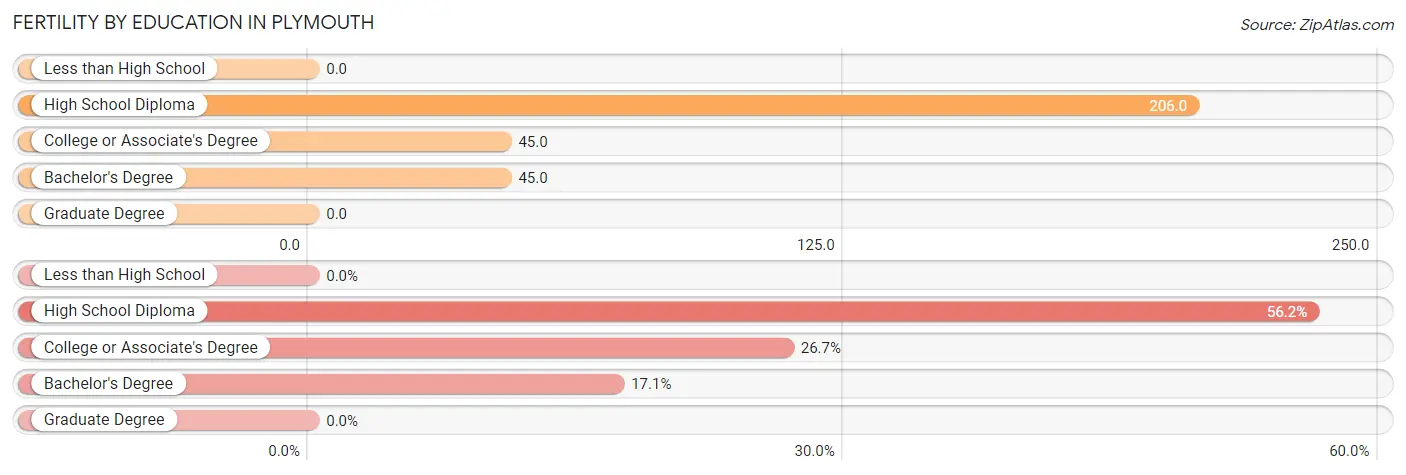
| Educational Attainment | Women with Births | Births / 1,000 Women |
| Less than High School | 0 (0.0%) | 0.0 |
| High School Diploma | 59 (56.2%) | 206.0 |
| College or Associate's Degree | 28 (26.7%) | 45.0 |
| Bachelor's Degree | 18 (17.1%) | 45.0 |
| Graduate Degree | 0 (0.0%) | 0.0 |
| Total | 105 (100.0%) | 63.0 |
Fertility by Education by Marriage Status in Plymouth
33.3% of women with births in Plymouth are unmarried. Women with the educational attainment of college or associate's degree are most likely to be married with 82.1% of them married at childbirth, while women with the educational attainment of bachelor's degree are least likely to be married with 44.4% of them unmarried at childbirth.
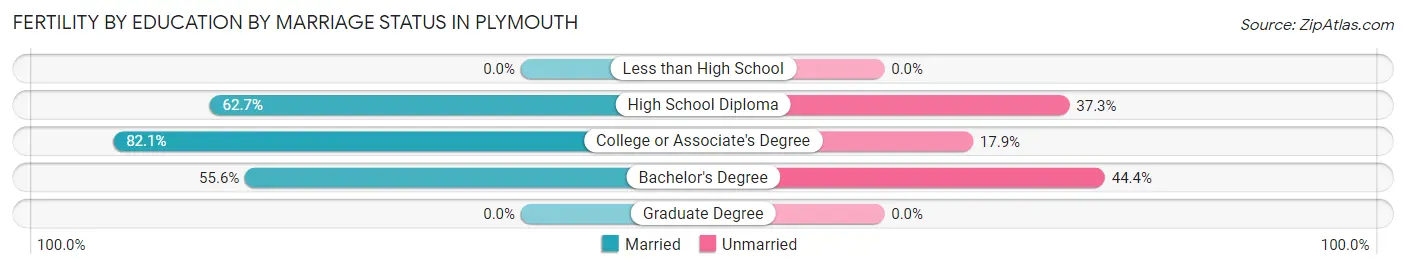
| Educational Attainment | Married | Unmarried |
| Less than High School | 0 (0.0%) | 0 (0.0%) |
| High School Diploma | 37 (62.7%) | 22 (37.3%) |
| College or Associate's Degree | 23 (82.1%) | 5 (17.9%) |
| Bachelor's Degree | 10 (55.6%) | 8 (44.4%) |
| Graduate Degree | 0 (0.0%) | 0 (0.0%) |
| Total | 70 (66.7%) | 35 (33.3%) |
Employment Characteristics in Plymouth
Employment by Class of Employer in Plymouth
Among the 4,286 employed individuals in Plymouth, private company employees (3,190 | 74.4%), local government employees (420 | 9.8%), and not-for-profit organizations (288 | 6.7%) make up the most common classes of employment.
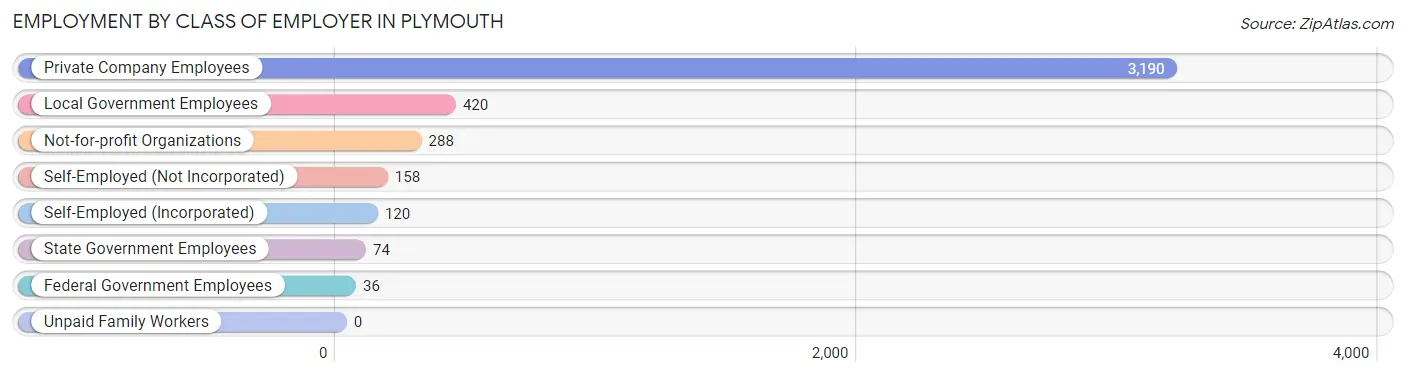
| Employer Class | # Employees | % Employees |
| Private Company Employees | 3,190 | 74.4% |
| Self-Employed (Incorporated) | 120 | 2.8% |
| Self-Employed (Not Incorporated) | 158 | 3.7% |
| Not-for-profit Organizations | 288 | 6.7% |
| Local Government Employees | 420 | 9.8% |
| State Government Employees | 74 | 1.7% |
| Federal Government Employees | 36 | 0.8% |
| Unpaid Family Workers | 0 | 0.0% |
| Total | 4,286 | 100.0% |
Employment Status by Age in Plymouth
According to the labor force statistics for Plymouth, out of the total population over 16 years of age (7,210), 63.0% or 4,542 individuals are in the labor force, with 5.1% or 232 of them unemployed. The age group with the highest labor force participation rate is 20 to 24 years, with 97.3% or 533 individuals in the labor force. Within the labor force, the 25 to 29 years age range has the highest percentage of unemployed individuals, with 30.6% or 197 of them being unemployed.
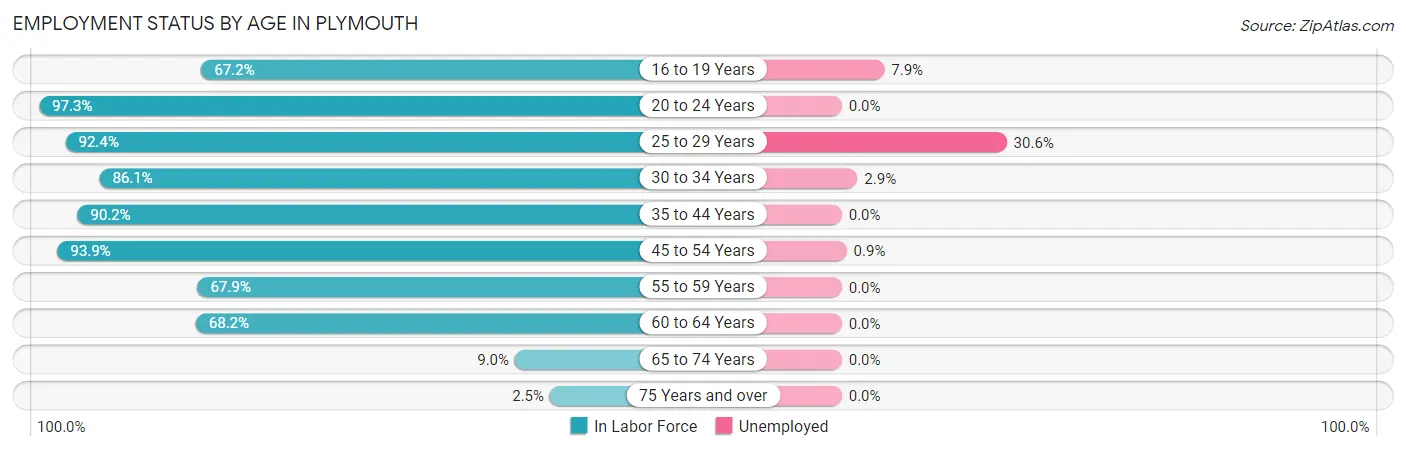
| Age Bracket | In Labor Force | Unemployed |
| 16 to 19 Years | 203 (67.2%) | 16 (7.9%) |
| 20 to 24 Years | 533 (97.3%) | 0 (0.0%) |
| 25 to 29 Years | 644 (92.4%) | 197 (30.6%) |
| 30 to 34 Years | 385 (86.1%) | 11 (2.9%) |
| 35 to 44 Years | 767 (90.2%) | 0 (0.0%) |
| 45 to 54 Years | 985 (93.9%) | 9 (0.9%) |
| 55 to 59 Years | 362 (67.9%) | 0 (0.0%) |
| 60 to 64 Years | 528 (68.2%) | 0 (0.0%) |
| 65 to 74 Years | 116 (9.0%) | 0 (0.0%) |
| 75 Years and over | 18 (2.5%) | 0 (0.0%) |
| Total | 4,542 (63.0%) | 232 (5.1%) |
Employment Status by Educational Attainment in Plymouth
According to labor force statistics for Plymouth, 84.4% of individuals (3,671) out of the total population between 25 and 64 years of age (4,350) are in the labor force, with 5.9% or 217 of them being unemployed. The group with the highest labor force participation rate are those with the educational attainment of bachelor's degree or higher, with 88.2% or 1,036 individuals in the labor force. Within the labor force, individuals with high school diploma education have the highest percentage of unemployment, with 18.9% or 197 of them being unemployed.
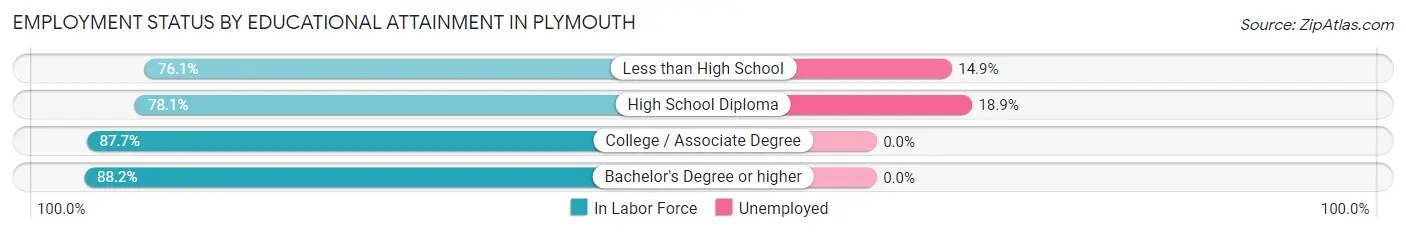
| Educational Attainment | In Labor Force | Unemployed |
| Less than High School | 134 (76.1%) | 26 (14.9%) |
| High School Diploma | 1,043 (78.1%) | 252 (18.9%) |
| College / Associate Degree | 1,459 (87.7%) | 0 (0.0%) |
| Bachelor's Degree or higher | 1,036 (88.2%) | 0 (0.0%) |
| Total | 3,671 (84.4%) | 257 (5.9%) |
Employment Occupations by Sex in Plymouth
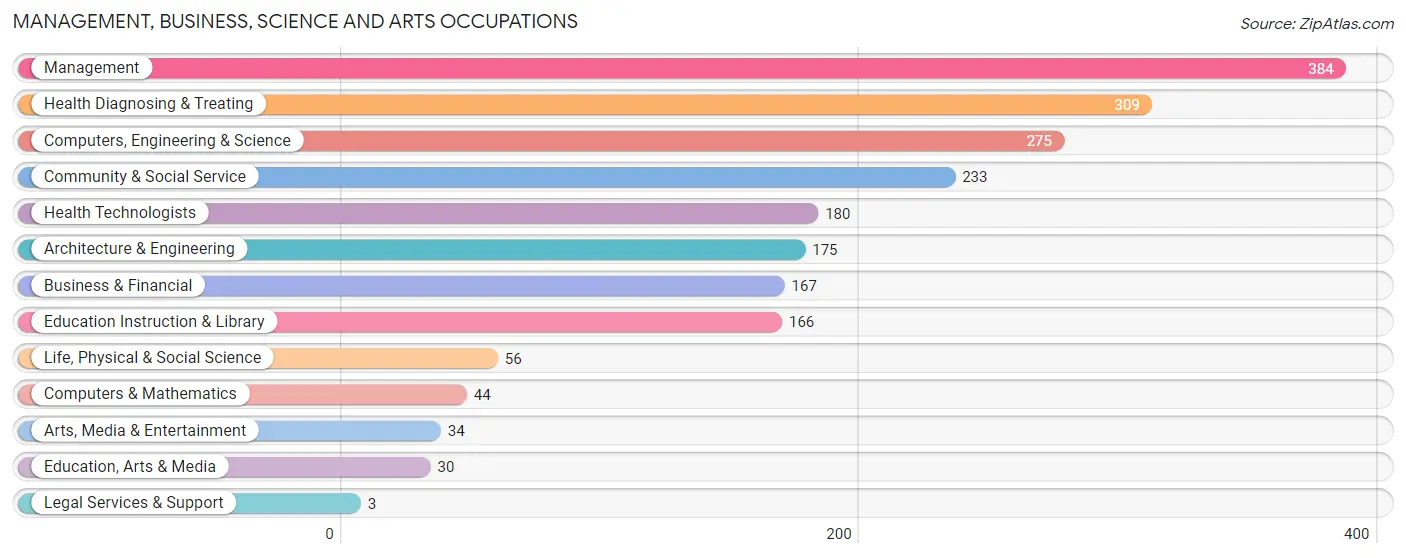
Management, Business, Science and Arts Occupations
The most common Management, Business, Science and Arts occupations in Plymouth are Management (384 | 8.9%), Health Diagnosing & Treating (309 | 7.2%), Computers, Engineering & Science (275 | 6.4%), Community & Social Service (233 | 5.4%), and Health Technologists (180 | 4.2%).
Management, Business, Science and Arts Occupations by Sex
Within the Management, Business, Science and Arts occupations in Plymouth, the most male-oriented occupations are Architecture & Engineering (92.6%), Life, Physical & Social Science (80.4%), and Computers, Engineering & Science (78.9%), while the most female-oriented occupations are Legal Services & Support (100.0%), Arts, Media & Entertainment (100.0%), and Health Technologists (100.0%).
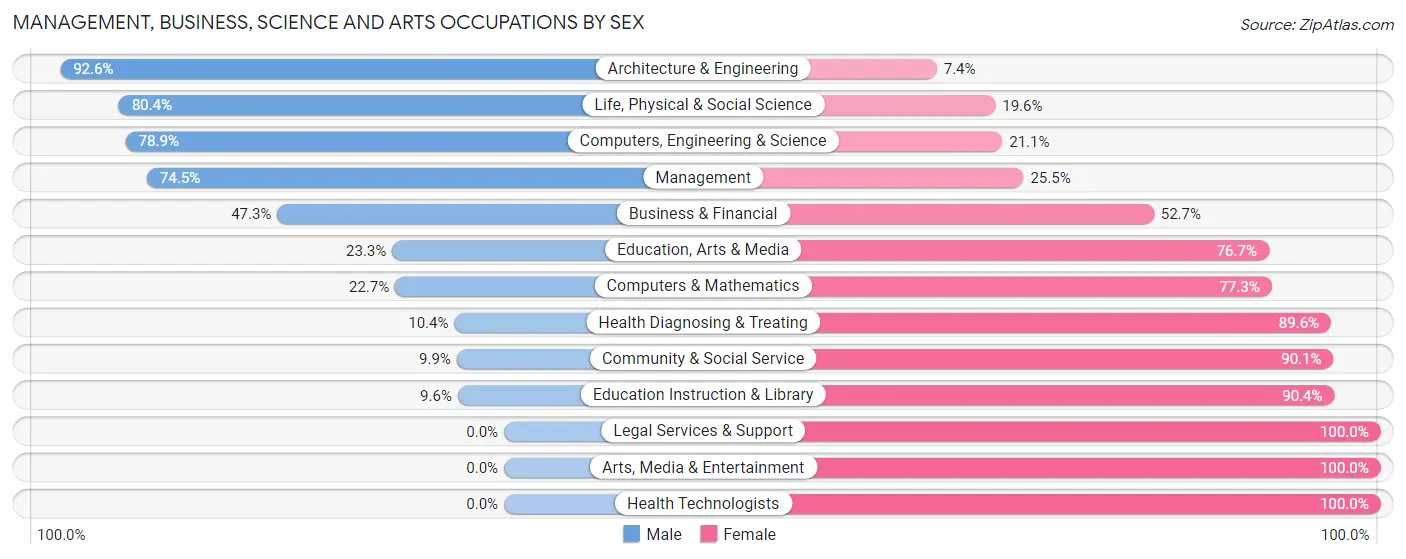
| Occupation | Male | Female |
| Management | 286 (74.5%) | 98 (25.5%) |
| Business & Financial | 79 (47.3%) | 88 (52.7%) |
| Computers, Engineering & Science | 217 (78.9%) | 58 (21.1%) |
| Computers & Mathematics | 10 (22.7%) | 34 (77.3%) |
| Architecture & Engineering | 162 (92.6%) | 13 (7.4%) |
| Life, Physical & Social Science | 45 (80.4%) | 11 (19.6%) |
| Community & Social Service | 23 (9.9%) | 210 (90.1%) |
| Education, Arts & Media | 7 (23.3%) | 23 (76.7%) |
| Legal Services & Support | 0 (0.0%) | 3 (100.0%) |
| Education Instruction & Library | 16 (9.6%) | 150 (90.4%) |
| Arts, Media & Entertainment | 0 (0.0%) | 34 (100.0%) |
| Health Diagnosing & Treating | 32 (10.4%) | 277 (89.6%) |
| Health Technologists | 0 (0.0%) | 180 (100.0%) |
| Total (Category) | 637 (46.6%) | 731 (53.4%) |
| Total (Overall) | 2,083 (48.3%) | 2,225 (51.6%) |
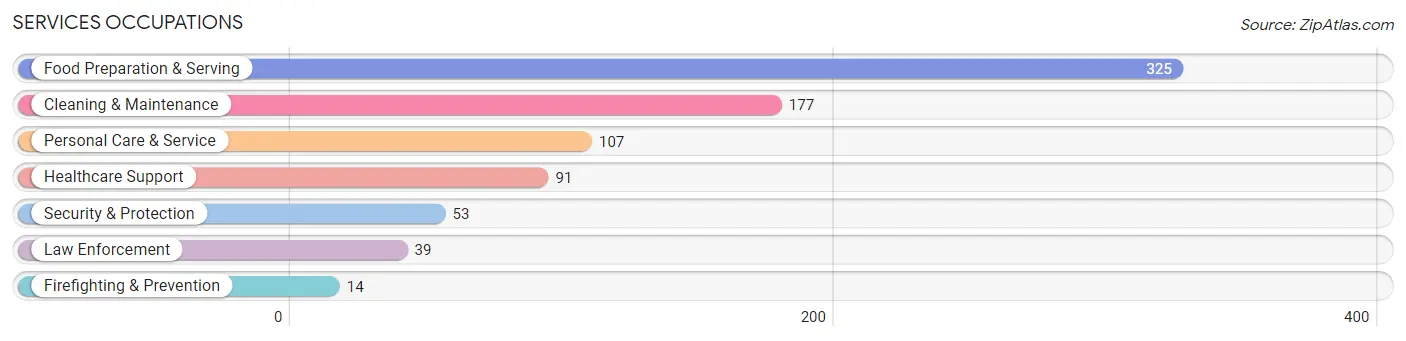
Services Occupations
The most common Services occupations in Plymouth are Food Preparation & Serving (325 | 7.5%), Cleaning & Maintenance (177 | 4.1%), Personal Care & Service (107 | 2.5%), Healthcare Support (91 | 2.1%), and Security & Protection (53 | 1.2%).
Services Occupations by Sex
Within the Services occupations in Plymouth, the most male-oriented occupations are Firefighting & Prevention (100.0%), Security & Protection (84.9%), and Law Enforcement (79.5%), while the most female-oriented occupations are Healthcare Support (100.0%), Personal Care & Service (76.6%), and Food Preparation & Serving (76.3%).
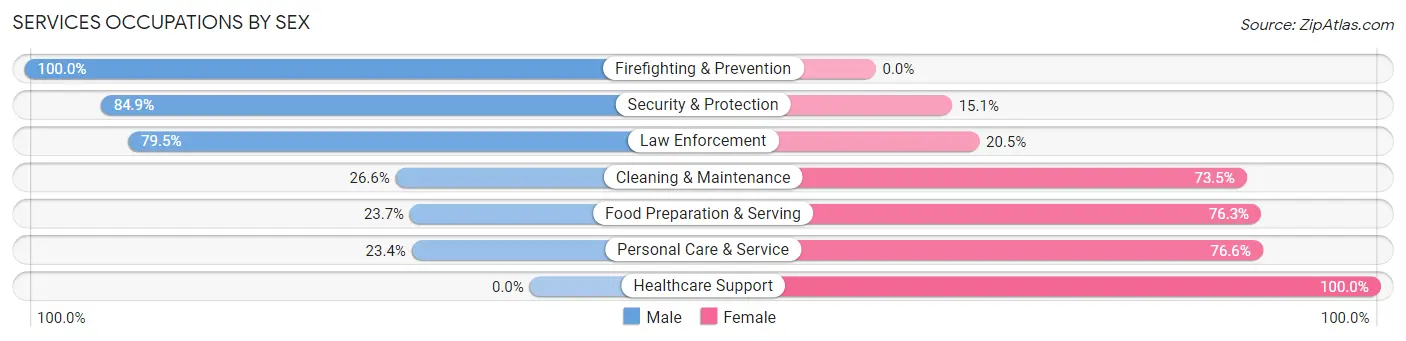
| Occupation | Male | Female |
| Healthcare Support | 0 (0.0%) | 91 (100.0%) |
| Security & Protection | 45 (84.9%) | 8 (15.1%) |
| Firefighting & Prevention | 14 (100.0%) | 0 (0.0%) |
| Law Enforcement | 31 (79.5%) | 8 (20.5%) |
| Food Preparation & Serving | 77 (23.7%) | 248 (76.3%) |
| Cleaning & Maintenance | 47 (26.6%) | 130 (73.5%) |
| Personal Care & Service | 25 (23.4%) | 82 (76.6%) |
| Total (Category) | 194 (25.8%) | 559 (74.2%) |
| Total (Overall) | 2,083 (48.3%) | 2,225 (51.6%) |
Sales and Office Occupations
The most common Sales and Office occupations in Plymouth are Office & Administration (507 | 11.8%), and Sales & Related (362 | 8.4%).
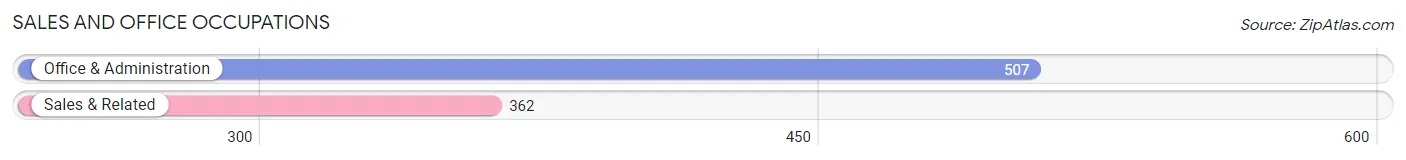
Sales and Office Occupations by Sex
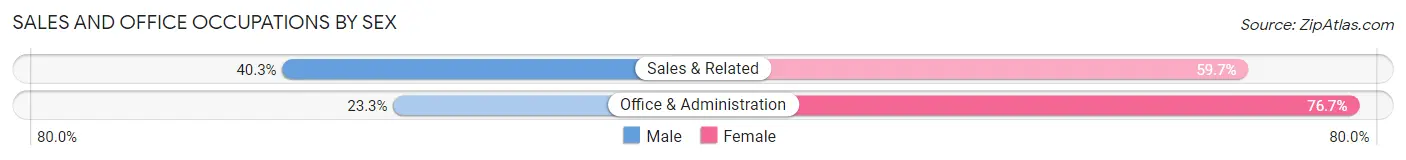
| Occupation | Male | Female |
| Sales & Related | 146 (40.3%) | 216 (59.7%) |
| Office & Administration | 118 (23.3%) | 389 (76.7%) |
| Total (Category) | 264 (30.4%) | 605 (69.6%) |
| Total (Overall) | 2,083 (48.3%) | 2,225 (51.6%) |
Natural Resources, Construction and Maintenance Occupations
The most common Natural Resources, Construction and Maintenance occupations in Plymouth are Installation, Maintenance & Repair (217 | 5.0%), Construction & Extraction (147 | 3.4%), and Farming, Fishing & Forestry (53 | 1.2%).
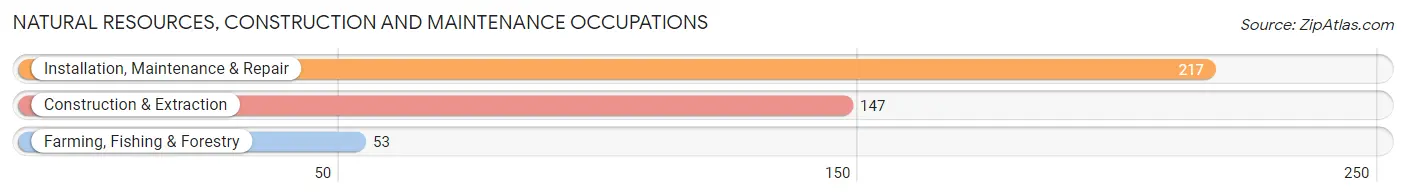
Natural Resources, Construction and Maintenance Occupations by Sex
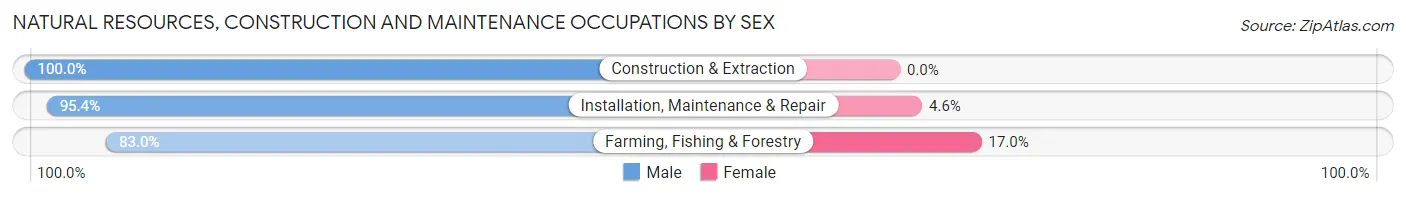
| Occupation | Male | Female |
| Farming, Fishing & Forestry | 44 (83.0%) | 9 (17.0%) |
| Construction & Extraction | 147 (100.0%) | 0 (0.0%) |
| Installation, Maintenance & Repair | 207 (95.4%) | 10 (4.6%) |
| Total (Category) | 398 (95.4%) | 19 (4.6%) |
| Total (Overall) | 2,083 (48.3%) | 2,225 (51.6%) |
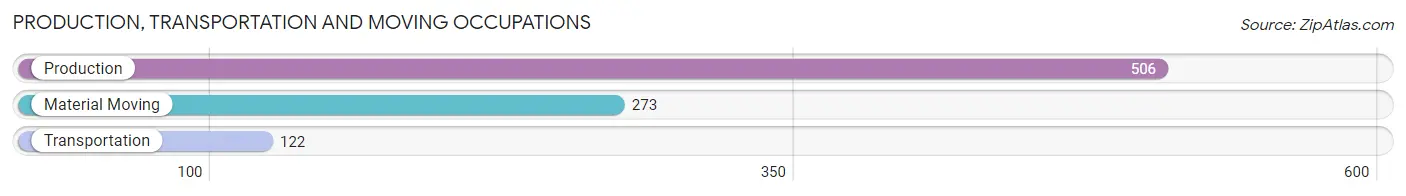
Production, Transportation and Moving Occupations
The most common Production, Transportation and Moving occupations in Plymouth are Production (506 | 11.7%), Material Moving (273 | 6.3%), and Transportation (122 | 2.8%).
Production, Transportation and Moving Occupations by Sex
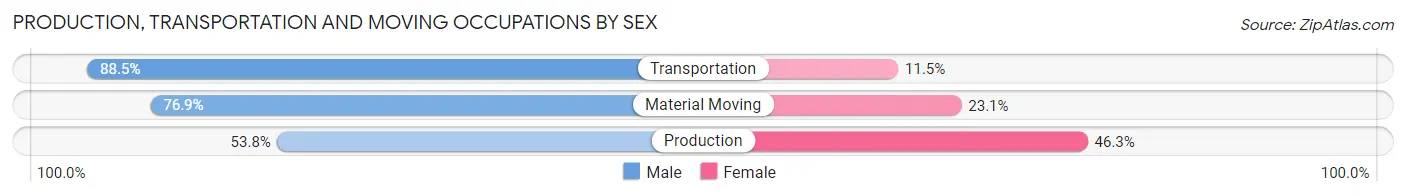
| Occupation | Male | Female |
| Production | 272 (53.7%) | 234 (46.3%) |
| Transportation | 108 (88.5%) | 14 (11.5%) |
| Material Moving | 210 (76.9%) | 63 (23.1%) |
| Total (Category) | 590 (65.5%) | 311 (34.5%) |
| Total (Overall) | 2,083 (48.3%) | 2,225 (51.6%) |
Employment Industries by Sex in Plymouth
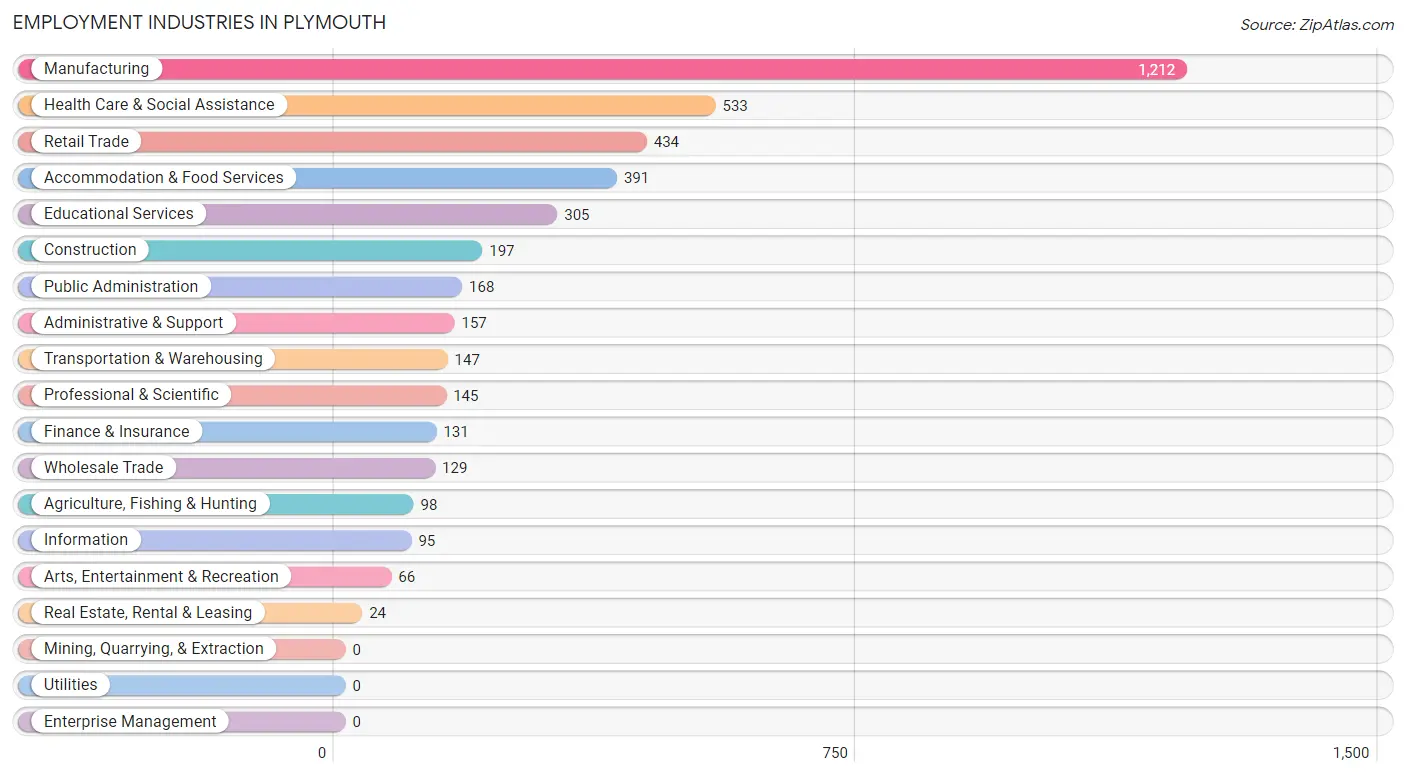
Employment Industries in Plymouth
The major employment industries in Plymouth include Manufacturing (1,212 | 28.1%), Health Care & Social Assistance (533 | 12.4%), Retail Trade (434 | 10.1%), Accommodation & Food Services (391 | 9.1%), and Educational Services (305 | 7.1%).
Employment Industries by Sex in Plymouth
The Plymouth industries that see more men than women are Agriculture, Fishing & Hunting (100.0%), Construction (95.4%), and Information (90.5%), whereas the industries that tend to have a higher number of women are Real Estate, Rental & Leasing (100.0%), Health Care & Social Assistance (90.8%), and Educational Services (83.9%).
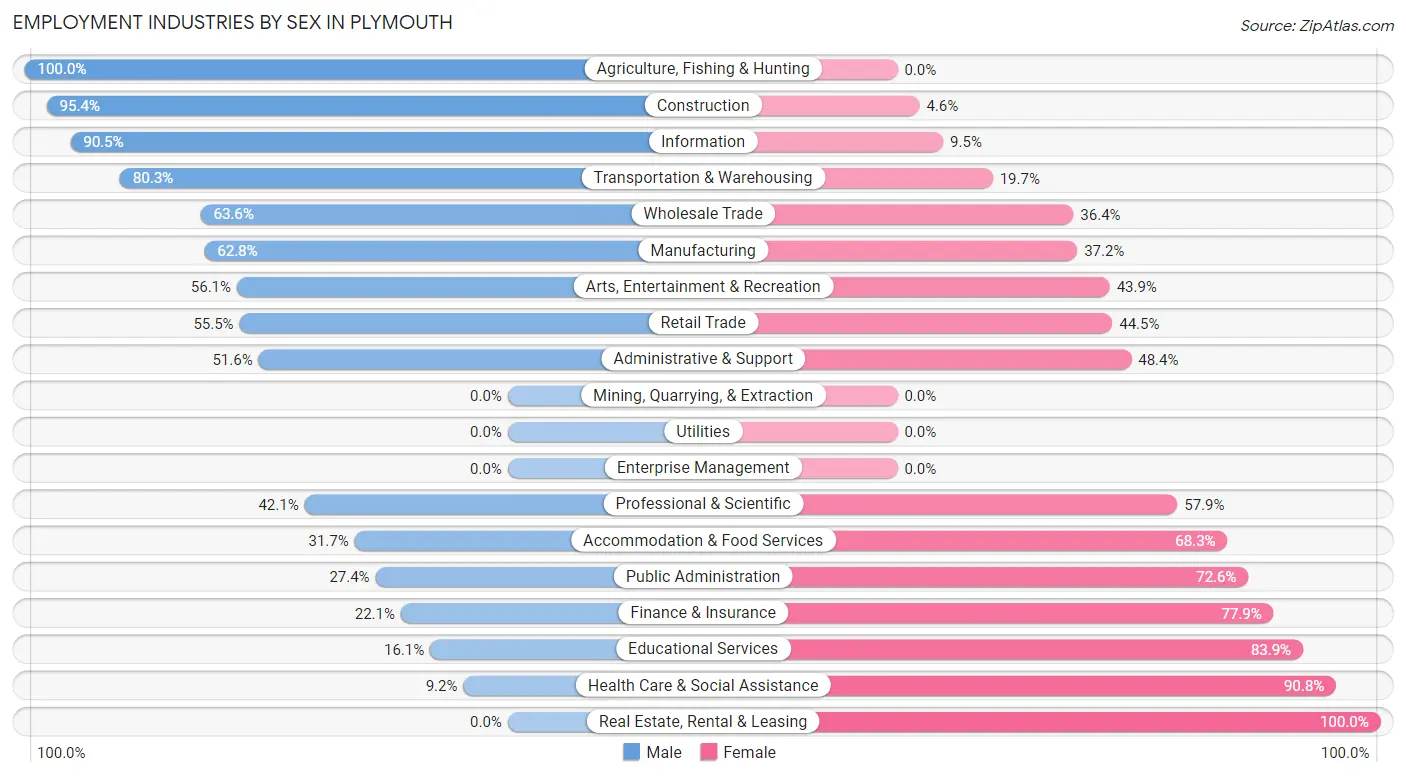
| Industry | Male | Female |
| Agriculture, Fishing & Hunting | 98 (100.0%) | 0 (0.0%) |
| Mining, Quarrying, & Extraction | 0 (0.0%) | 0 (0.0%) |
| Construction | 188 (95.4%) | 9 (4.6%) |
| Manufacturing | 761 (62.8%) | 451 (37.2%) |
| Wholesale Trade | 82 (63.6%) | 47 (36.4%) |
| Retail Trade | 241 (55.5%) | 193 (44.5%) |
| Transportation & Warehousing | 118 (80.3%) | 29 (19.7%) |
| Utilities | 0 (0.0%) | 0 (0.0%) |
| Information | 86 (90.5%) | 9 (9.5%) |
| Finance & Insurance | 29 (22.1%) | 102 (77.9%) |
| Real Estate, Rental & Leasing | 0 (0.0%) | 24 (100.0%) |
| Professional & Scientific | 61 (42.1%) | 84 (57.9%) |
| Enterprise Management | 0 (0.0%) | 0 (0.0%) |
| Administrative & Support | 81 (51.6%) | 76 (48.4%) |
| Educational Services | 49 (16.1%) | 256 (83.9%) |
| Health Care & Social Assistance | 49 (9.2%) | 484 (90.8%) |
| Arts, Entertainment & Recreation | 37 (56.1%) | 29 (43.9%) |
| Accommodation & Food Services | 124 (31.7%) | 267 (68.3%) |
| Public Administration | 46 (27.4%) | 122 (72.6%) |
| Total | 2,083 (48.3%) | 2,225 (51.6%) |
Education in Plymouth
School Enrollment in Plymouth
The most common levels of schooling among the 1,697 students in Plymouth are middle school (416 | 24.5%), elementary school (413 | 24.3%), and high school (392 | 23.1%).
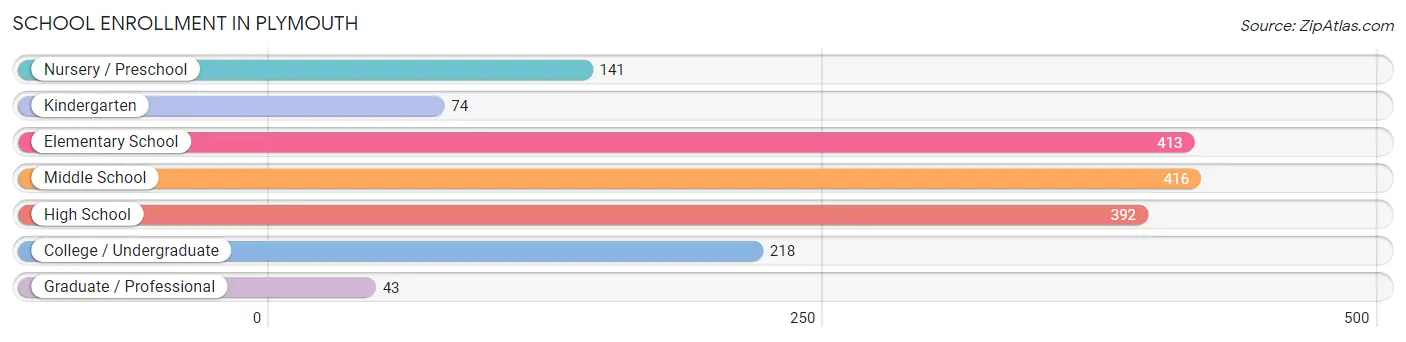
| School Level | # Students | % Students |
| Nursery / Preschool | 141 | 8.3% |
| Kindergarten | 74 | 4.4% |
| Elementary School | 413 | 24.3% |
| Middle School | 416 | 24.5% |
| High School | 392 | 23.1% |
| College / Undergraduate | 218 | 12.9% |
| Graduate / Professional | 43 | 2.5% |
| Total | 1,697 | 100.0% |
School Enrollment by Age by Funding Source in Plymouth
Out of a total of 1,697 students who are enrolled in schools in Plymouth, 365 (21.5%) attend a private institution, while the remaining 1,332 (78.5%) are enrolled in public schools. The age group of 20 to 24 year olds has the highest likelihood of being enrolled in private schools, with 60 (67.4% in the age bracket) enrolled. Conversely, the age group of 18 to 19 year olds has the lowest likelihood of being enrolled in a private school, with 35 (100.0% in the age bracket) attending a public institution.
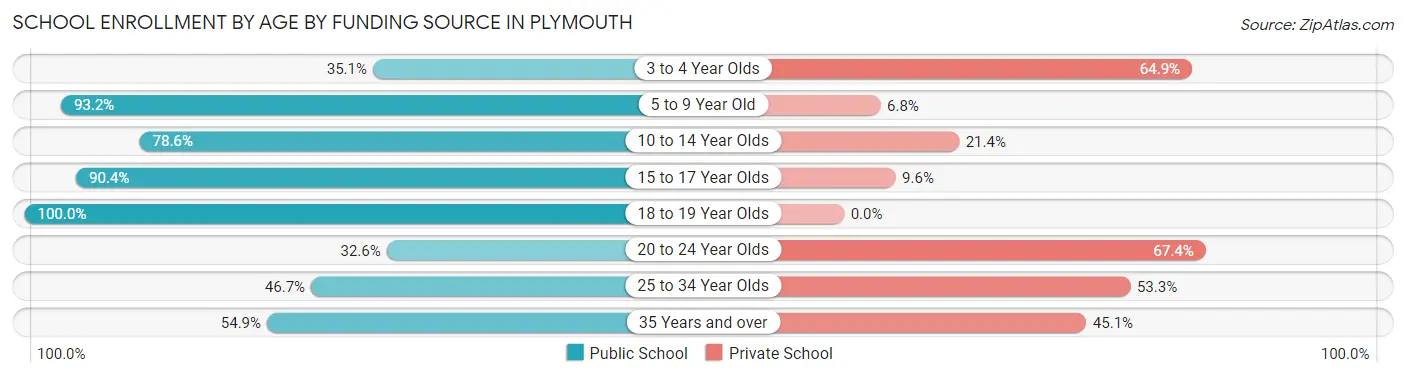
| Age Bracket | Public School | Private School |
| 3 to 4 Year Olds | 26 (35.1%) | 48 (64.9%) |
| 5 to 9 Year Old | 495 (93.2%) | 36 (6.8%) |
| 10 to 14 Year Olds | 396 (78.6%) | 108 (21.4%) |
| 15 to 17 Year Olds | 264 (90.4%) | 28 (9.6%) |
| 18 to 19 Year Olds | 35 (100.0%) | 0 (0.0%) |
| 20 to 24 Year Olds | 29 (32.6%) | 60 (67.4%) |
| 25 to 34 Year Olds | 42 (46.7%) | 48 (53.3%) |
| 35 Years and over | 45 (54.9%) | 37 (45.1%) |
| Total | 1,332 (78.5%) | 365 (21.5%) |
Educational Attainment by Field of Study in Plymouth
Business (371 | 23.7%), education (313 | 20.0%), science & technology (174 | 11.1%), social sciences (123 | 7.9%), and literature & languages (106 | 6.8%) are the most common fields of study among 1,562 individuals in Plymouth who have obtained a bachelor's degree or higher.
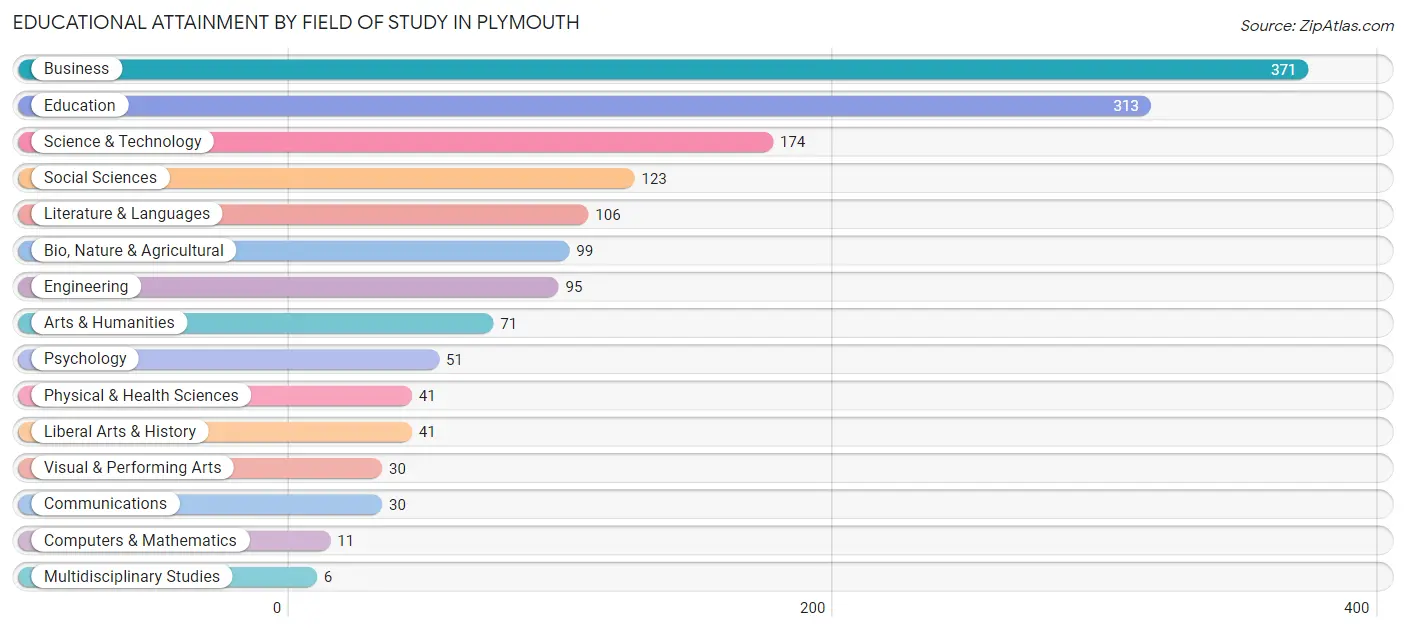
| Field of Study | # Graduates | % Graduates |
| Computers & Mathematics | 11 | 0.7% |
| Bio, Nature & Agricultural | 99 | 6.3% |
| Physical & Health Sciences | 41 | 2.6% |
| Psychology | 51 | 3.3% |
| Social Sciences | 123 | 7.9% |
| Engineering | 95 | 6.1% |
| Multidisciplinary Studies | 6 | 0.4% |
| Science & Technology | 174 | 11.1% |
| Business | 371 | 23.7% |
| Education | 313 | 20.0% |
| Literature & Languages | 106 | 6.8% |
| Liberal Arts & History | 41 | 2.6% |
| Visual & Performing Arts | 30 | 1.9% |
| Communications | 30 | 1.9% |
| Arts & Humanities | 71 | 4.5% |
| Total | 1,562 | 100.0% |
Transportation & Commute in Plymouth
Vehicle Availability by Sex in Plymouth
The most prevalent vehicle ownership categories in Plymouth are males with 2 vehicles (977, accounting for 46.9%) and females with 2 vehicles (1,220, making up 44.6%).

| Vehicles Available | Male | Female |
| No Vehicle | 64 (3.1%) | 11 (0.5%) |
| 1 Vehicle | 291 (14.0%) | 387 (17.7%) |
| 2 Vehicles | 977 (46.9%) | 1,220 (55.7%) |
| 3 Vehicles | 554 (26.6%) | 406 (18.5%) |
| 4 Vehicles | 82 (3.9%) | 40 (1.8%) |
| 5 or more Vehicles | 115 (5.5%) | 128 (5.8%) |
| Total | 2,083 (100.0%) | 2,192 (100.0%) |
Commute Time in Plymouth
The most frequently occuring commute durations in Plymouth are 5 to 9 minutes (826 commuters, 20.7%), 20 to 24 minutes (813 commuters, 20.4%), and 15 to 19 minutes (721 commuters, 18.0%).
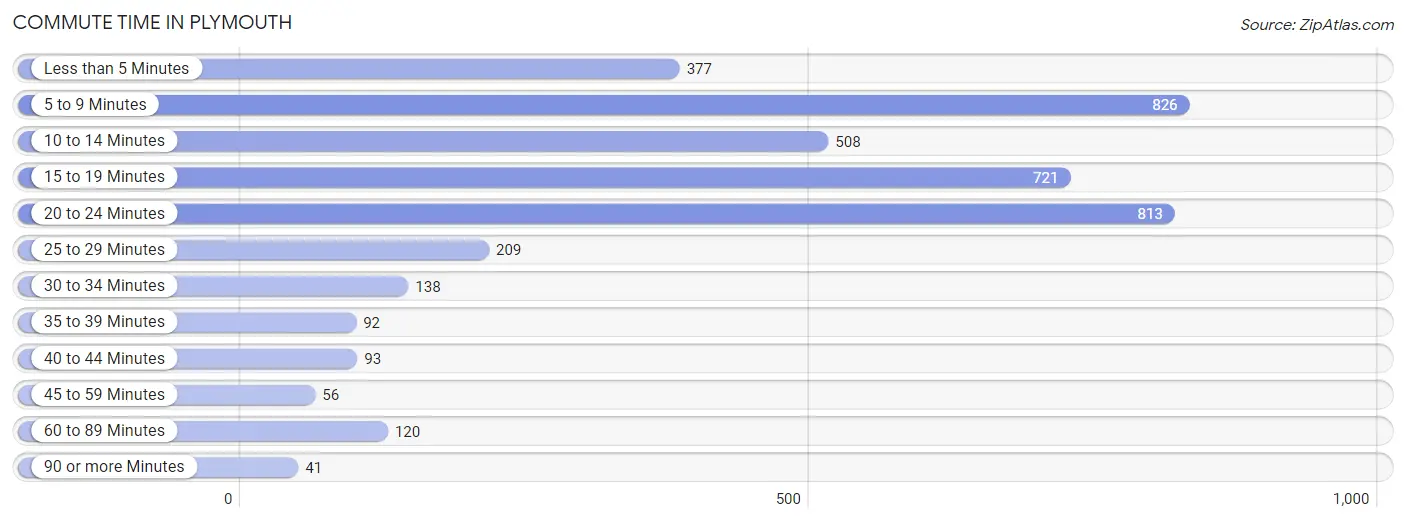
| Commute Time | # Commuters | % Commuters |
| Less than 5 Minutes | 377 | 9.4% |
| 5 to 9 Minutes | 826 | 20.7% |
| 10 to 14 Minutes | 508 | 12.7% |
| 15 to 19 Minutes | 721 | 18.0% |
| 20 to 24 Minutes | 813 | 20.4% |
| 25 to 29 Minutes | 209 | 5.2% |
| 30 to 34 Minutes | 138 | 3.5% |
| 35 to 39 Minutes | 92 | 2.3% |
| 40 to 44 Minutes | 93 | 2.3% |
| 45 to 59 Minutes | 56 | 1.4% |
| 60 to 89 Minutes | 120 | 3.0% |
| 90 or more Minutes | 41 | 1.0% |
Commute Time by Sex in Plymouth
The most common commute times in Plymouth are 15 to 19 minutes (430 commuters, 21.6%) for males and 5 to 9 minutes (517 commuters, 25.8%) for females.
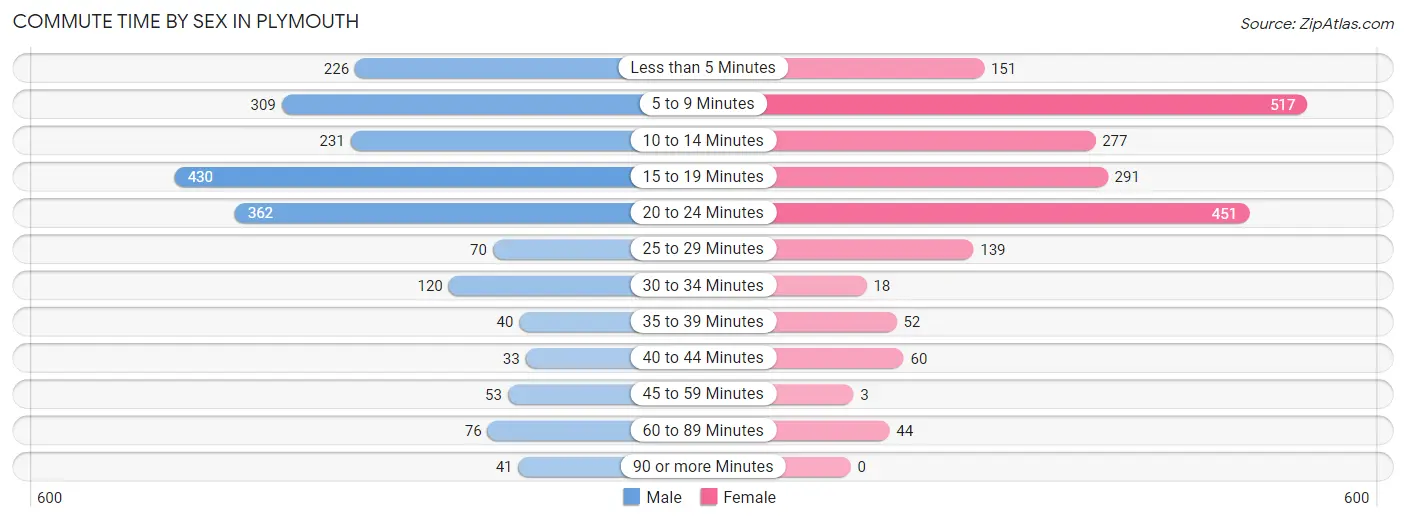
| Commute Time | Male | Female |
| Less than 5 Minutes | 226 (11.4%) | 151 (7.5%) |
| 5 to 9 Minutes | 309 (15.5%) | 517 (25.8%) |
| 10 to 14 Minutes | 231 (11.6%) | 277 (13.8%) |
| 15 to 19 Minutes | 430 (21.6%) | 291 (14.5%) |
| 20 to 24 Minutes | 362 (18.2%) | 451 (22.5%) |
| 25 to 29 Minutes | 70 (3.5%) | 139 (6.9%) |
| 30 to 34 Minutes | 120 (6.0%) | 18 (0.9%) |
| 35 to 39 Minutes | 40 (2.0%) | 52 (2.6%) |
| 40 to 44 Minutes | 33 (1.7%) | 60 (3.0%) |
| 45 to 59 Minutes | 53 (2.7%) | 3 (0.2%) |
| 60 to 89 Minutes | 76 (3.8%) | 44 (2.2%) |
| 90 or more Minutes | 41 (2.1%) | 0 (0.0%) |
Time of Departure to Work by Sex in Plymouth
The most frequent times of departure to work in Plymouth are 5:30 AM to 5:59 AM (281, 14.1%) for males and 7:00 AM to 7:29 AM (337, 16.8%) for females.
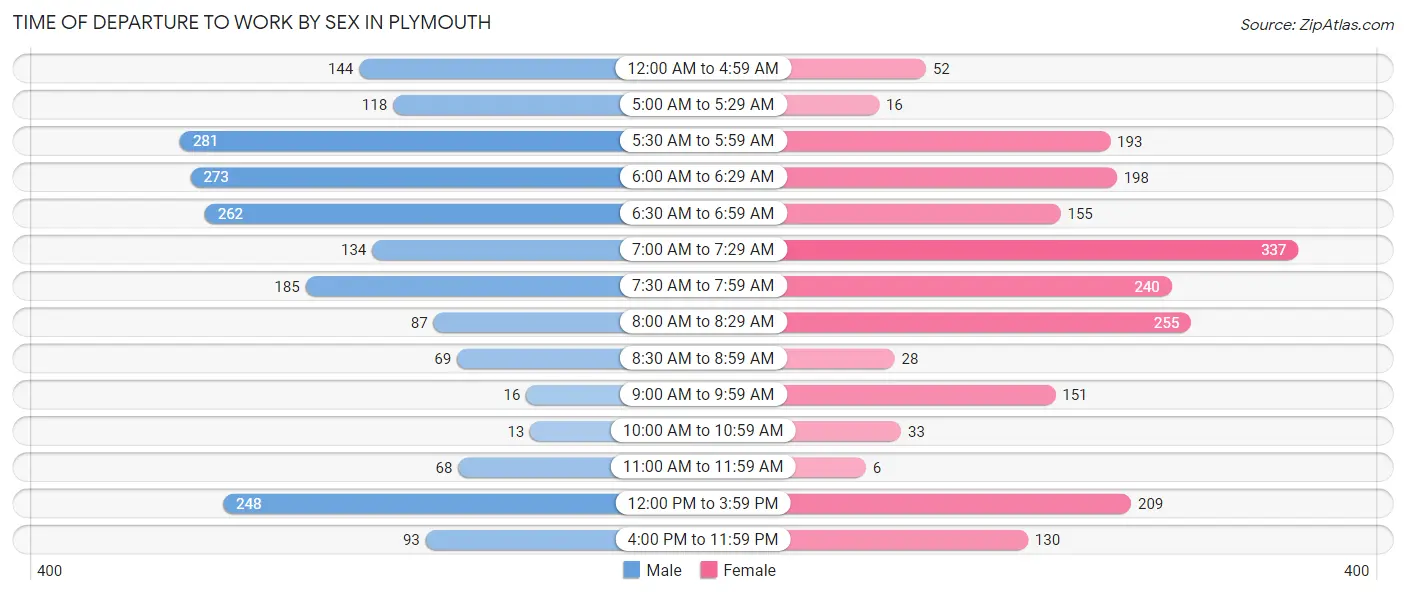
| Time of Departure | Male | Female |
| 12:00 AM to 4:59 AM | 144 (7.2%) | 52 (2.6%) |
| 5:00 AM to 5:29 AM | 118 (5.9%) | 16 (0.8%) |
| 5:30 AM to 5:59 AM | 281 (14.1%) | 193 (9.6%) |
| 6:00 AM to 6:29 AM | 273 (13.7%) | 198 (9.9%) |
| 6:30 AM to 6:59 AM | 262 (13.2%) | 155 (7.7%) |
| 7:00 AM to 7:29 AM | 134 (6.7%) | 337 (16.8%) |
| 7:30 AM to 7:59 AM | 185 (9.3%) | 240 (12.0%) |
| 8:00 AM to 8:29 AM | 87 (4.4%) | 255 (12.7%) |
| 8:30 AM to 8:59 AM | 69 (3.5%) | 28 (1.4%) |
| 9:00 AM to 9:59 AM | 16 (0.8%) | 151 (7.5%) |
| 10:00 AM to 10:59 AM | 13 (0.6%) | 33 (1.7%) |
| 11:00 AM to 11:59 AM | 68 (3.4%) | 6 (0.3%) |
| 12:00 PM to 3:59 PM | 248 (12.5%) | 209 (10.4%) |
| 4:00 PM to 11:59 PM | 93 (4.7%) | 130 (6.5%) |
| Total | 1,991 (100.0%) | 2,003 (100.0%) |
Housing Occupancy in Plymouth
Occupancy by Ownership in Plymouth
Of the total 4,011 dwellings in Plymouth, owner-occupied units account for 2,656 (66.2%), while renter-occupied units make up 1,355 (33.8%).
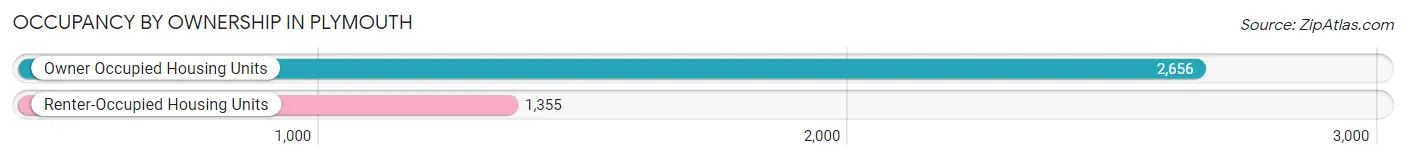
| Occupancy | # Housing Units | % Housing Units |
| Owner Occupied Housing Units | 2,656 | 66.2% |
| Renter-Occupied Housing Units | 1,355 | 33.8% |
| Total Occupied Housing Units | 4,011 | 100.0% |
Occupancy by Household Size in Plymouth
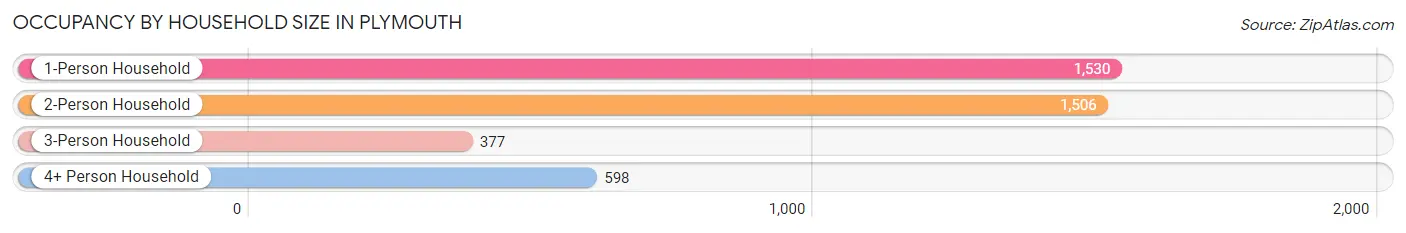
| Household Size | # Housing Units | % Housing Units |
| 1-Person Household | 1,530 | 38.2% |
| 2-Person Household | 1,506 | 37.6% |
| 3-Person Household | 377 | 9.4% |
| 4+ Person Household | 598 | 14.9% |
| Total Housing Units | 4,011 | 100.0% |
Occupancy by Ownership by Household Size in Plymouth
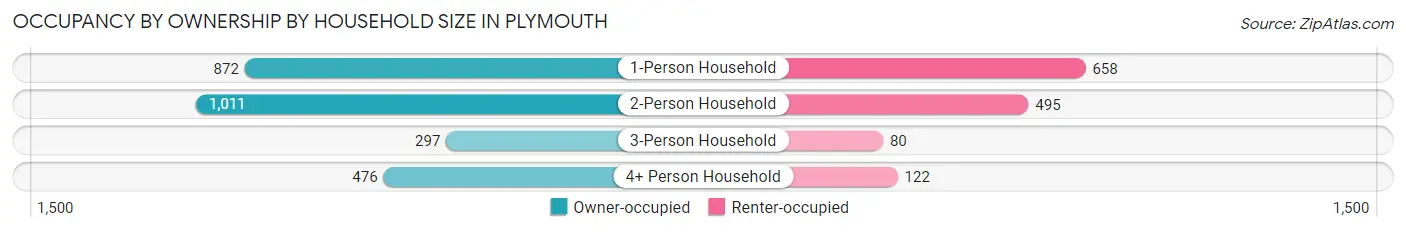
| Household Size | Owner-occupied | Renter-occupied |
| 1-Person Household | 872 (57.0%) | 658 (43.0%) |
| 2-Person Household | 1,011 (67.1%) | 495 (32.9%) |
| 3-Person Household | 297 (78.8%) | 80 (21.2%) |
| 4+ Person Household | 476 (79.6%) | 122 (20.4%) |
| Total Housing Units | 2,656 (66.2%) | 1,355 (33.8%) |
Occupancy by Educational Attainment in Plymouth
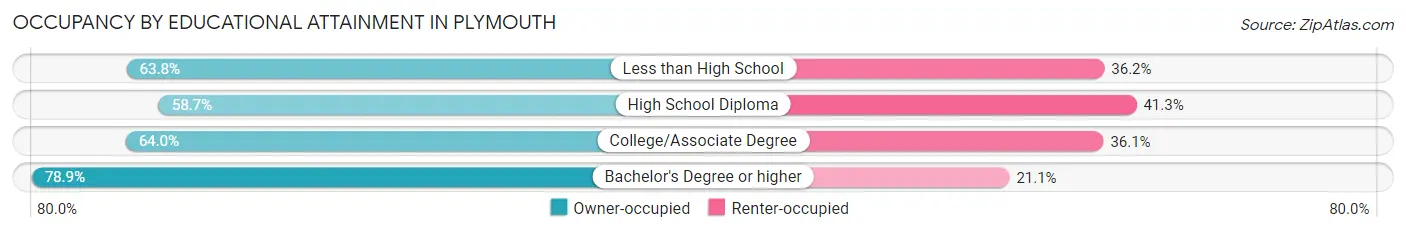
| Household Size | Owner-occupied | Renter-occupied |
| Less than High School | 164 (63.8%) | 93 (36.2%) |
| High School Diploma | 731 (58.7%) | 514 (41.3%) |
| College/Associate Degree | 933 (63.9%) | 526 (36.0%) |
| Bachelor's Degree or higher | 828 (78.9%) | 222 (21.1%) |
Occupancy by Age of Householder in Plymouth
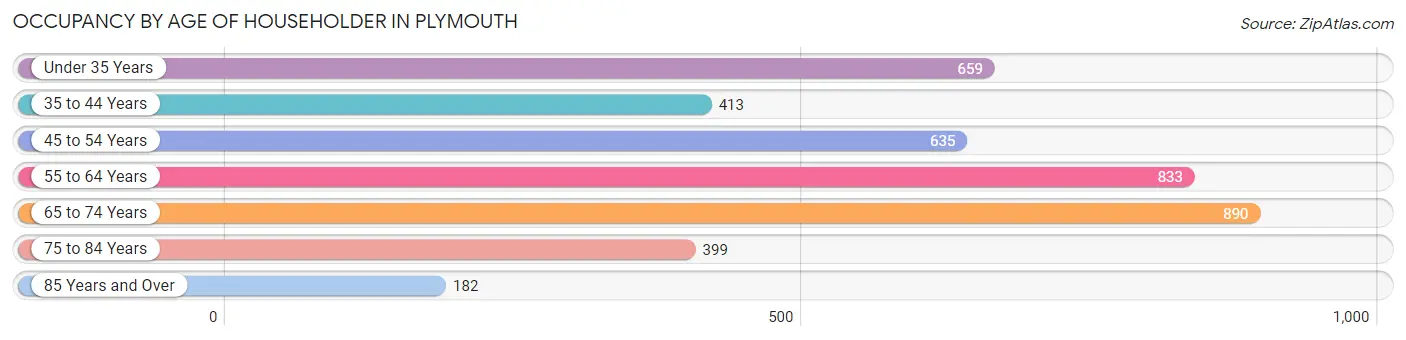
| Age Bracket | # Households | % Households |
| Under 35 Years | 659 | 16.4% |
| 35 to 44 Years | 413 | 10.3% |
| 45 to 54 Years | 635 | 15.8% |
| 55 to 64 Years | 833 | 20.8% |
| 65 to 74 Years | 890 | 22.2% |
| 75 to 84 Years | 399 | 10.0% |
| 85 Years and Over | 182 | 4.5% |
| Total | 4,011 | 100.0% |
Housing Finances in Plymouth
Median Income by Occupancy in Plymouth
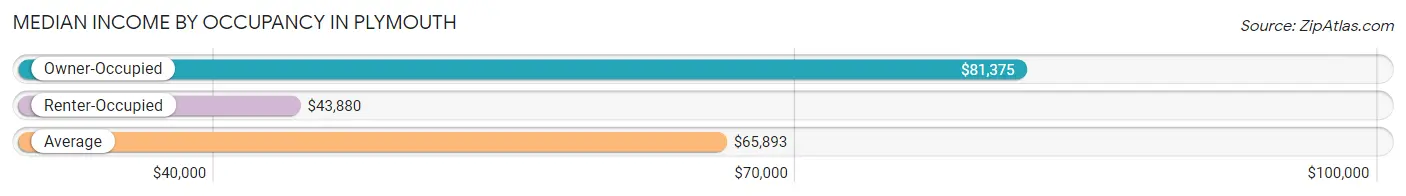
| Occupancy Type | # Households | Median Income |
| Owner-Occupied | 2,656 (66.2%) | $81,375 |
| Renter-Occupied | 1,355 (33.8%) | $43,880 |
| Average | 4,011 (100.0%) | $65,893 |
Occupancy by Householder Income Bracket in Plymouth
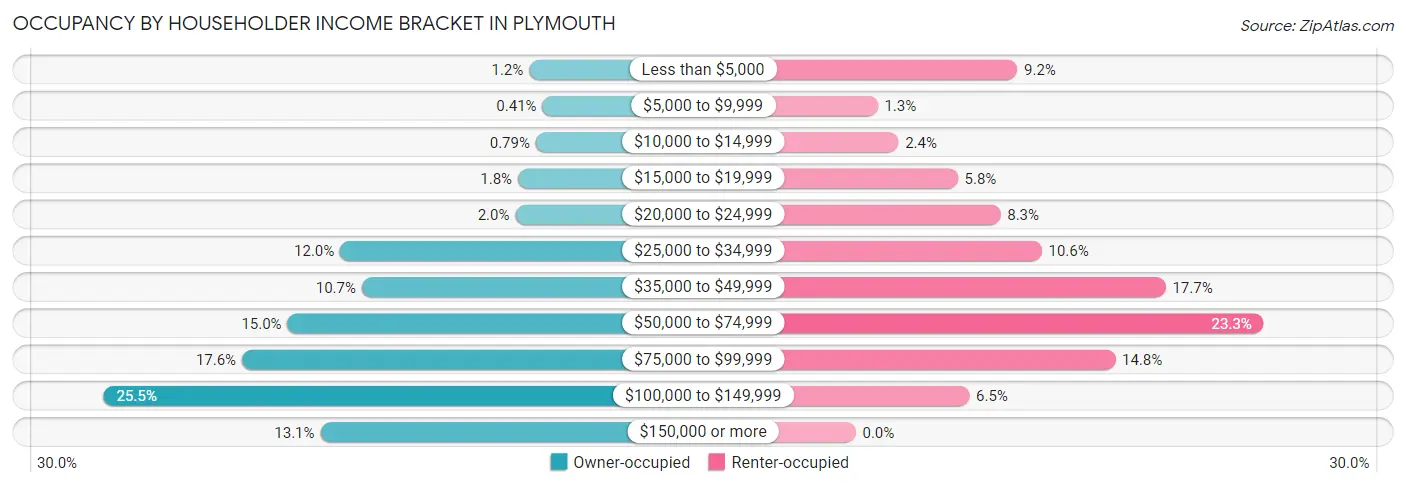
| Income Bracket | Owner-occupied | Renter-occupied |
| Less than $5,000 | 31 (1.2%) | 125 (9.2%) |
| $5,000 to $9,999 | 11 (0.4%) | 17 (1.3%) |
| $10,000 to $14,999 | 21 (0.8%) | 33 (2.4%) |
| $15,000 to $19,999 | 48 (1.8%) | 79 (5.8%) |
| $20,000 to $24,999 | 52 (2.0%) | 112 (8.3%) |
| $25,000 to $34,999 | 318 (12.0%) | 144 (10.6%) |
| $35,000 to $49,999 | 285 (10.7%) | 240 (17.7%) |
| $50,000 to $74,999 | 398 (15.0%) | 316 (23.3%) |
| $75,000 to $99,999 | 467 (17.6%) | 201 (14.8%) |
| $100,000 to $149,999 | 677 (25.5%) | 88 (6.5%) |
| $150,000 or more | 348 (13.1%) | 0 (0.0%) |
| Total | 2,656 (100.0%) | 1,355 (100.0%) |
Monthly Housing Cost Tiers in Plymouth
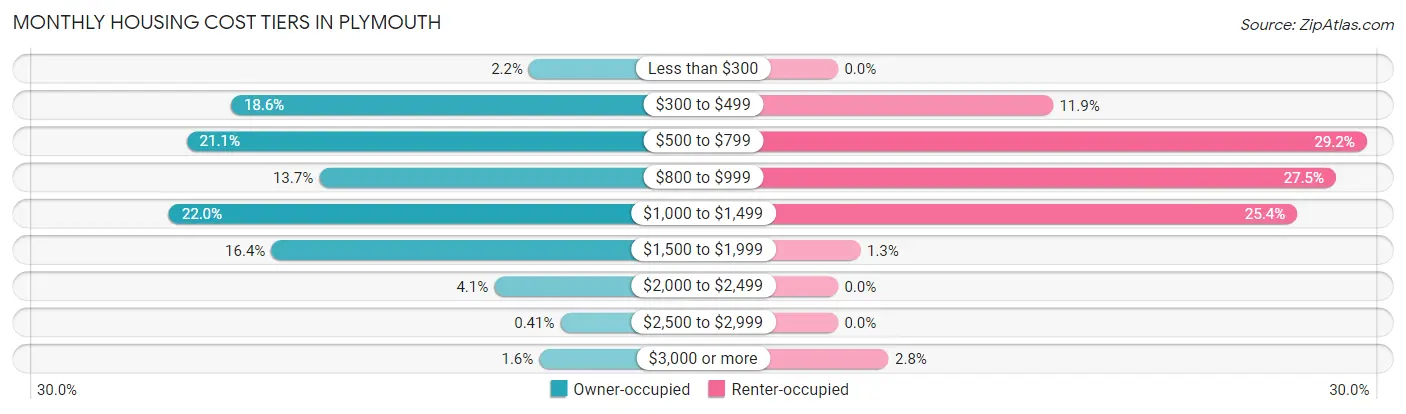
| Monthly Cost | Owner-occupied | Renter-occupied |
| Less than $300 | 57 (2.1%) | 0 (0.0%) |
| $300 to $499 | 494 (18.6%) | 161 (11.9%) |
| $500 to $799 | 559 (21.0%) | 396 (29.2%) |
| $800 to $999 | 365 (13.7%) | 373 (27.5%) |
| $1,000 to $1,499 | 585 (22.0%) | 344 (25.4%) |
| $1,500 to $1,999 | 435 (16.4%) | 17 (1.3%) |
| $2,000 to $2,499 | 108 (4.1%) | 0 (0.0%) |
| $2,500 to $2,999 | 11 (0.4%) | 0 (0.0%) |
| $3,000 or more | 42 (1.6%) | 38 (2.8%) |
| Total | 2,656 (100.0%) | 1,355 (100.0%) |
Physical Housing Characteristics in Plymouth
Housing Structures in Plymouth
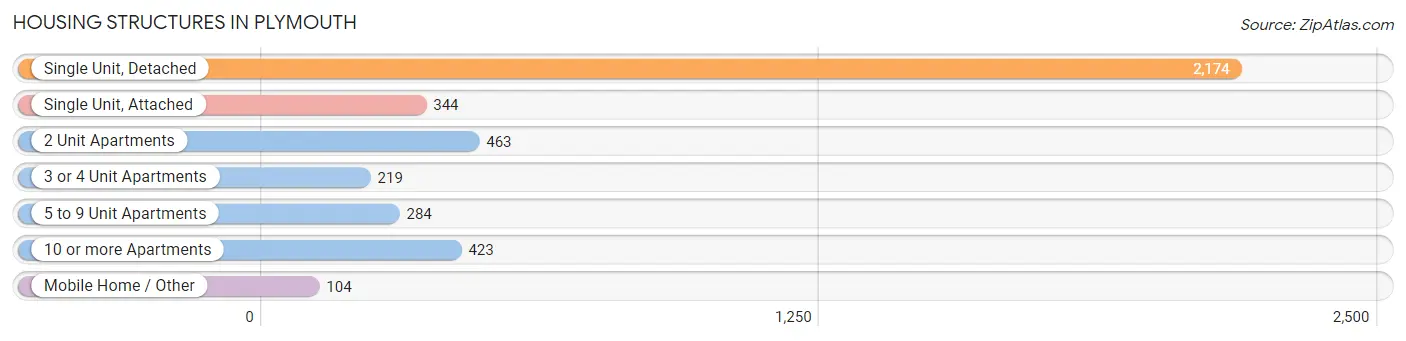
| Structure Type | # Housing Units | % Housing Units |
| Single Unit, Detached | 2,174 | 54.2% |
| Single Unit, Attached | 344 | 8.6% |
| 2 Unit Apartments | 463 | 11.5% |
| 3 or 4 Unit Apartments | 219 | 5.5% |
| 5 to 9 Unit Apartments | 284 | 7.1% |
| 10 or more Apartments | 423 | 10.5% |
| Mobile Home / Other | 104 | 2.6% |
| Total | 4,011 | 100.0% |
Housing Structures by Occupancy in Plymouth
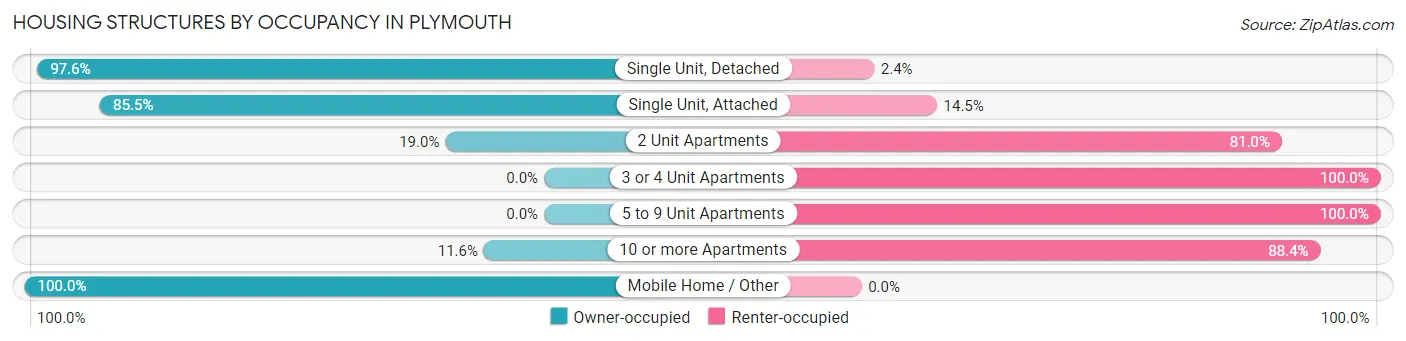
| Structure Type | Owner-occupied | Renter-occupied |
| Single Unit, Detached | 2,121 (97.6%) | 53 (2.4%) |
| Single Unit, Attached | 294 (85.5%) | 50 (14.5%) |
| 2 Unit Apartments | 88 (19.0%) | 375 (81.0%) |
| 3 or 4 Unit Apartments | 0 (0.0%) | 219 (100.0%) |
| 5 to 9 Unit Apartments | 0 (0.0%) | 284 (100.0%) |
| 10 or more Apartments | 49 (11.6%) | 374 (88.4%) |
| Mobile Home / Other | 104 (100.0%) | 0 (0.0%) |
| Total | 2,656 (66.2%) | 1,355 (33.8%) |
Housing Structures by Number of Rooms in Plymouth
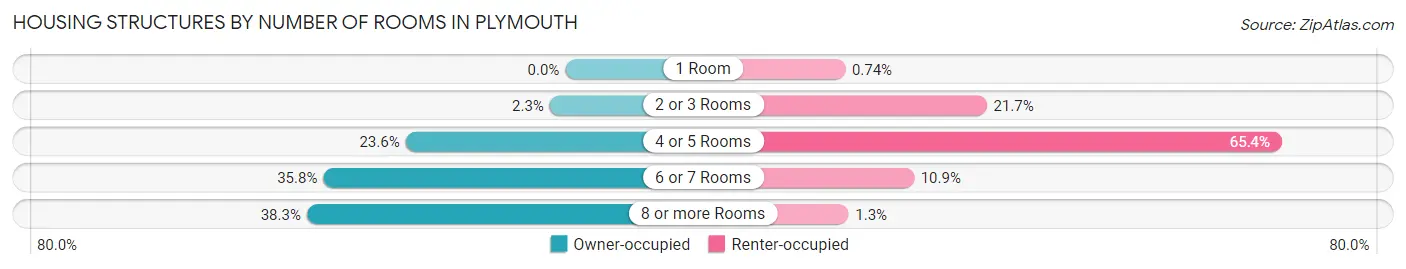
| Number of Rooms | Owner-occupied | Renter-occupied |
| 1 Room | 0 (0.0%) | 10 (0.7%) |
| 2 or 3 Rooms | 61 (2.3%) | 294 (21.7%) |
| 4 or 5 Rooms | 628 (23.6%) | 886 (65.4%) |
| 6 or 7 Rooms | 951 (35.8%) | 148 (10.9%) |
| 8 or more Rooms | 1,016 (38.3%) | 17 (1.3%) |
| Total | 2,656 (100.0%) | 1,355 (100.0%) |
Housing Structure by Heating Type in Plymouth
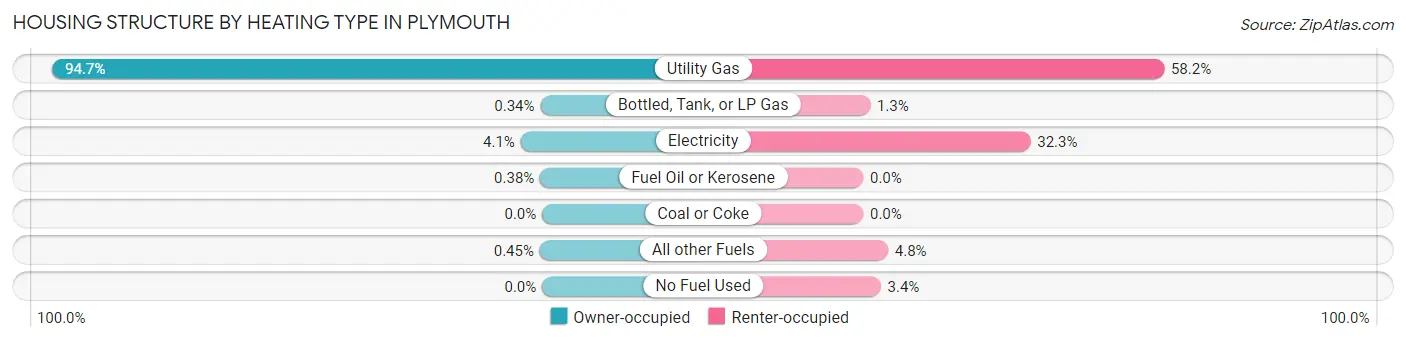
| Heating Type | Owner-occupied | Renter-occupied |
| Utility Gas | 2,515 (94.7%) | 788 (58.2%) |
| Bottled, Tank, or LP Gas | 9 (0.3%) | 18 (1.3%) |
| Electricity | 110 (4.1%) | 438 (32.3%) |
| Fuel Oil or Kerosene | 10 (0.4%) | 0 (0.0%) |
| Coal or Coke | 0 (0.0%) | 0 (0.0%) |
| All other Fuels | 12 (0.4%) | 65 (4.8%) |
| No Fuel Used | 0 (0.0%) | 46 (3.4%) |
| Total | 2,656 (100.0%) | 1,355 (100.0%) |
Household Vehicle Usage in Plymouth
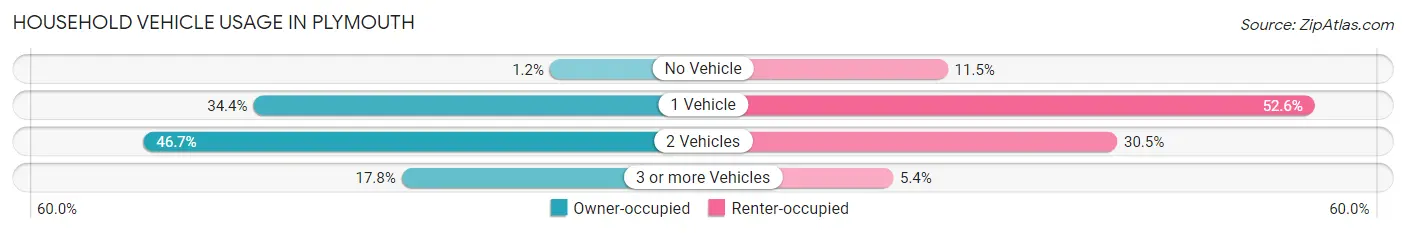
| Vehicles per Household | Owner-occupied | Renter-occupied |
| No Vehicle | 31 (1.2%) | 156 (11.5%) |
| 1 Vehicle | 913 (34.4%) | 713 (52.6%) |
| 2 Vehicles | 1,240 (46.7%) | 413 (30.5%) |
| 3 or more Vehicles | 472 (17.8%) | 73 (5.4%) |
| Total | 2,656 (100.0%) | 1,355 (100.0%) |
Real Estate & Mortgages in Plymouth
Real Estate and Mortgage Overview in Plymouth
| Characteristic | Without Mortgage | With Mortgage |
| Housing Units | 1,238 | 1,418 |
| Median Property Value | $178,600 | $179,900 |
| Median Household Income | $56,269 | $282 |
| Monthly Housing Costs | $541 | $0 |
| Real Estate Taxes | $2,873 | $0 |
Property Value by Mortgage Status in Plymouth
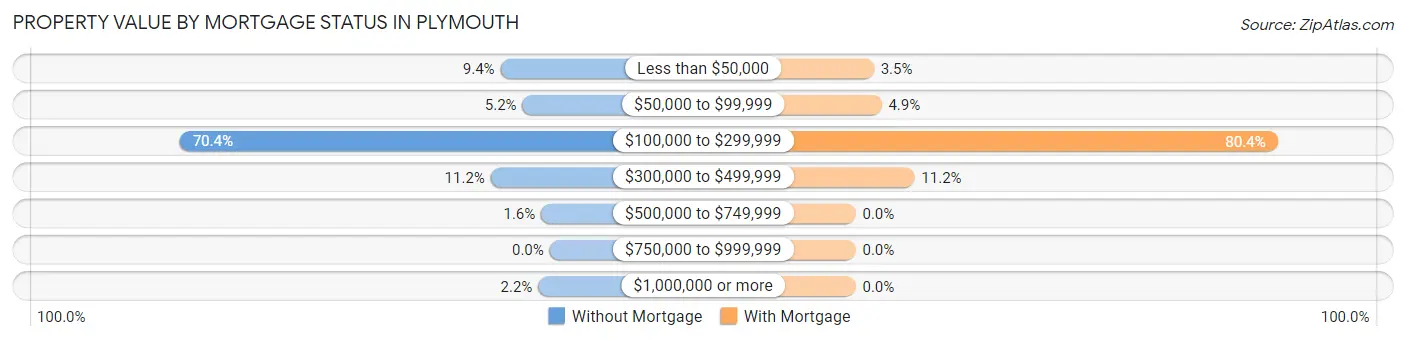
| Property Value | Without Mortgage | With Mortgage |
| Less than $50,000 | 116 (9.4%) | 49 (3.5%) |
| $50,000 to $99,999 | 64 (5.2%) | 70 (4.9%) |
| $100,000 to $299,999 | 872 (70.4%) | 1,140 (80.4%) |
| $300,000 to $499,999 | 139 (11.2%) | 159 (11.2%) |
| $500,000 to $749,999 | 20 (1.6%) | 0 (0.0%) |
| $750,000 to $999,999 | 0 (0.0%) | 0 (0.0%) |
| $1,000,000 or more | 27 (2.2%) | 0 (0.0%) |
| Total | 1,238 (100.0%) | 1,418 (100.0%) |
Household Income by Mortgage Status in Plymouth
| Household Income | Without Mortgage | With Mortgage |
| Less than $10,000 | 41 (3.3%) | 16 (1.1%) |
| $10,000 to $24,999 | 121 (9.8%) | 1 (0.1%) |
| $25,000 to $34,999 | 216 (17.4%) | 0 (0.0%) |
| $35,000 to $49,999 | 199 (16.1%) | 102 (7.2%) |
| $50,000 to $74,999 | 229 (18.5%) | 86 (6.1%) |
| $75,000 to $99,999 | 166 (13.4%) | 169 (11.9%) |
| $100,000 to $149,999 | 200 (16.2%) | 301 (21.2%) |
| $150,000 or more | 66 (5.3%) | 477 (33.6%) |
| Total | 1,238 (100.0%) | 1,418 (100.0%) |
Property Value to Household Income Ratio in Plymouth
| Value-to-Income Ratio | Without Mortgage | With Mortgage |
| Less than 2.0x | 387 (31.3%) | 106,719 (7,526.0%) |
| 2.0x to 2.9x | 254 (20.5%) | 828 (58.4%) |
| 3.0x to 3.9x | 57 (4.6%) | 299 (21.1%) |
| 4.0x or more | 540 (43.6%) | 187 (13.2%) |
| Total | 1,238 (100.0%) | 1,418 (100.0%) |
Real Estate Taxes by Mortgage Status in Plymouth
| Property Taxes | Without Mortgage | With Mortgage |
| Less than $800 | 114 (9.2%) | 0 (0.0%) |
| $800 to $1,499 | 0 (0.0%) | 26 (1.8%) |
| $800 to $1,499 | 1,065 (86.0%) | 37 (2.6%) |
| Total | 1,238 (100.0%) | 1,418 (100.0%) |
Health & Disability in Plymouth
Health Insurance Coverage by Age in Plymouth
| Age Bracket | With Coverage | Without Coverage |
| Under 6 Years | 528 (100.0%) | 0 (0.0%) |
| 6 to 18 Years | 1,386 (99.2%) | 11 (0.8%) |
| 19 to 25 Years | 865 (94.0%) | 55 (6.0%) |
| 26 to 34 Years | 750 (90.1%) | 82 (9.9%) |
| 35 to 44 Years | 833 (98.0%) | 17 (2.0%) |
| 45 to 54 Years | 1,008 (96.1%) | 41 (3.9%) |
| 55 to 64 Years | 1,307 (100.0%) | 0 (0.0%) |
| 65 to 74 Years | 1,277 (99.5%) | 7 (0.5%) |
| 75 Years and older | 662 (100.0%) | 0 (0.0%) |
| Total | 8,616 (97.6%) | 213 (2.4%) |
Health Insurance Coverage by Citizenship Status in Plymouth
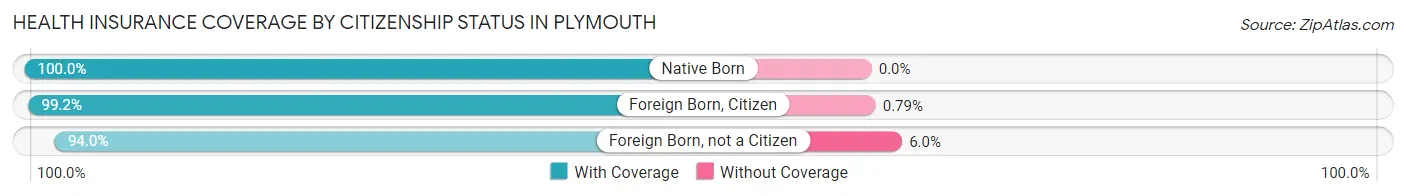
| Citizenship Status | With Coverage | Without Coverage |
| Native Born | 528 (100.0%) | 0 (0.0%) |
| Foreign Born, Citizen | 1,386 (99.2%) | 11 (0.8%) |
| Foreign Born, not a Citizen | 865 (94.0%) | 55 (6.0%) |
Health Insurance Coverage by Household Income in Plymouth
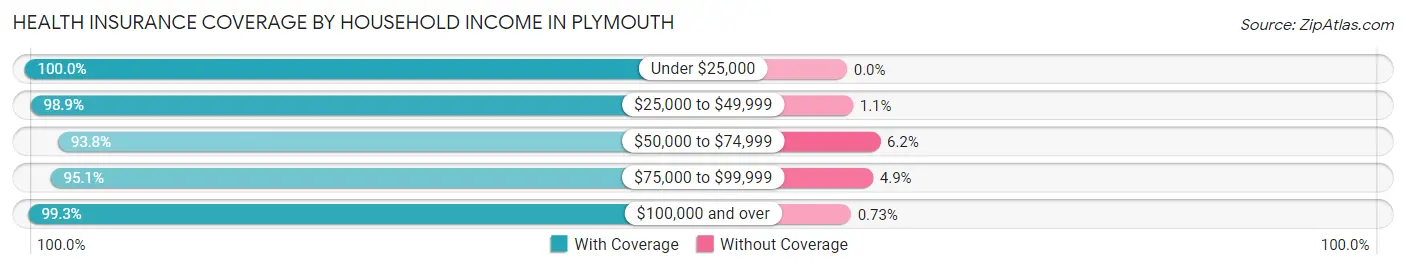
| Household Income | With Coverage | Without Coverage |
| Under $25,000 | 715 (100.0%) | 0 (0.0%) |
| $25,000 to $49,999 | 1,410 (98.9%) | 16 (1.1%) |
| $50,000 to $74,999 | 1,295 (93.8%) | 86 (6.2%) |
| $75,000 to $99,999 | 1,658 (95.1%) | 85 (4.9%) |
| $100,000 and over | 3,517 (99.3%) | 26 (0.7%) |
Public vs Private Health Insurance Coverage by Age in Plymouth
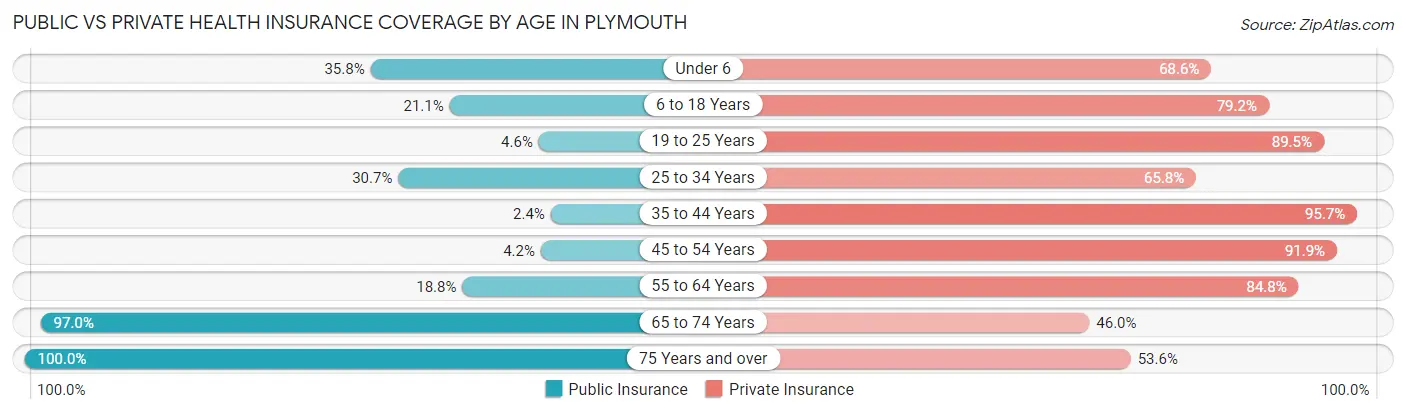
| Age Bracket | Public Insurance | Private Insurance |
| Under 6 | 189 (35.8%) | 362 (68.6%) |
| 6 to 18 Years | 295 (21.1%) | 1,107 (79.2%) |
| 19 to 25 Years | 42 (4.6%) | 823 (89.5%) |
| 25 to 34 Years | 255 (30.6%) | 547 (65.7%) |
| 35 to 44 Years | 20 (2.4%) | 813 (95.7%) |
| 45 to 54 Years | 44 (4.2%) | 964 (91.9%) |
| 55 to 64 Years | 245 (18.8%) | 1,108 (84.8%) |
| 65 to 74 Years | 1,246 (97.0%) | 590 (46.0%) |
| 75 Years and over | 662 (100.0%) | 355 (53.6%) |
| Total | 2,998 (34.0%) | 6,669 (75.5%) |
Disability Status by Sex by Age in Plymouth
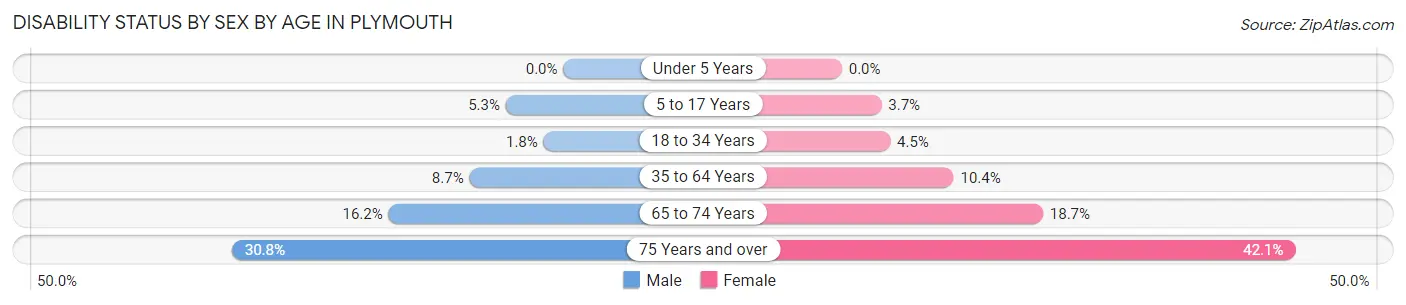
| Age Bracket | Male | Female |
| Under 5 Years | 0 (0.0%) | 0 (0.0%) |
| 5 to 17 Years | 36 (5.3%) | 26 (3.7%) |
| 18 to 34 Years | 21 (1.8%) | 31 (4.5%) |
| 35 to 64 Years | 118 (8.7%) | 192 (10.4%) |
| 65 to 74 Years | 104 (16.2%) | 120 (18.7%) |
| 75 Years and over | 48 (30.8%) | 213 (42.1%) |
Disability Class by Sex by Age in Plymouth
Disability Class: Hearing Difficulty
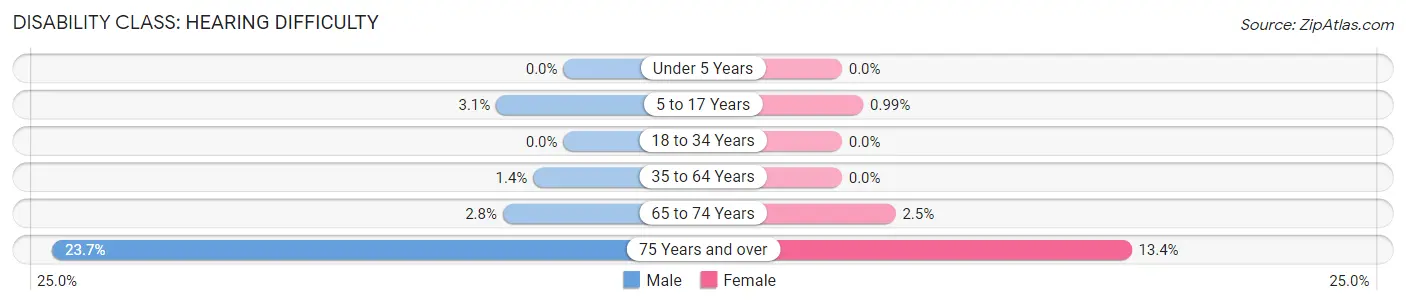
| Age Bracket | Male | Female |
| Under 5 Years | 0 (0.0%) | 0 (0.0%) |
| 5 to 17 Years | 21 (3.1%) | 7 (1.0%) |
| 18 to 34 Years | 0 (0.0%) | 0 (0.0%) |
| 35 to 64 Years | 19 (1.4%) | 0 (0.0%) |
| 65 to 74 Years | 18 (2.8%) | 16 (2.5%) |
| 75 Years and over | 37 (23.7%) | 68 (13.4%) |
Disability Class: Vision Difficulty
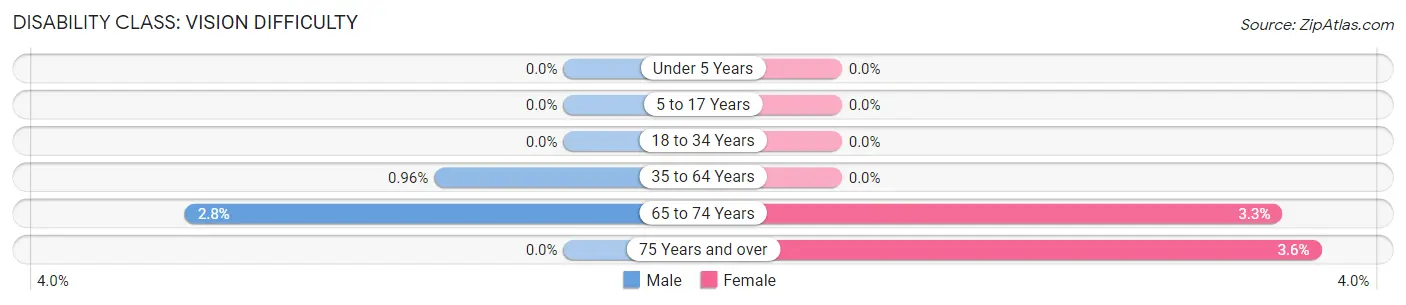
| Age Bracket | Male | Female |
| Under 5 Years | 0 (0.0%) | 0 (0.0%) |
| 5 to 17 Years | 0 (0.0%) | 0 (0.0%) |
| 18 to 34 Years | 0 (0.0%) | 0 (0.0%) |
| 35 to 64 Years | 13 (1.0%) | 0 (0.0%) |
| 65 to 74 Years | 18 (2.8%) | 21 (3.3%) |
| 75 Years and over | 0 (0.0%) | 18 (3.6%) |
Disability Class: Cognitive Difficulty
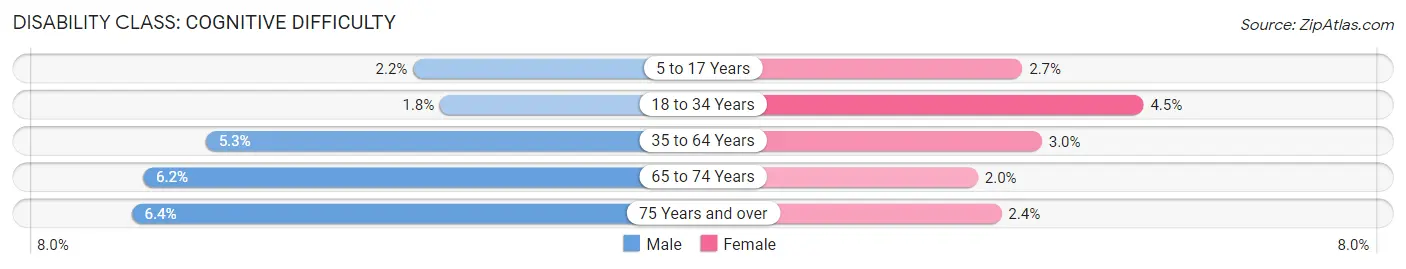
| Age Bracket | Male | Female |
| 5 to 17 Years | 15 (2.2%) | 19 (2.7%) |
| 18 to 34 Years | 21 (1.8%) | 31 (4.5%) |
| 35 to 64 Years | 72 (5.3%) | 55 (3.0%) |
| 65 to 74 Years | 40 (6.2%) | 13 (2.0%) |
| 75 Years and over | 10 (6.4%) | 12 (2.4%) |
Disability Class: Ambulatory Difficulty
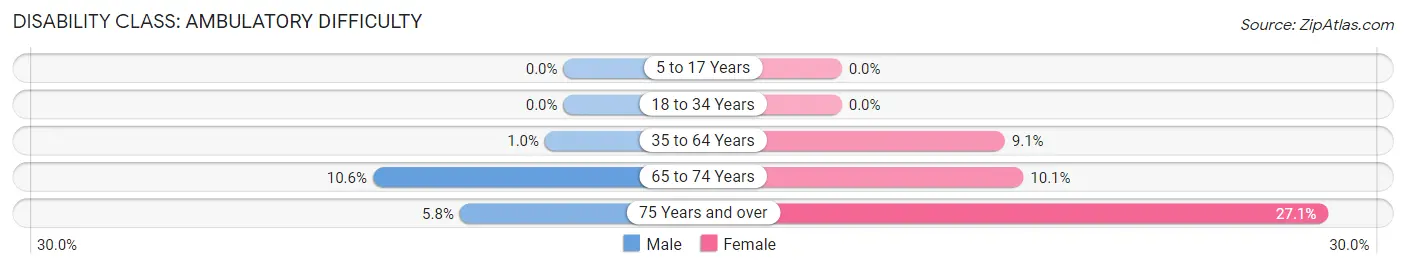
| Age Bracket | Male | Female |
| 5 to 17 Years | 0 (0.0%) | 0 (0.0%) |
| 18 to 34 Years | 0 (0.0%) | 0 (0.0%) |
| 35 to 64 Years | 14 (1.0%) | 168 (9.1%) |
| 65 to 74 Years | 68 (10.6%) | 65 (10.1%) |
| 75 Years and over | 9 (5.8%) | 137 (27.1%) |
Disability Class: Self-Care Difficulty
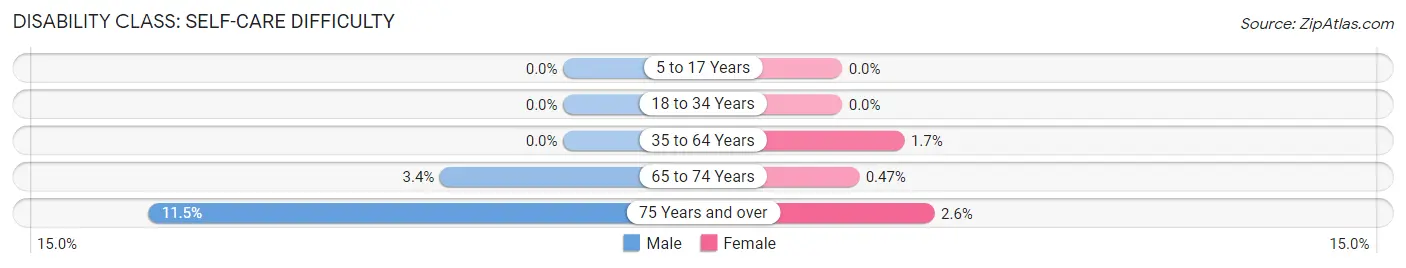
| Age Bracket | Male | Female |
| 5 to 17 Years | 0 (0.0%) | 0 (0.0%) |
| 18 to 34 Years | 0 (0.0%) | 0 (0.0%) |
| 35 to 64 Years | 0 (0.0%) | 32 (1.7%) |
| 65 to 74 Years | 22 (3.4%) | 3 (0.5%) |
| 75 Years and over | 18 (11.5%) | 13 (2.6%) |
Technology Access in Plymouth
Computing Device Access in Plymouth
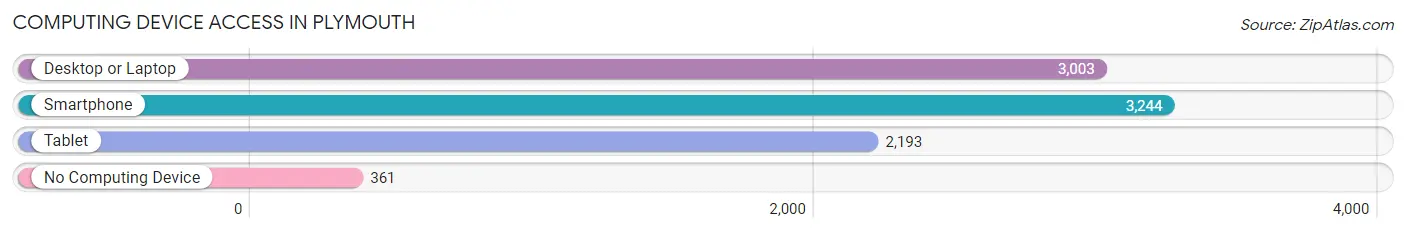
| Device Type | # Households | % Households |
| Desktop or Laptop | 3,003 | 74.9% |
| Smartphone | 3,244 | 80.9% |
| Tablet | 2,193 | 54.7% |
| No Computing Device | 361 | 9.0% |
| Total | 4,011 | 100.0% |
Internet Access in Plymouth
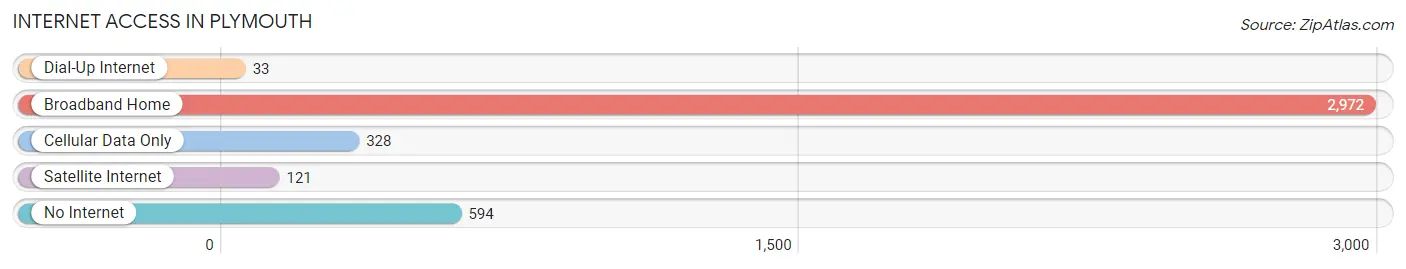
| Internet Type | # Households | % Households |
| Dial-Up Internet | 33 | 0.8% |
| Broadband Home | 2,972 | 74.1% |
| Cellular Data Only | 328 | 8.2% |
| Satellite Internet | 121 | 3.0% |
| No Internet | 594 | 14.8% |
| Total | 4,011 | 100.0% |
Plymouth Summary
Plymouth, Wisconsin is a city located in Sheboygan County, Wisconsin, United States. The population was 8,445 at the 2010 census. It is the county seat of Sheboygan County. Plymouth is located on the Sheboygan River, about 30 miles (48 km) north of Milwaukee and about 60 miles (97 km) south of Green Bay.
History
Plymouth was first settled in 1848 by a group of German immigrants led by John Schaller. The town was originally called Schallerville, but was later changed to Plymouth in 1851. The name was chosen to honor the Pilgrims who had arrived in Plymouth, Massachusetts in 1620.
The first post office in Plymouth was established in 1851. The first school was built in 1853. The first newspaper, the Plymouth Review, was established in 1856.
In 1858, the Sheboygan County Courthouse was built in Plymouth. The courthouse is still in use today and is listed on the National Register of Historic Places.
In 1871, the first railroad line was built through Plymouth, connecting it to Sheboygan and Milwaukee. This allowed for the growth of the city and the development of industries such as lumber, furniture, and paper.
In 1891 the first telephone line was installed in Plymouth
In the early 20th century, Plymouth was a popular tourist destination. The city was home to several resorts, including the Hotel Plymouth, the Hotel Schaller, and the Hotel Sheboygan.
Geography
Plymouth is located at 43°45′N 88°6′W (43.75, -88.10). According to the United States Census Bureau, the city has a total area of 5.17 square miles (13.37 km2), of which, 5.14 square miles (13.29 km2) is land and 0.03 square miles (0.08 km2) is water.
Economy
Plymouth’s economy is largely based on manufacturing and agriculture. The city is home to several manufacturing companies, including Sargento Foods, Inc., a cheese manufacturer, and Kohler Co., a plumbing and power systems manufacturer.
Agriculture is also an important part of the local economy. The city is home to several dairy farms, as well as fruit and vegetable farms.
Demographics
As of the census of 2010, there were 8,445 people, 3,521 households, and 2,092 families residing in the city. The population density was 1,637.2 people per square mile (631.2/km2). There were 3,788 housing units at an average density of 739.2 per square mile (285.3/km2). The racial makeup of the city was 95.2% White, 0.7% African American, 0.3% Native American, 0.7% Asian, 0.1% Pacific Islander, 1.7% from other races, and 1.2% from two or more races. Hispanic or Latino of any race were 4.2% of the population.
There were 3,521 households, out of which 28.2% had children under the age of 18 living with them, 44.2% were married couples living together, 11.3% had a female householder with no husband present, and 39.7% were non-families. 33.2% of all households were made up of individuals, and 15.2% had someone living alone who was 65 years of age or older. The average household size was 2.33 and the average family size was 2.97.
In the city, the population was spread out, with 24.2% under the age of 18, 8.2% from 18 to 24, 27.2% from 25 to 44, 22.2% from 45 to 64, and 18.2% who were 65 years of age or older. The median age was 38 years. For every 100 females, there were 92.2 males. For every 100 females age 18 and over, there were 88.3 males.
The median income for a household in the city was $40,945, and the median income for a family was $50,945. Males had a median income of $37,945 versus $25,945 for females. The per capita income for the city was $20,945. About 5.2% of families and 8.2% of the population were below the poverty line, including 10.2% of those under age 18 and 8.2% of those age 65 or over.
Common Questions
What is Per Capita Income in Plymouth?
Per Capita income in Plymouth is $34,630.
What is the Median Family Income in Plymouth?
Median Family Income in Plymouth is $84,747.
What is the Median Household income in Plymouth?
Median Household Income in Plymouth is $65,893.
What is Income or Wage Gap in Plymouth?
Income or Wage Gap in Plymouth is 17.1%.
Women in Plymouth earn 82.9 cents for every dollar earned by a man.
What is Inequality or Gini Index in Plymouth?
Inequality or Gini Index in Plymouth is 0.38.
What is the Total Population of Plymouth?
Total Population of Plymouth is 8,907.
What is the Total Male Population of Plymouth?
Total Male Population of Plymouth is 4,183.
What is the Total Female Population of Plymouth?
Total Female Population of Plymouth is 4,724.
What is the Ratio of Males per 100 Females in Plymouth?
There are 88.55 Males per 100 Females in Plymouth.
What is the Ratio of Females per 100 Males in Plymouth?
There are 112.93 Females per 100 Males in Plymouth.
What is the Median Population Age in Plymouth?
Median Population Age in Plymouth is 44.1 Years.
What is the Average Family Size in Plymouth
Average Family Size in Plymouth is 3.0 People.
What is the Average Household Size in Plymouth
Average Household Size in Plymouth is 2.2 People.
How Large is the Labor Force in Plymouth?
There are 4,542 People in the Labor Forcein in Plymouth.
What is the Percentage of People in the Labor Force in Plymouth?
63.0% of People are in the Labor Force in Plymouth.
What is the Unemployment Rate in Plymouth?
Unemployment Rate in Plymouth is 5.1%.