Ashland, WI Map & Demographics
Ashland Map
Ashland Overview
$30,062
PER CAPITA INCOME
$72,993
AVG FAMILY INCOME
$47,239
AVG HOUSEHOLD INCOME
46.0%
WAGE / INCOME GAP [ % ]
54.0¢/ $1
WAGE / INCOME GAP [ $ ]
0.48
INEQUALITY / GINI INDEX
7,903
TOTAL POPULATION
4,134
MALE POPULATION
3,769
FEMALE POPULATION
109.68
MALES / 100 FEMALES
91.17
FEMALES / 100 MALES
39.7
MEDIAN AGE
2.9
AVG FAMILY SIZE
2.1
AVG HOUSEHOLD SIZE
4,199
LABOR FORCE [ PEOPLE ]
63.5%
PERCENT IN LABOR FORCE
3.8%
UNEMPLOYMENT RATE
Ashland Zip Codes
Ashland Area Codes
Income in Ashland
Income Overview in Ashland
Per Capita Income in Ashland is $30,062, while median incomes of families and households are $72,993 and $47,239 respectively.
| Characteristic | Number | Measure |
| Per Capita Income | 7,903 | $30,062 |
| Median Family Income | 1,727 | $72,993 |
| Mean Family Income | 1,727 | $90,192 |
| Median Household Income | 3,437 | $47,239 |
| Mean Household Income | 3,437 | $65,228 |
| Income Deficit | 1,727 | $0 |
| Wage / Income Gap (%) | 7,903 | 46.02% |
| Wage / Income Gap ($) | 7,903 | 53.98¢ per $1 |
| Gini / Inequality Index | 7,903 | 0.48 |
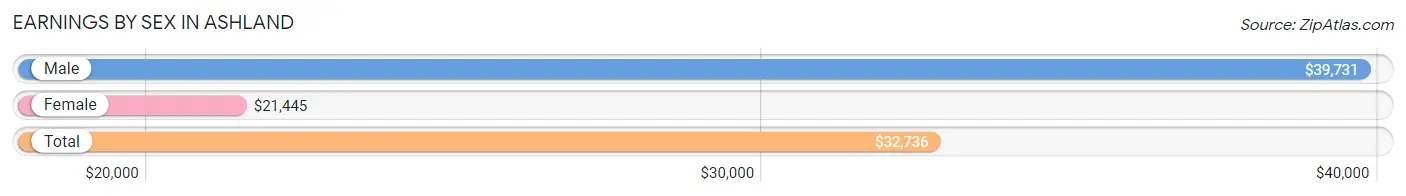
Earnings by Sex in Ashland
Average Earnings in Ashland are $32,736, $39,731 for men and $21,445 for women, a difference of 46.0%.
| Sex | Number | Average Earnings |
| Male | 2,493 (54.5%) | $39,731 |
| Female | 2,084 (45.5%) | $21,445 |
| Total | 4,577 (100.0%) | $32,736 |
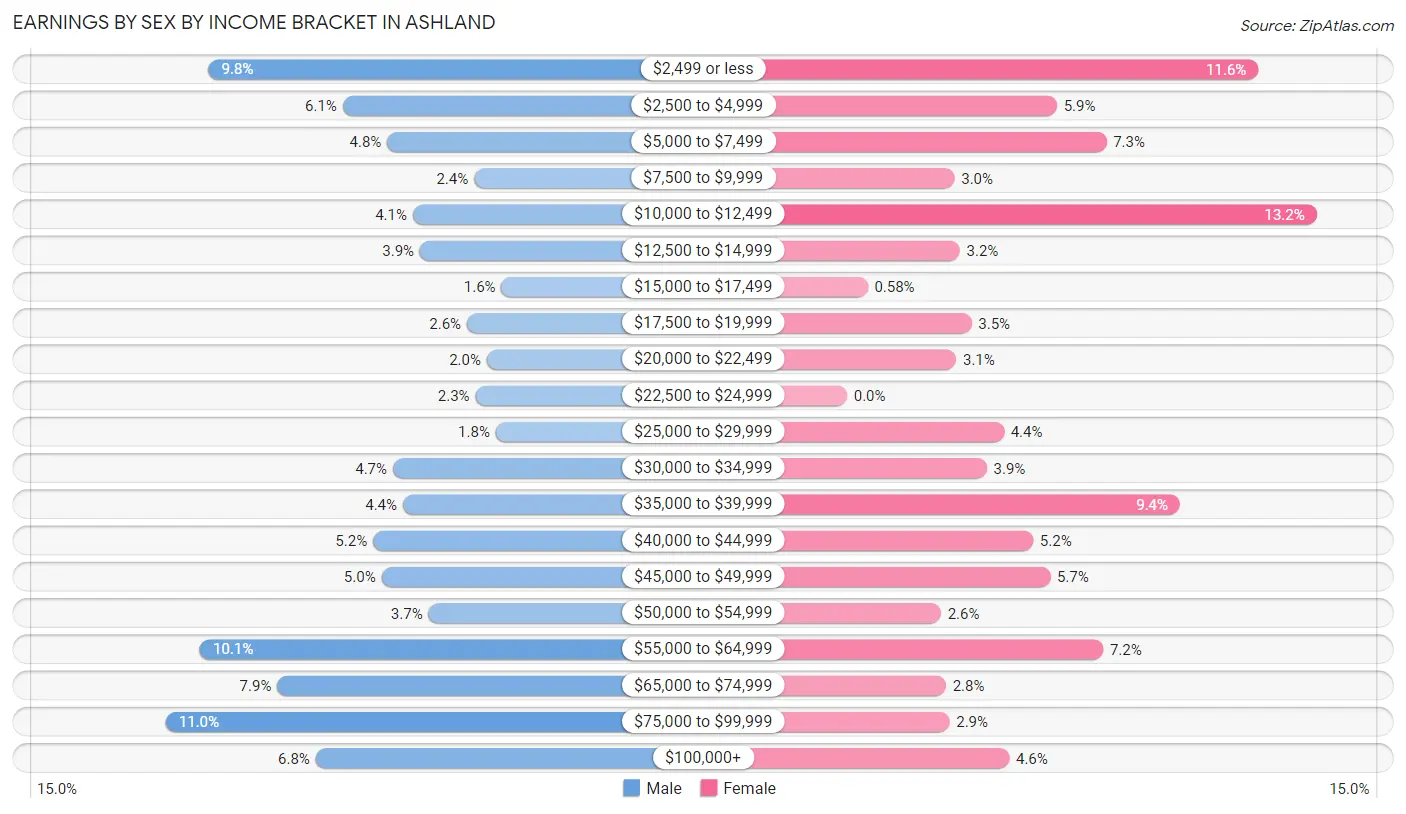
Earnings by Sex by Income Bracket in Ashland
The most common earnings brackets in Ashland are $75,000 to $99,999 for men (275 | 11.0%) and $10,000 to $12,499 for women (275 | 13.2%).
| Income | Male | Female |
| $2,499 or less | 245 (9.8%) | 241 (11.6%) |
| $2,500 to $4,999 | 151 (6.1%) | 123 (5.9%) |
| $5,000 to $7,499 | 120 (4.8%) | 152 (7.3%) |
| $7,500 to $9,999 | 59 (2.4%) | 63 (3.0%) |
| $10,000 to $12,499 | 102 (4.1%) | 275 (13.2%) |
| $12,500 to $14,999 | 97 (3.9%) | 66 (3.2%) |
| $15,000 to $17,499 | 40 (1.6%) | 12 (0.6%) |
| $17,500 to $19,999 | 64 (2.6%) | 73 (3.5%) |
| $20,000 to $22,499 | 50 (2.0%) | 64 (3.1%) |
| $22,500 to $24,999 | 58 (2.3%) | 0 (0.0%) |
| $25,000 to $29,999 | 44 (1.8%) | 92 (4.4%) |
| $30,000 to $34,999 | 116 (4.6%) | 82 (3.9%) |
| $35,000 to $39,999 | 109 (4.4%) | 195 (9.4%) |
| $40,000 to $44,999 | 130 (5.2%) | 109 (5.2%) |
| $45,000 to $49,999 | 124 (5.0%) | 119 (5.7%) |
| $50,000 to $54,999 | 91 (3.6%) | 55 (2.6%) |
| $55,000 to $64,999 | 251 (10.1%) | 150 (7.2%) |
| $65,000 to $74,999 | 197 (7.9%) | 58 (2.8%) |
| $75,000 to $99,999 | 275 (11.0%) | 60 (2.9%) |
| $100,000+ | 170 (6.8%) | 95 (4.6%) |
| Total | 2,493 (100.0%) | 2,084 (100.0%) |
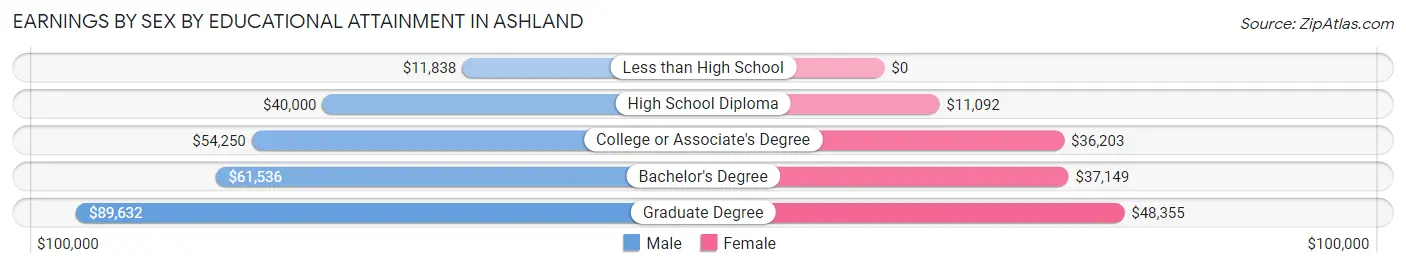
Earnings by Sex by Educational Attainment in Ashland
Average earnings in Ashland are $50,295 for men and $33,077 for women, a difference of 34.2%. Men with an educational attainment of graduate degree enjoy the highest average annual earnings of $89,632, while those with less than high school education earn the least with $11,838. Women with an educational attainment of graduate degree earn the most with the average annual earnings of $48,355, while those with high school diploma education have the smallest earnings of $11,092.
| Educational Attainment | Male Income | Female Income |
| Less than High School | $11,838 | $0 |
| High School Diploma | $40,000 | $11,092 |
| College or Associate's Degree | $54,250 | $36,203 |
| Bachelor's Degree | $61,536 | $37,149 |
| Graduate Degree | $89,632 | $48,355 |
| Total | $50,295 | $33,077 |
Family Income in Ashland
Family Income Brackets in Ashland
According to the Ashland family income data, there are 402 families falling into the $50,000 to $74,999 income range, which is the most common income bracket and makes up 23.3% of all families. Conversely, the $15,000 to $24,999 income bracket is the least frequent group with only 33 families (1.9%) belonging to this category.
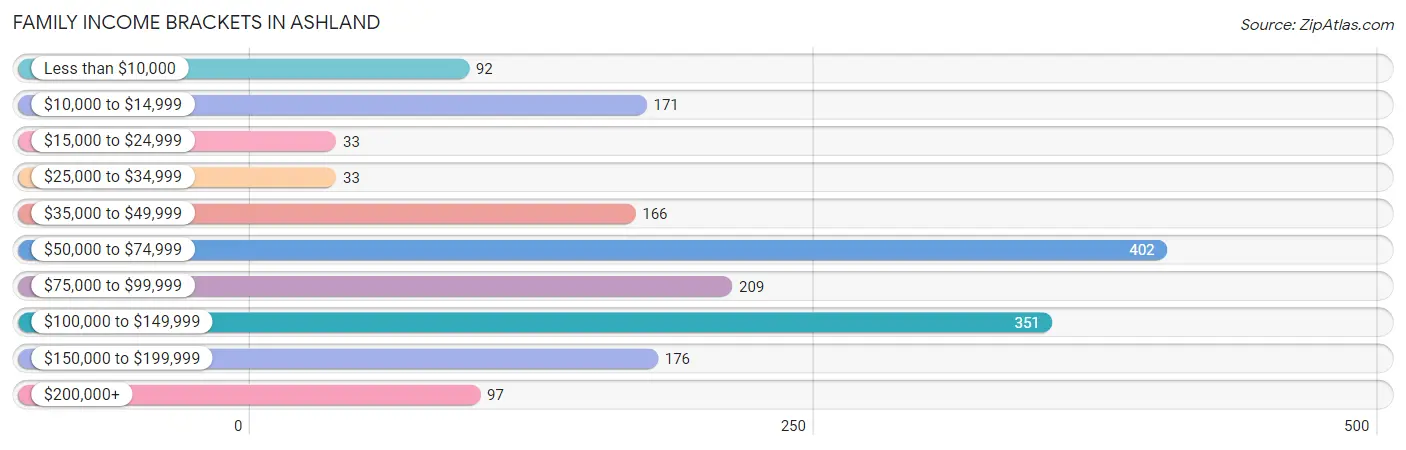
| Income Bracket | # Families | % Families |
| Less than $10,000 | 92 | 5.3% |
| $10,000 to $14,999 | 171 | 9.9% |
| $15,000 to $24,999 | 33 | 1.9% |
| $25,000 to $34,999 | 33 | 1.9% |
| $35,000 to $49,999 | 166 | 9.6% |
| $50,000 to $74,999 | 402 | 23.3% |
| $75,000 to $99,999 | 209 | 12.1% |
| $100,000 to $149,999 | 351 | 20.3% |
| $150,000 to $199,999 | 176 | 10.2% |
| $200,000+ | 97 | 5.6% |
Family Income by Famaliy Size in Ashland
3-person families (359 | 20.8%) account for the highest median family income in Ashland with $123,750 per family, while 3-person families (359 | 20.8%) have the highest median income of $41,250 per family member.
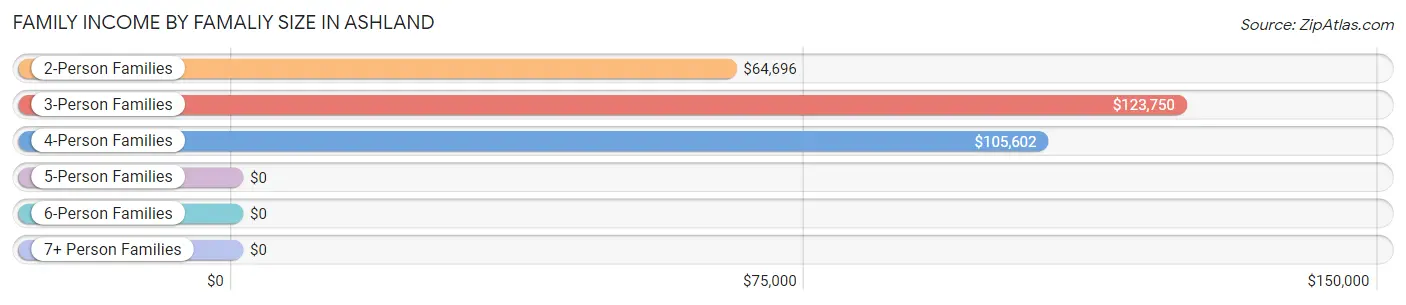
| Income Bracket | # Families | Median Income |
| 2-Person Families | 971 (56.2%) | $64,696 |
| 3-Person Families | 359 (20.8%) | $123,750 |
| 4-Person Families | 317 (18.4%) | $105,602 |
| 5-Person Families | 65 (3.8%) | $0 |
| 6-Person Families | 10 (0.6%) | $0 |
| 7+ Person Families | 5 (0.3%) | $0 |
| Total | 1,727 (100.0%) | $72,993 |
Family Income by Number of Earners in Ashland
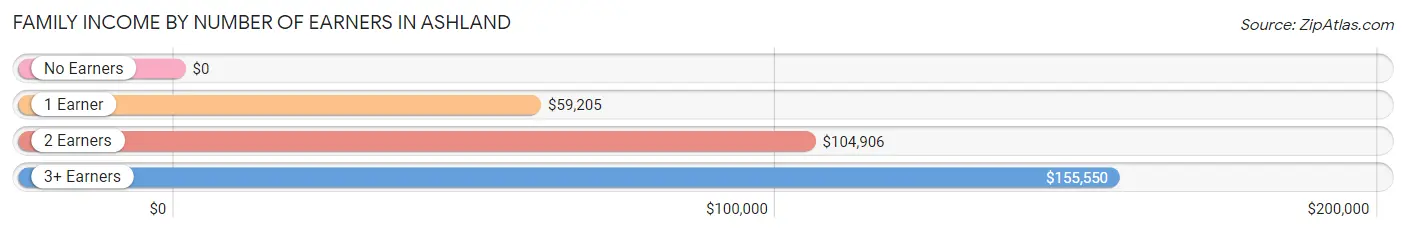
| Number of Earners | # Families | Median Income |
| No Earners | 277 (16.0%) | $0 |
| 1 Earner | 544 (31.5%) | $59,205 |
| 2 Earners | 741 (42.9%) | $104,906 |
| 3+ Earners | 165 (9.6%) | $155,550 |
| Total | 1,727 (100.0%) | $72,993 |
Household Income in Ashland
Household Income Brackets in Ashland
With 646 households falling in the category, the $50,000 to $74,999 income range is the most frequent in Ashland, accounting for 18.8% of all households. In contrast, only 120 households (3.5%) fall into the $200,000+ income bracket, making it the least populous group.
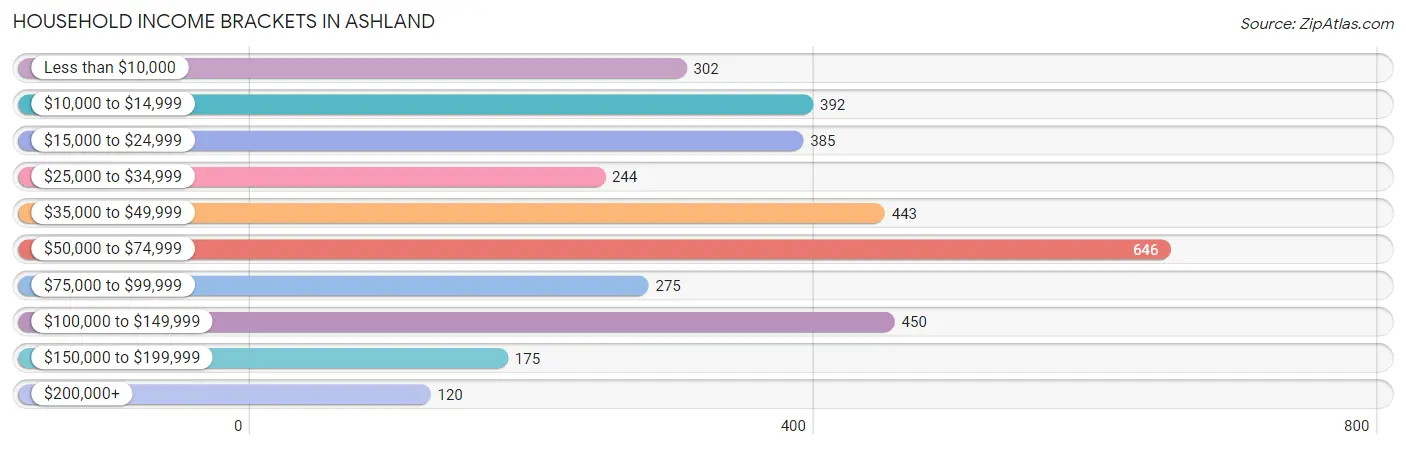
| Income Bracket | # Households | % Households |
| Less than $10,000 | 302 | 8.8% |
| $10,000 to $14,999 | 392 | 11.4% |
| $15,000 to $24,999 | 385 | 11.2% |
| $25,000 to $34,999 | 244 | 7.1% |
| $35,000 to $49,999 | 443 | 12.9% |
| $50,000 to $74,999 | 646 | 18.8% |
| $75,000 to $99,999 | 275 | 8.0% |
| $100,000 to $149,999 | 450 | 13.1% |
| $150,000 to $199,999 | 175 | 5.1% |
| $200,000+ | 120 | 3.5% |
Household Income by Householder Age in Ashland
The median household income in Ashland is $47,239, with the highest median household income of $56,573 found in the 45 to 64 years age bracket for the primary householder. A total of 1,153 households (33.6%) fall into this category. Meanwhile, the 65+ years age bracket for the primary householder has the lowest median household income of $38,090, with 997 households (29.0%) in this group.
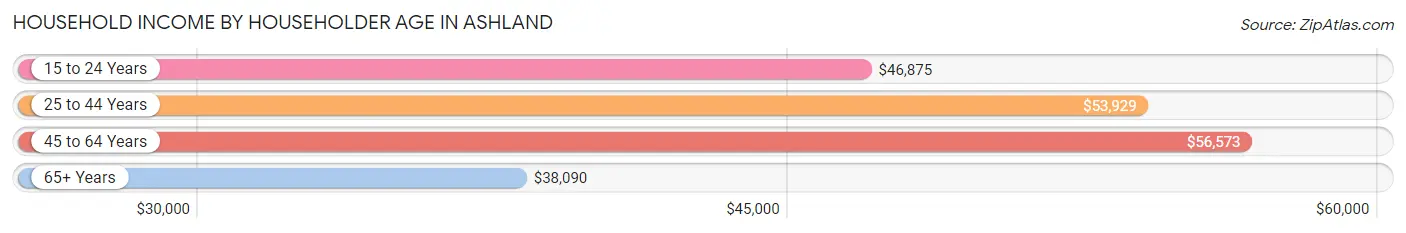
| Income Bracket | # Households | Median Income |
| 15 to 24 Years | 149 (4.3%) | $46,875 |
| 25 to 44 Years | 1,138 (33.1%) | $53,929 |
| 45 to 64 Years | 1,153 (33.6%) | $56,573 |
| 65+ Years | 997 (29.0%) | $38,090 |
| Total | 3,437 (100.0%) | $47,239 |
Poverty in Ashland
Income Below Poverty by Sex and Age in Ashland
With 23.3% poverty level for males and 26.5% for females among the residents of Ashland, 5 year old males and 6 to 11 year old females are the most vulnerable to poverty, with 75 males (83.3%) and 96 females (50.3%) in their respective age groups living below the poverty level.
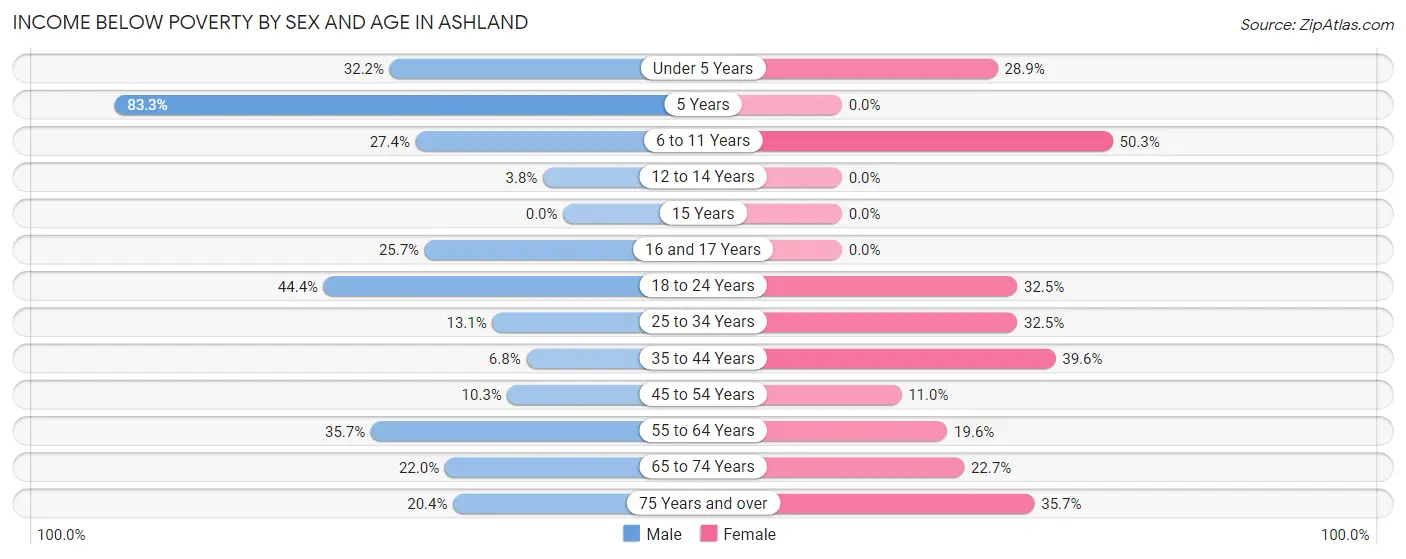
| Age Bracket | Male | Female |
| Under 5 Years | 66 (32.2%) | 50 (28.9%) |
| 5 Years | 75 (83.3%) | 0 (0.0%) |
| 6 to 11 Years | 60 (27.4%) | 96 (50.3%) |
| 12 to 14 Years | 3 (3.7%) | 0 (0.0%) |
| 15 Years | 0 (0.0%) | 0 (0.0%) |
| 16 and 17 Years | 37 (25.7%) | 0 (0.0%) |
| 18 to 24 Years | 160 (44.4%) | 95 (32.5%) |
| 25 to 34 Years | 62 (13.1%) | 135 (32.5%) |
| 35 to 44 Years | 34 (6.8%) | 195 (39.6%) |
| 45 to 54 Years | 46 (10.3%) | 44 (11.0%) |
| 55 to 64 Years | 212 (35.7%) | 106 (19.6%) |
| 65 to 74 Years | 76 (22.0%) | 93 (22.7%) |
| 75 Years and over | 48 (20.4%) | 129 (35.7%) |
| Total | 879 (23.3%) | 943 (26.5%) |
Income Above Poverty by Sex and Age in Ashland
According to the poverty statistics in Ashland, males aged 15 years and females aged 5 years are the age groups that are most secure financially, with 100.0% of males and 100.0% of females in these age groups living above the poverty line.
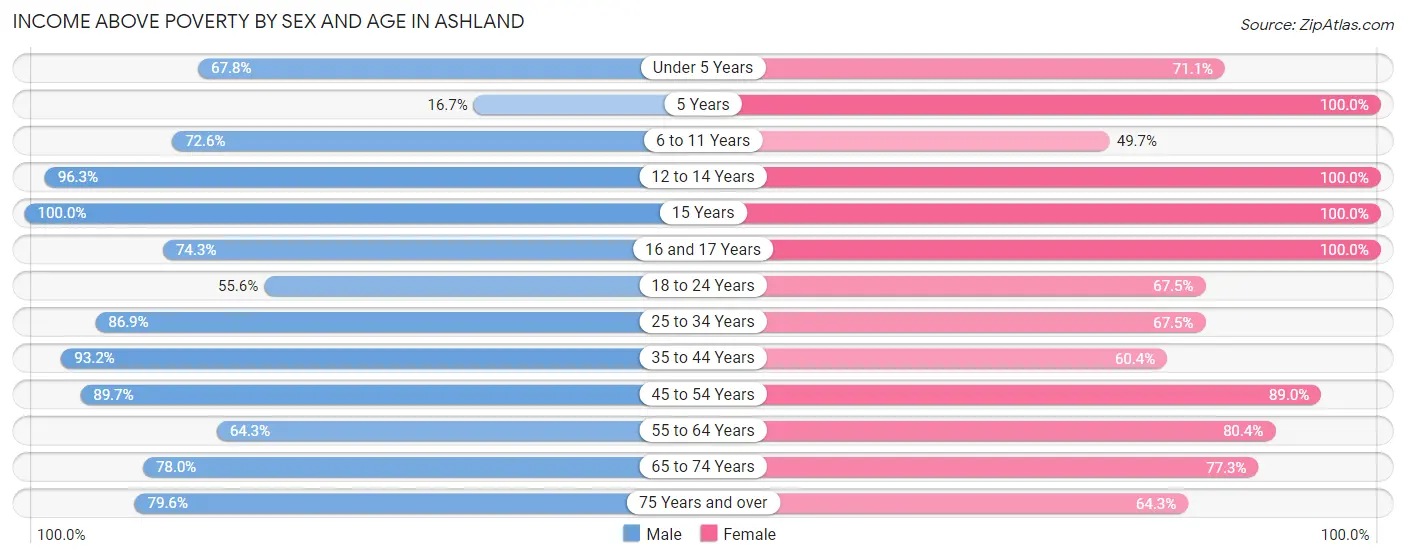
| Age Bracket | Male | Female |
| Under 5 Years | 139 (67.8%) | 123 (71.1%) |
| 5 Years | 15 (16.7%) | 6 (100.0%) |
| 6 to 11 Years | 159 (72.6%) | 95 (49.7%) |
| 12 to 14 Years | 77 (96.3%) | 154 (100.0%) |
| 15 Years | 89 (100.0%) | 70 (100.0%) |
| 16 and 17 Years | 107 (74.3%) | 54 (100.0%) |
| 18 to 24 Years | 200 (55.6%) | 197 (67.5%) |
| 25 to 34 Years | 410 (86.9%) | 280 (67.5%) |
| 35 to 44 Years | 463 (93.2%) | 297 (60.4%) |
| 45 to 54 Years | 399 (89.7%) | 355 (89.0%) |
| 55 to 64 Years | 382 (64.3%) | 436 (80.4%) |
| 65 to 74 Years | 270 (78.0%) | 317 (77.3%) |
| 75 Years and over | 187 (79.6%) | 232 (64.3%) |
| Total | 2,897 (76.7%) | 2,616 (73.5%) |
Income Below Poverty Among Married-Couple Families in Ashland
The poverty statistics for married-couple families in Ashland show that 4.8% or 62 of the total 1,304 families live below the poverty line. Families with no children have the highest poverty rate of 7.3%, comprising of 62 families. On the other hand, families with 1 or 2 children have the lowest poverty rate of 0.0%, which includes 0 families.
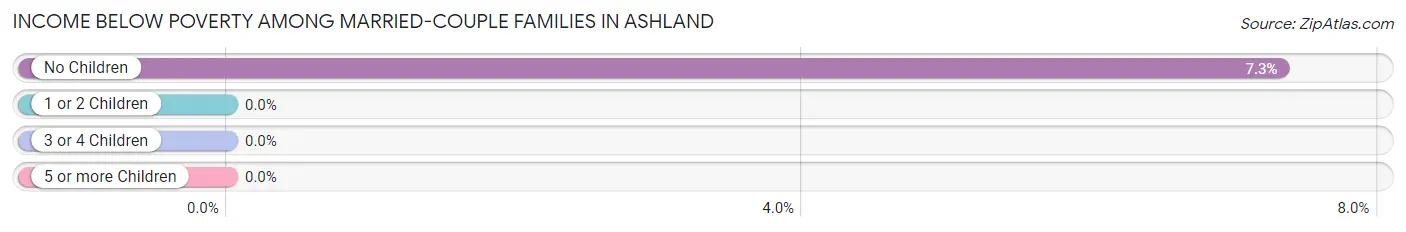
| Children | Above Poverty | Below Poverty |
| No Children | 785 (92.7%) | 62 (7.3%) |
| 1 or 2 Children | 429 (100.0%) | 0 (0.0%) |
| 3 or 4 Children | 28 (100.0%) | 0 (0.0%) |
| 5 or more Children | 0 (0.0%) | 0 (0.0%) |
| Total | 1,242 (95.3%) | 62 (4.8%) |
Income Below Poverty Among Single-Parent Households in Ashland
According to the poverty data in Ashland, 25.4% or 18 single-father households and 60.8% or 214 single-mother households are living below the poverty line. Among single-father households, those with 1 or 2 children have the highest poverty rate, with 18 households (26.9%) experiencing poverty. Likewise, among single-mother households, those with 1 or 2 children have the highest poverty rate, with 184 households (74.2%) falling below the poverty line.
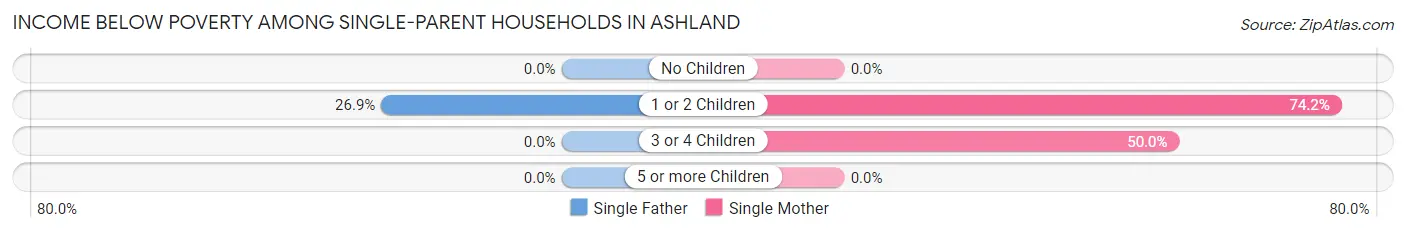
| Children | Single Father | Single Mother |
| No Children | 0 (0.0%) | 0 (0.0%) |
| 1 or 2 Children | 18 (26.9%) | 184 (74.2%) |
| 3 or 4 Children | 0 (0.0%) | 30 (50.0%) |
| 5 or more Children | 0 (0.0%) | 0 (0.0%) |
| Total | 18 (25.4%) | 214 (60.8%) |
Income Below Poverty Among Married-Couple vs Single-Parent Households in Ashland
The poverty data for Ashland shows that 62 of the married-couple family households (4.8%) and 232 of the single-parent households (54.8%) are living below the poverty level. Within the married-couple family households, those with no children have the highest poverty rate, with 62 households (7.3%) falling below the poverty line. Among the single-parent households, those with 1 or 2 children have the highest poverty rate, with 202 household (64.1%) living below poverty.
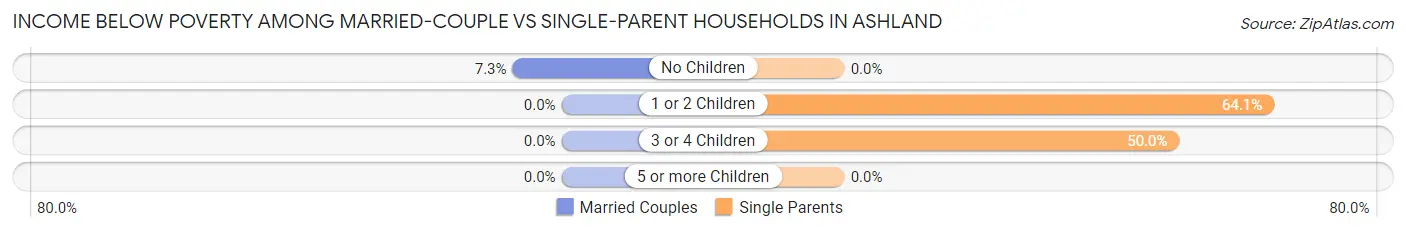
| Children | Married-Couple Families | Single-Parent Households |
| No Children | 62 (7.3%) | 0 (0.0%) |
| 1 or 2 Children | 0 (0.0%) | 202 (64.1%) |
| 3 or 4 Children | 0 (0.0%) | 30 (50.0%) |
| 5 or more Children | 0 (0.0%) | 0 (0.0%) |
| Total | 62 (4.8%) | 232 (54.8%) |
Race in Ashland
The most populous races in Ashland are White / Caucasian (6,665 | 84.3%), Native / Alaskan (498 | 6.3%), and Two or more Races (433 | 5.5%).
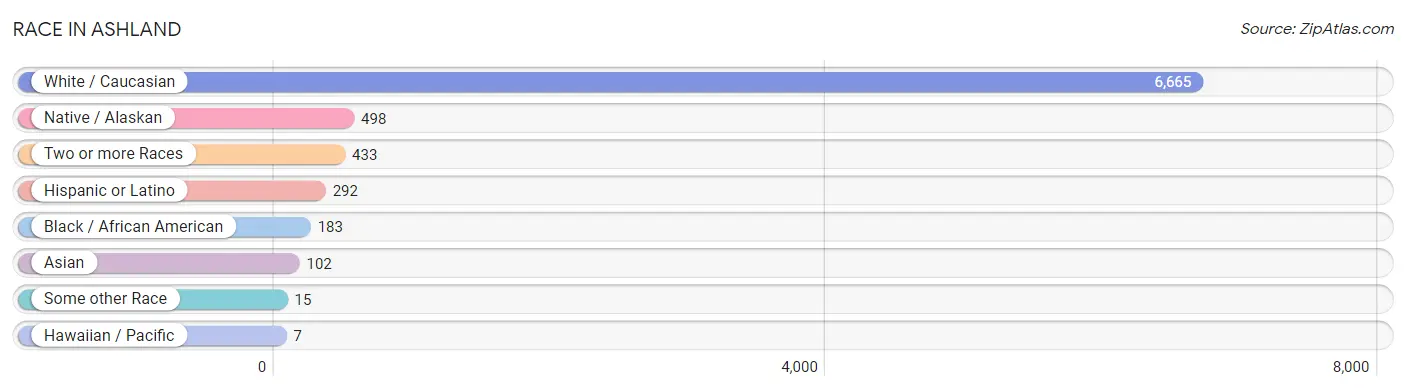
| Race | # Population | % Population |
| Asian | 102 | 1.3% |
| Black / African American | 183 | 2.3% |
| Hawaiian / Pacific | 7 | 0.1% |
| Hispanic or Latino | 292 | 3.7% |
| Native / Alaskan | 498 | 6.3% |
| White / Caucasian | 6,665 | 84.3% |
| Two or more Races | 433 | 5.5% |
| Some other Race | 15 | 0.2% |
| Total | 7,903 | 100.0% |
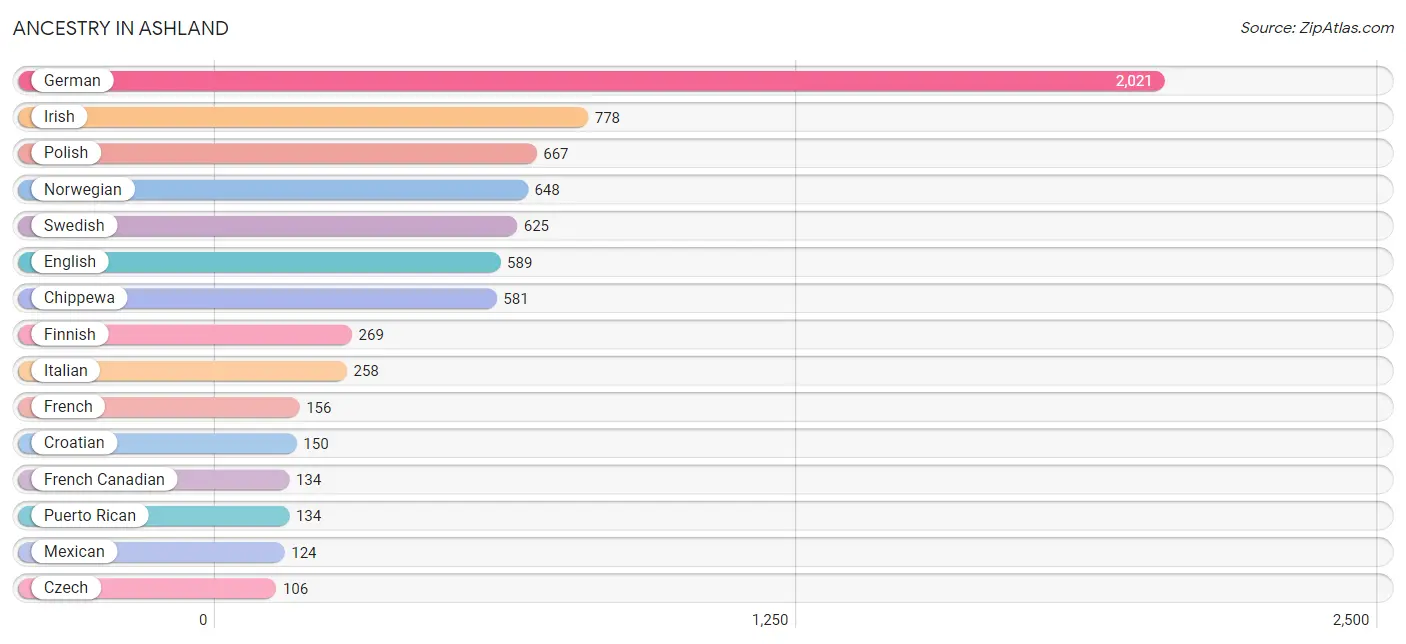
Ancestry in Ashland
The most populous ancestries reported in Ashland are German (2,021 | 25.6%), Irish (778 | 9.8%), Polish (667 | 8.4%), Norwegian (648 | 8.2%), and Swedish (625 | 7.9%), together accounting for 60.0% of all Ashland residents.
| Ancestry | # Population | % Population |
| Alaskan Athabascan | 14 | 0.2% |
| American | 93 | 1.2% |
| Argentinean | 9 | 0.1% |
| Austrian | 16 | 0.2% |
| Bangladeshi | 4 | 0.1% |
| Belgian | 15 | 0.2% |
| Burmese | 27 | 0.3% |
| Canadian | 9 | 0.1% |
| Celtic | 26 | 0.3% |
| Central American Indian | 24 | 0.3% |
| Chippewa | 581 | 7.3% |
| Croatian | 150 | 1.9% |
| Czech | 106 | 1.3% |
| Czechoslovakian | 21 | 0.3% |
| Danish | 17 | 0.2% |
| Dutch | 100 | 1.3% |
| Eastern European | 25 | 0.3% |
| English | 589 | 7.4% |
| European | 79 | 1.0% |
| Finnish | 269 | 3.4% |
| French | 156 | 2.0% |
| French Canadian | 134 | 1.7% |
| German | 2,021 | 25.6% |
| Greek | 84 | 1.1% |
| Hungarian | 62 | 0.8% |
| Inupiat | 17 | 0.2% |
| Irish | 778 | 9.8% |
| Italian | 258 | 3.3% |
| Lithuanian | 44 | 0.6% |
| Luxembourger | 9 | 0.1% |
| Mexican | 124 | 1.6% |
| Native Hawaiian | 1 | 0.0% |
| Northern European | 18 | 0.2% |
| Norwegian | 648 | 8.2% |
| Polish | 667 | 8.4% |
| Portuguese | 10 | 0.1% |
| Puerto Rican | 134 | 1.7% |
| Russian | 68 | 0.9% |
| Scandinavian | 98 | 1.2% |
| Scotch-Irish | 15 | 0.2% |
| Scottish | 53 | 0.7% |
| Serbian | 15 | 0.2% |
| Slavic | 4 | 0.1% |
| Slovak | 41 | 0.5% |
| Slovene | 36 | 0.5% |
| South American | 9 | 0.1% |
| Swedish | 625 | 7.9% |
| Swiss | 44 | 0.6% |
| Thai | 87 | 1.1% |
| Tlingit-Haida | 19 | 0.2% |
| Ukrainian | 20 | 0.3% |
| Welsh | 17 | 0.2% | View All 52 Rows |
Immigrants in Ashland
The most numerous immigrant groups reported in Ashland came from Asia (65 | 0.8%), India (50 | 0.6%), South Central Asia (50 | 0.6%), Europe (19 | 0.2%), and Italy (19 | 0.2%), together accounting for 2.6% of all Ashland residents.
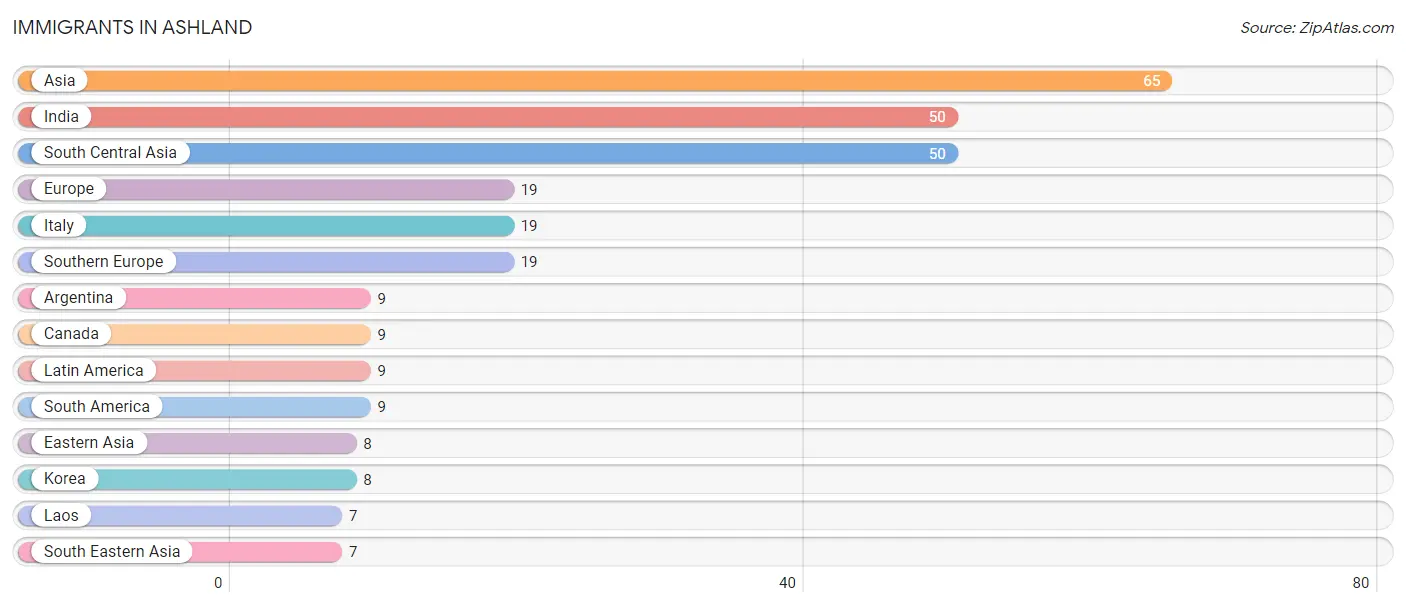
| Immigration Origin | # Population | % Population |
| Argentina | 9 | 0.1% |
| Asia | 65 | 0.8% |
| Canada | 9 | 0.1% |
| Eastern Asia | 8 | 0.1% |
| Europe | 19 | 0.2% |
| India | 50 | 0.6% |
| Italy | 19 | 0.2% |
| Korea | 8 | 0.1% |
| Laos | 7 | 0.1% |
| Latin America | 9 | 0.1% |
| South America | 9 | 0.1% |
| South Central Asia | 50 | 0.6% |
| South Eastern Asia | 7 | 0.1% |
| Southern Europe | 19 | 0.2% | View All 14 Rows |
Sex and Age in Ashland
Sex and Age in Ashland
The most populous age groups in Ashland are 15 to 19 Years (435 | 10.5%) for men and 20 to 24 Years (309 | 8.2%) for women.
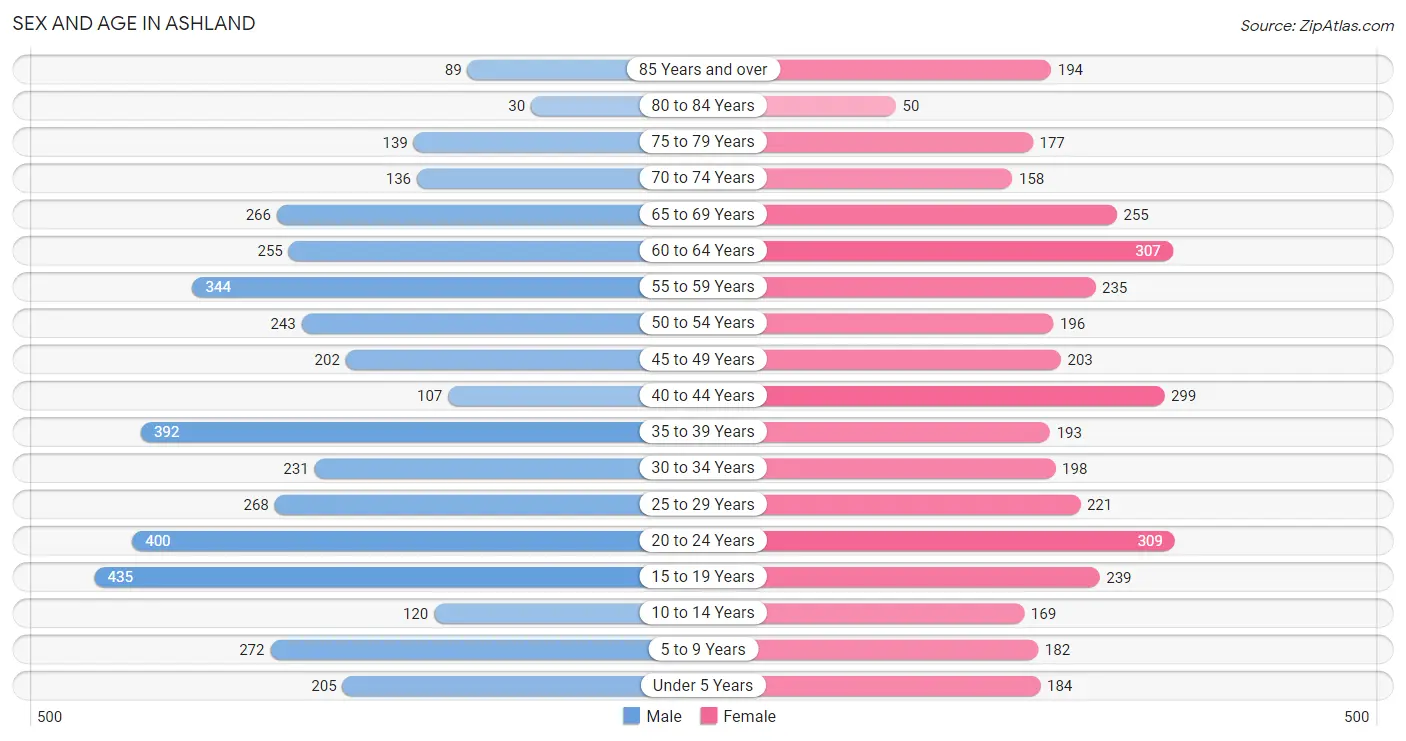
| Age Bracket | Male | Female |
| Under 5 Years | 205 (5.0%) | 184 (4.9%) |
| 5 to 9 Years | 272 (6.6%) | 182 (4.8%) |
| 10 to 14 Years | 120 (2.9%) | 169 (4.5%) |
| 15 to 19 Years | 435 (10.5%) | 239 (6.3%) |
| 20 to 24 Years | 400 (9.7%) | 309 (8.2%) |
| 25 to 29 Years | 268 (6.5%) | 221 (5.9%) |
| 30 to 34 Years | 231 (5.6%) | 198 (5.2%) |
| 35 to 39 Years | 392 (9.5%) | 193 (5.1%) |
| 40 to 44 Years | 107 (2.6%) | 299 (7.9%) |
| 45 to 49 Years | 202 (4.9%) | 203 (5.4%) |
| 50 to 54 Years | 243 (5.9%) | 196 (5.2%) |
| 55 to 59 Years | 344 (8.3%) | 235 (6.2%) |
| 60 to 64 Years | 255 (6.2%) | 307 (8.2%) |
| 65 to 69 Years | 266 (6.4%) | 255 (6.8%) |
| 70 to 74 Years | 136 (3.3%) | 158 (4.2%) |
| 75 to 79 Years | 139 (3.4%) | 177 (4.7%) |
| 80 to 84 Years | 30 (0.7%) | 50 (1.3%) |
| 85 Years and over | 89 (2.1%) | 194 (5.1%) |
| Total | 4,134 (100.0%) | 3,769 (100.0%) |
Families and Households in Ashland
Median Family Size in Ashland
The median family size in Ashland is 2.87 persons per family, with married-couple families (1,304 | 75.5%) accounting for the largest median family size of 2.9 persons per family. On the other hand, single male/father families (71 | 4.1%) represent the smallest median family size with 2.35 persons per family.
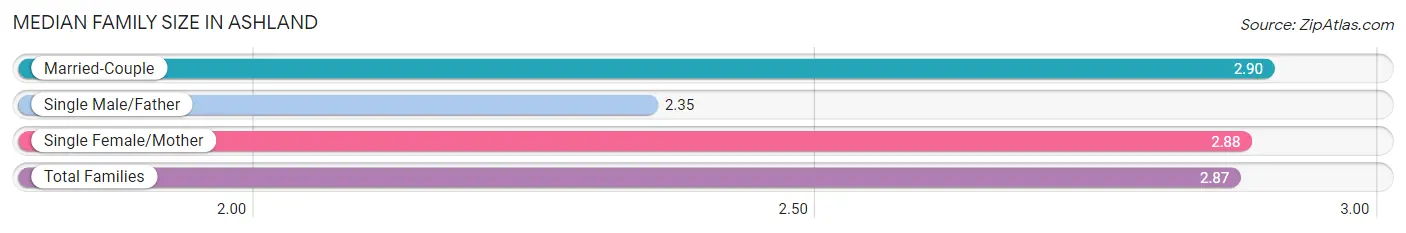
| Family Type | # Families | Family Size |
| Married-Couple | 1,304 (75.5%) | 2.90 |
| Single Male/Father | 71 (4.1%) | 2.35 |
| Single Female/Mother | 352 (20.4%) | 2.88 |
| Total Families | 1,727 (100.0%) | 2.87 |
Median Household Size in Ashland
The median household size in Ashland is 2.13 persons per household, with single female/mother households (352 | 10.2%) accounting for the largest median household size of 3.19 persons per household. non-family households (1,710 | 49.7%) represent the smallest median household size with 1.30 persons per household.
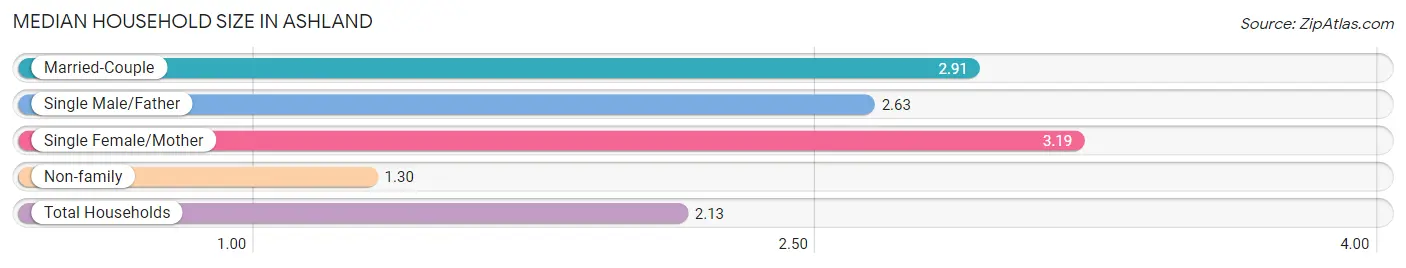
| Household Type | # Households | Household Size |
| Married-Couple | 1,304 (37.9%) | 2.91 |
| Single Male/Father | 71 (2.1%) | 2.63 |
| Single Female/Mother | 352 (10.2%) | 3.19 |
| Non-family | 1,710 (49.7%) | 1.30 |
| Total Households | 3,437 (100.0%) | 2.13 |
Household Size by Marriage Status in Ashland
Out of a total of 3,437 households in Ashland, 1,727 (50.2%) are family households, while 1,710 (49.7%) are nonfamily households. The most numerous type of family households are 2-person households, comprising 932, and the most common type of nonfamily households are 1-person households, comprising 1,333.
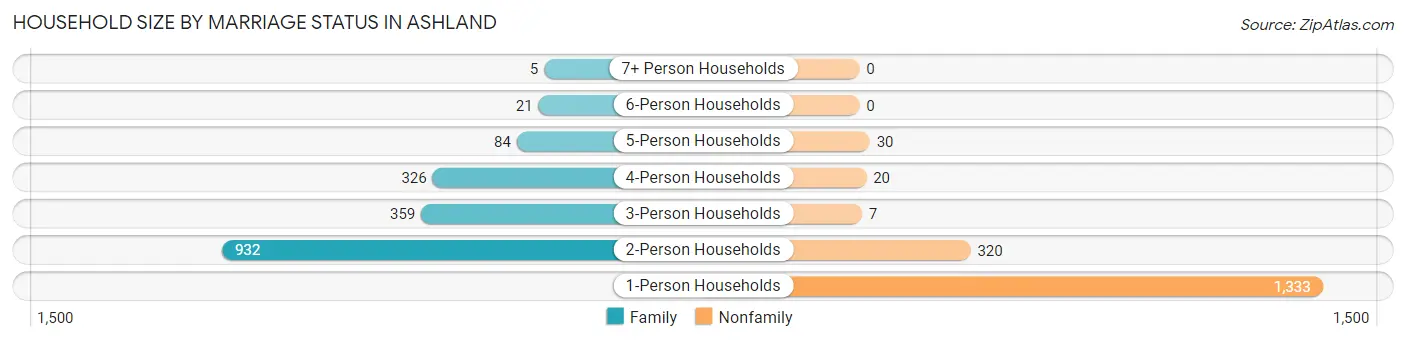
| Household Size | Family Households | Nonfamily Households |
| 1-Person Households | - | 1,333 (38.8%) |
| 2-Person Households | 932 (27.1%) | 320 (9.3%) |
| 3-Person Households | 359 (10.4%) | 7 (0.2%) |
| 4-Person Households | 326 (9.5%) | 20 (0.6%) |
| 5-Person Households | 84 (2.4%) | 30 (0.9%) |
| 6-Person Households | 21 (0.6%) | 0 (0.0%) |
| 7+ Person Households | 5 (0.2%) | 0 (0.0%) |
| Total | 1,727 (50.2%) | 1,710 (49.7%) |
Female Fertility in Ashland
Fertility by Age in Ashland
Average fertility rate in Ashland is 127.0 births per 1,000 women. Women in the age bracket of 35 to 50 years have the highest fertility rate with 158.0 births per 1,000 women. Women in the age bracket of 35 to 50 years acount for 52.8% of all women with births.
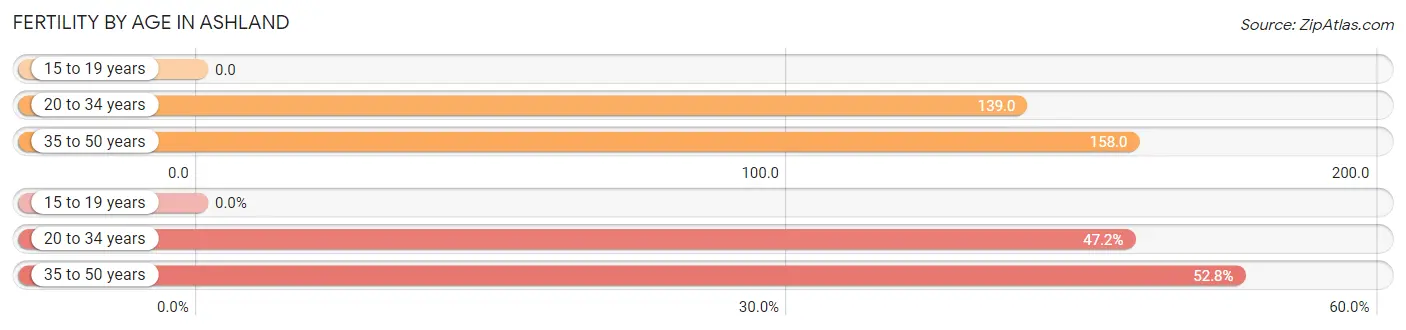
| Age Bracket | Women with Births | Births / 1,000 Women |
| 15 to 19 years | 0 (0.0%) | 0.0 |
| 20 to 34 years | 101 (47.2%) | 139.0 |
| 35 to 50 years | 113 (52.8%) | 158.0 |
| Total | 214 (100.0%) | 127.0 |
Fertility by Age by Marriage Status in Ashland
66.4% of women with births (214) in Ashland are married. The highest percentage of unmarried women with births falls into 20 to 34 years age bracket with 56.4% of them unmarried at the time of birth, while the lowest percentage of unmarried women with births belong to 35 to 50 years age bracket with 13.3% of them unmarried.
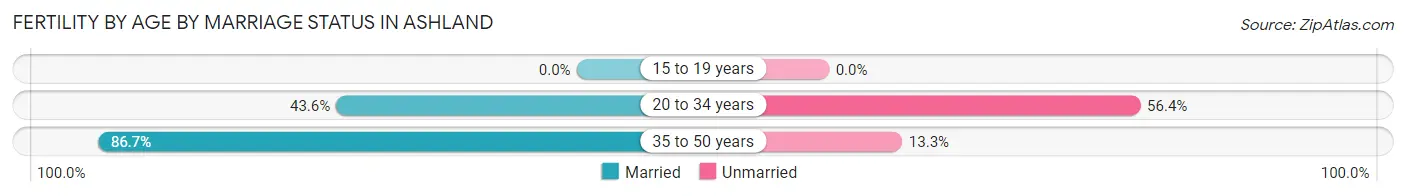
| Age Bracket | Married | Unmarried |
| 15 to 19 years | 0 (0.0%) | 0 (0.0%) |
| 20 to 34 years | 44 (43.6%) | 57 (56.4%) |
| 35 to 50 years | 98 (86.7%) | 15 (13.3%) |
| Total | 142 (66.4%) | 72 (33.6%) |
Fertility by Education in Ashland
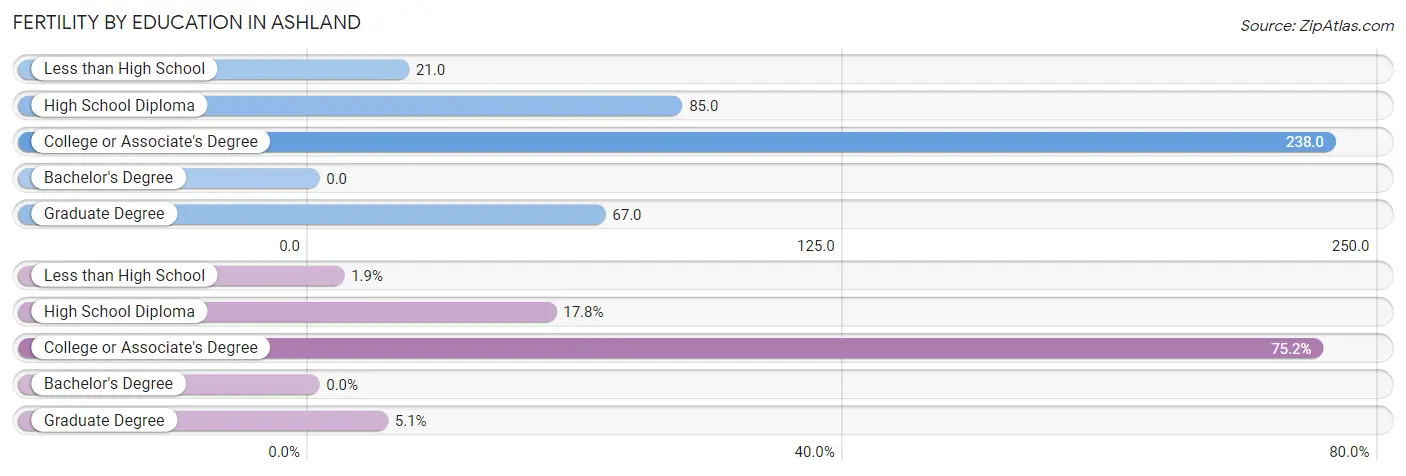
| Educational Attainment | Women with Births | Births / 1,000 Women |
| Less than High School | 4 (1.9%) | 21.0 |
| High School Diploma | 38 (17.8%) | 85.0 |
| College or Associate's Degree | 161 (75.2%) | 238.0 |
| Bachelor's Degree | 0 (0.0%) | 0.0 |
| Graduate Degree | 11 (5.1%) | 67.0 |
| Total | 214 (100.0%) | 127.0 |
Fertility by Education by Marriage Status in Ashland
33.6% of women with births in Ashland are unmarried. Women with the educational attainment of less than high school are most likely to be married with 100.0% of them married at childbirth, while women with the educational attainment of high school diploma are least likely to be married with 100.0% of them unmarried at childbirth.
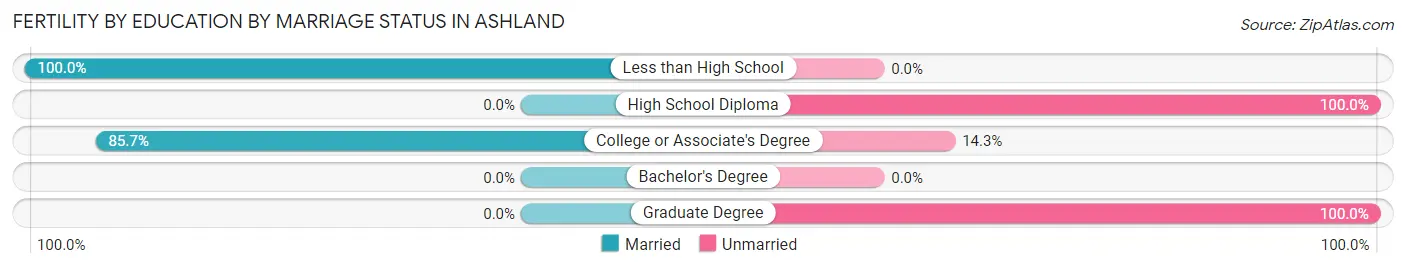
| Educational Attainment | Married | Unmarried |
| Less than High School | 4 (100.0%) | 0 (0.0%) |
| High School Diploma | 0 (0.0%) | 38 (100.0%) |
| College or Associate's Degree | 138 (85.7%) | 23 (14.3%) |
| Bachelor's Degree | 0 (0.0%) | 0 (0.0%) |
| Graduate Degree | 0 (0.0%) | 11 (100.0%) |
| Total | 142 (66.4%) | 72 (33.6%) |
Employment Characteristics in Ashland
Employment by Class of Employer in Ashland
Among the 3,974 employed individuals in Ashland, private company employees (2,644 | 66.5%), not-for-profit organizations (472 | 11.9%), and local government employees (370 | 9.3%) make up the most common classes of employment.
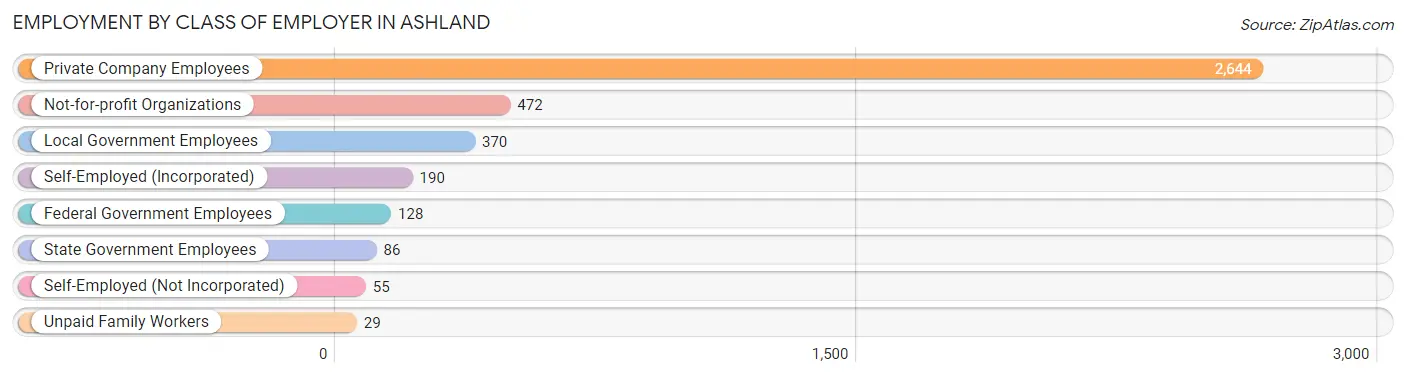
| Employer Class | # Employees | % Employees |
| Private Company Employees | 2,644 | 66.5% |
| Self-Employed (Incorporated) | 190 | 4.8% |
| Self-Employed (Not Incorporated) | 55 | 1.4% |
| Not-for-profit Organizations | 472 | 11.9% |
| Local Government Employees | 370 | 9.3% |
| State Government Employees | 86 | 2.2% |
| Federal Government Employees | 128 | 3.2% |
| Unpaid Family Workers | 29 | 0.7% |
| Total | 3,974 | 100.0% |
Employment Status by Age in Ashland
According to the labor force statistics for Ashland, out of the total population over 16 years of age (6,612), 63.5% or 4,199 individuals are in the labor force, with 3.8% or 160 of them unemployed. The age group with the highest labor force participation rate is 25 to 29 years, with 94.3% or 461 individuals in the labor force. Within the labor force, the 16 to 19 years age range has the highest percentage of unemployed individuals, with 21.0% or 54 of them being unemployed.
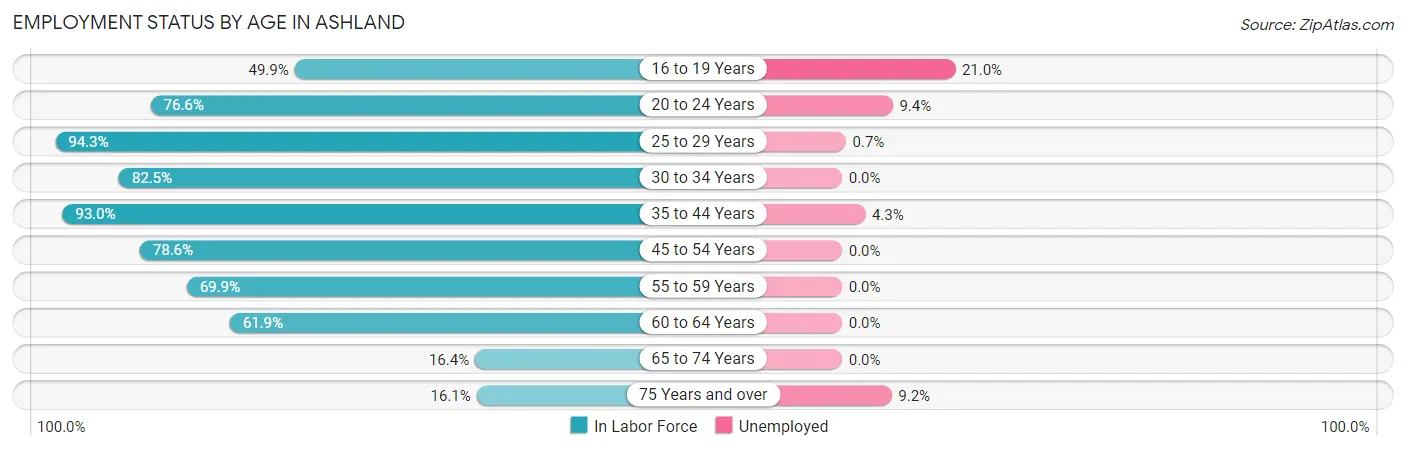
| Age Bracket | In Labor Force | Unemployed |
| 16 to 19 Years | 257 (49.9%) | 54 (21.0%) |
| 20 to 24 Years | 543 (76.6%) | 51 (9.4%) |
| 25 to 29 Years | 461 (94.3%) | 3 (0.7%) |
| 30 to 34 Years | 354 (82.5%) | 0 (0.0%) |
| 35 to 44 Years | 922 (93.0%) | 40 (4.3%) |
| 45 to 54 Years | 663 (78.6%) | 0 (0.0%) |
| 55 to 59 Years | 405 (69.9%) | 0 (0.0%) |
| 60 to 64 Years | 348 (61.9%) | 0 (0.0%) |
| 65 to 74 Years | 134 (16.4%) | 0 (0.0%) |
| 75 Years and over | 109 (16.1%) | 10 (9.2%) |
| Total | 4,199 (63.5%) | 160 (3.8%) |
Employment Status by Educational Attainment in Ashland
According to labor force statistics for Ashland, 81.0% of individuals (3,154) out of the total population between 25 and 64 years of age (3,894) are in the labor force, with 1.4% or 44 of them being unemployed. The group with the highest labor force participation rate are those with the educational attainment of bachelor's degree or higher, with 96.9% or 874 individuals in the labor force. Within the labor force, individuals with high school diploma education have the highest percentage of unemployment, with 3.8% or 39 of them being unemployed.

| Educational Attainment | In Labor Force | Unemployed |
| Less than High School | 52 (46.8%) | 2 (1.9%) |
| High School Diploma | 1,015 (77.1%) | 50 (3.8%) |
| College / Associate Degree | 1,213 (77.5%) | 3 (0.2%) |
| Bachelor's Degree or higher | 874 (96.9%) | 0 (0.0%) |
| Total | 3,154 (81.0%) | 55 (1.4%) |
Employment Occupations by Sex in Ashland
Management, Business, Science and Arts Occupations
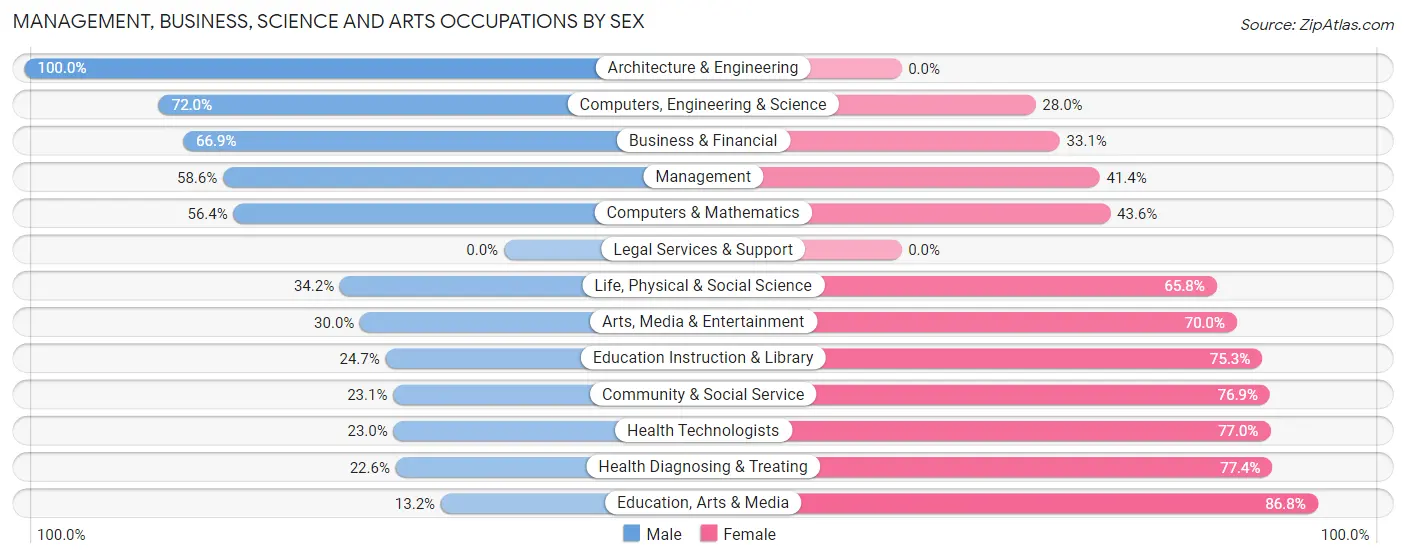
The most common Management, Business, Science and Arts occupations in Ashland are Management (418 | 10.3%), Community & Social Service (316 | 7.8%), Health Diagnosing & Treating (186 | 4.6%), Education Instruction & Library (170 | 4.2%), and Health Technologists (165 | 4.1%).
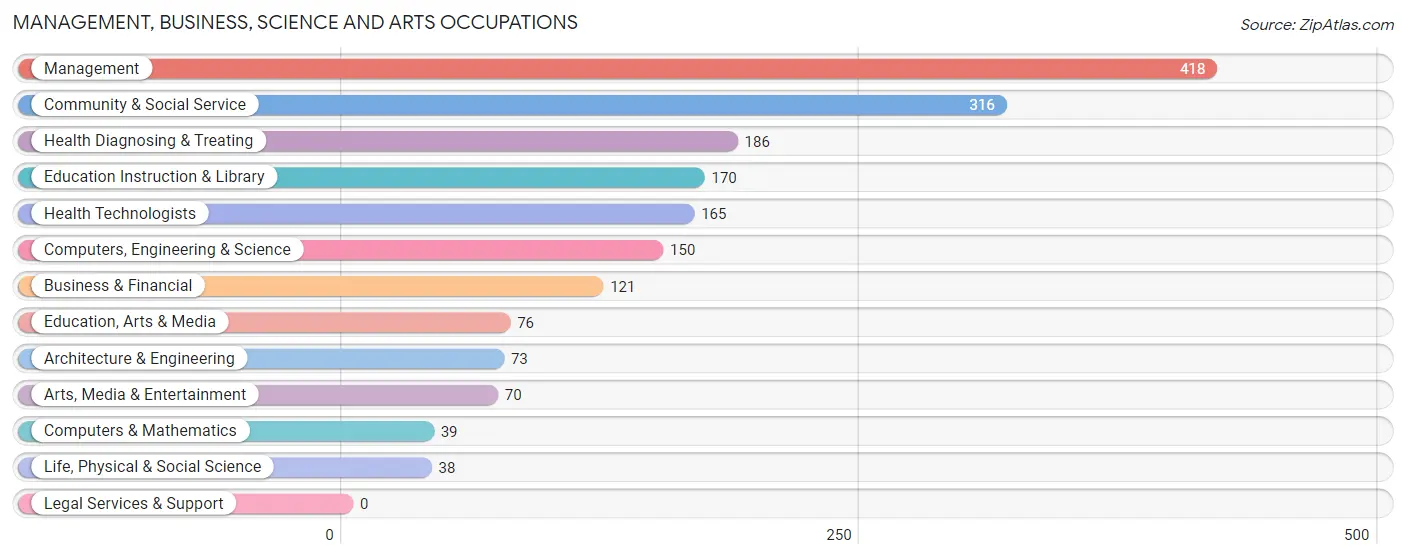
Management, Business, Science and Arts Occupations by Sex
Within the Management, Business, Science and Arts occupations in Ashland, the most male-oriented occupations are Architecture & Engineering (100.0%), Computers, Engineering & Science (72.0%), and Business & Financial (66.9%), while the most female-oriented occupations are Education, Arts & Media (86.8%), Health Diagnosing & Treating (77.4%), and Health Technologists (77.0%).
| Occupation | Male | Female |
| Management | 245 (58.6%) | 173 (41.4%) |
| Business & Financial | 81 (66.9%) | 40 (33.1%) |
| Computers, Engineering & Science | 108 (72.0%) | 42 (28.0%) |
| Computers & Mathematics | 22 (56.4%) | 17 (43.6%) |
| Architecture & Engineering | 73 (100.0%) | 0 (0.0%) |
| Life, Physical & Social Science | 13 (34.2%) | 25 (65.8%) |
| Community & Social Service | 73 (23.1%) | 243 (76.9%) |
| Education, Arts & Media | 10 (13.2%) | 66 (86.8%) |
| Legal Services & Support | 0 (0.0%) | 0 (0.0%) |
| Education Instruction & Library | 42 (24.7%) | 128 (75.3%) |
| Arts, Media & Entertainment | 21 (30.0%) | 49 (70.0%) |
| Health Diagnosing & Treating | 42 (22.6%) | 144 (77.4%) |
| Health Technologists | 38 (23.0%) | 127 (77.0%) |
| Total (Category) | 549 (46.1%) | 642 (53.9%) |
| Total (Overall) | 2,165 (53.6%) | 1,873 (46.4%) |
Services Occupations
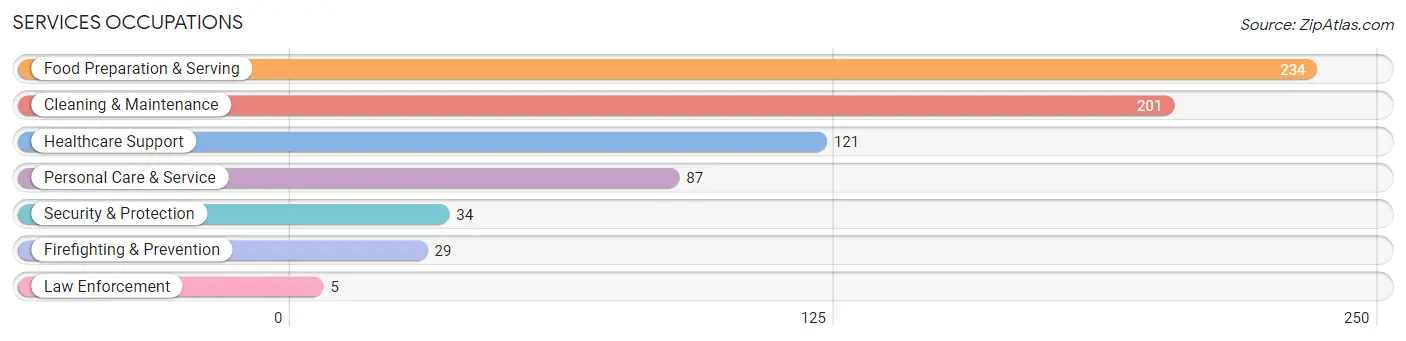
The most common Services occupations in Ashland are Food Preparation & Serving (234 | 5.8%), Cleaning & Maintenance (201 | 5.0%), Healthcare Support (121 | 3.0%), Personal Care & Service (87 | 2.1%), and Security & Protection (34 | 0.8%).
Services Occupations by Sex
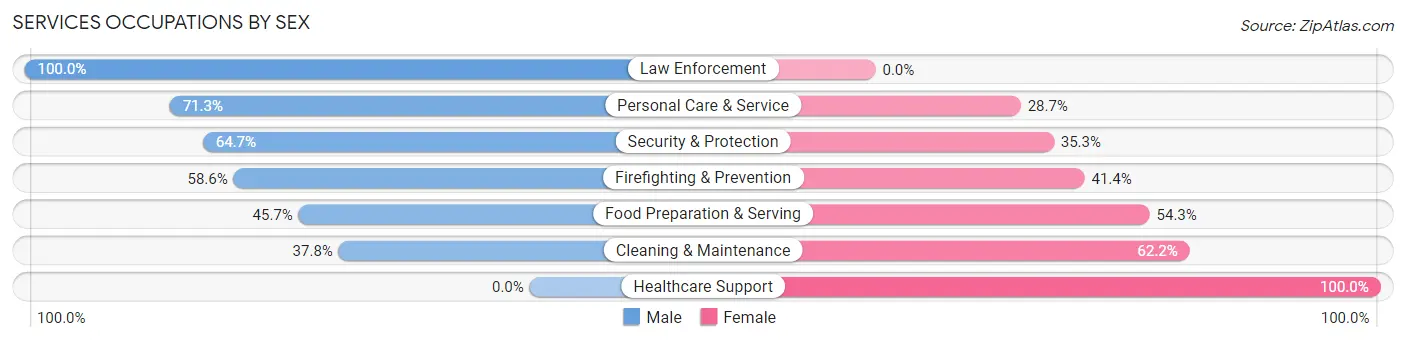
Within the Services occupations in Ashland, the most male-oriented occupations are Law Enforcement (100.0%), Personal Care & Service (71.3%), and Security & Protection (64.7%), while the most female-oriented occupations are Healthcare Support (100.0%), Cleaning & Maintenance (62.2%), and Food Preparation & Serving (54.3%).
| Occupation | Male | Female |
| Healthcare Support | 0 (0.0%) | 121 (100.0%) |
| Security & Protection | 22 (64.7%) | 12 (35.3%) |
| Firefighting & Prevention | 17 (58.6%) | 12 (41.4%) |
| Law Enforcement | 5 (100.0%) | 0 (0.0%) |
| Food Preparation & Serving | 107 (45.7%) | 127 (54.3%) |
| Cleaning & Maintenance | 76 (37.8%) | 125 (62.2%) |
| Personal Care & Service | 62 (71.3%) | 25 (28.7%) |
| Total (Category) | 267 (39.4%) | 410 (60.6%) |
| Total (Overall) | 2,165 (53.6%) | 1,873 (46.4%) |
Sales and Office Occupations
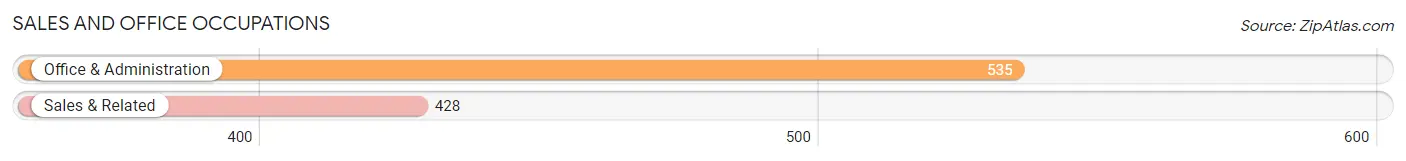
The most common Sales and Office occupations in Ashland are Office & Administration (535 | 13.3%), and Sales & Related (428 | 10.6%).
Sales and Office Occupations by Sex
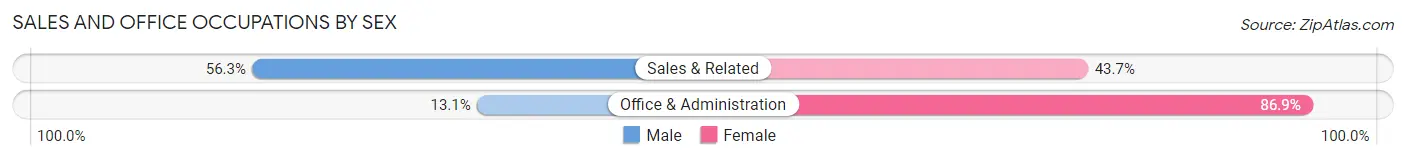
| Occupation | Male | Female |
| Sales & Related | 241 (56.3%) | 187 (43.7%) |
| Office & Administration | 70 (13.1%) | 465 (86.9%) |
| Total (Category) | 311 (32.3%) | 652 (67.7%) |
| Total (Overall) | 2,165 (53.6%) | 1,873 (46.4%) |
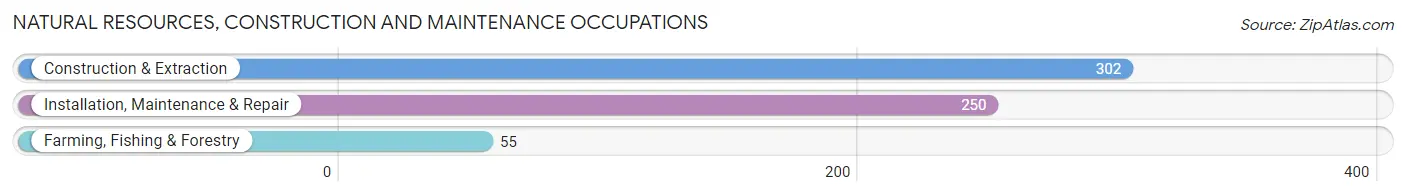
Natural Resources, Construction and Maintenance Occupations
The most common Natural Resources, Construction and Maintenance occupations in Ashland are Construction & Extraction (302 | 7.5%), Installation, Maintenance & Repair (250 | 6.2%), and Farming, Fishing & Forestry (55 | 1.4%).
Natural Resources, Construction and Maintenance Occupations by Sex
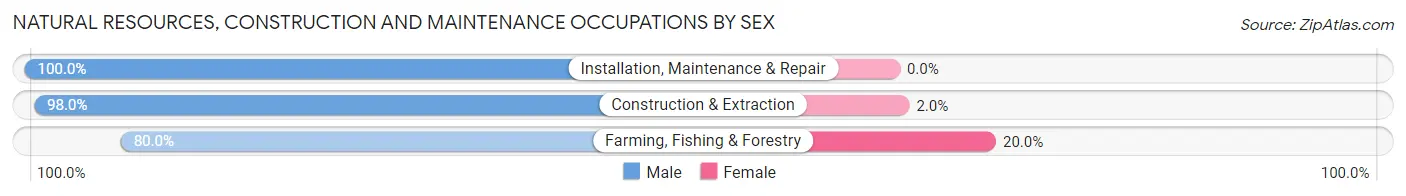
| Occupation | Male | Female |
| Farming, Fishing & Forestry | 44 (80.0%) | 11 (20.0%) |
| Construction & Extraction | 296 (98.0%) | 6 (2.0%) |
| Installation, Maintenance & Repair | 250 (100.0%) | 0 (0.0%) |
| Total (Category) | 590 (97.2%) | 17 (2.8%) |
| Total (Overall) | 2,165 (53.6%) | 1,873 (46.4%) |
Production, Transportation and Moving Occupations
The most common Production, Transportation and Moving occupations in Ashland are Production (273 | 6.8%), Material Moving (221 | 5.5%), and Transportation (106 | 2.6%).
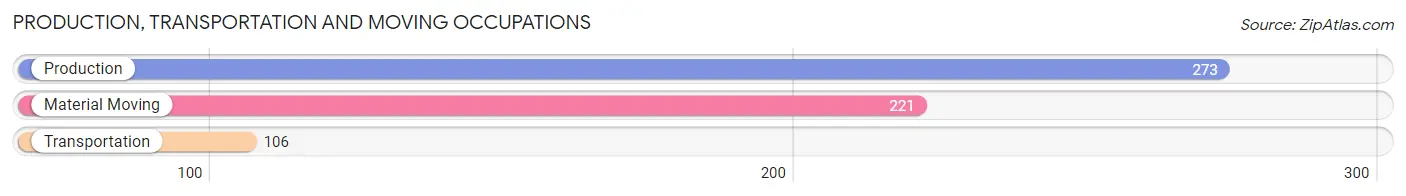
Production, Transportation and Moving Occupations by Sex
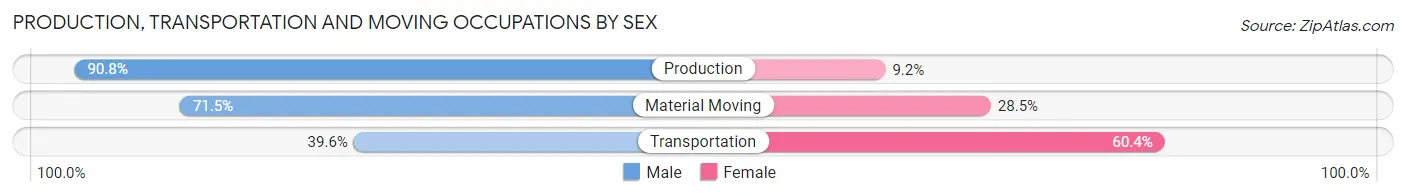
| Occupation | Male | Female |
| Production | 248 (90.8%) | 25 (9.2%) |
| Transportation | 42 (39.6%) | 64 (60.4%) |
| Material Moving | 158 (71.5%) | 63 (28.5%) |
| Total (Category) | 448 (74.7%) | 152 (25.3%) |
| Total (Overall) | 2,165 (53.6%) | 1,873 (46.4%) |
Employment Industries by Sex in Ashland
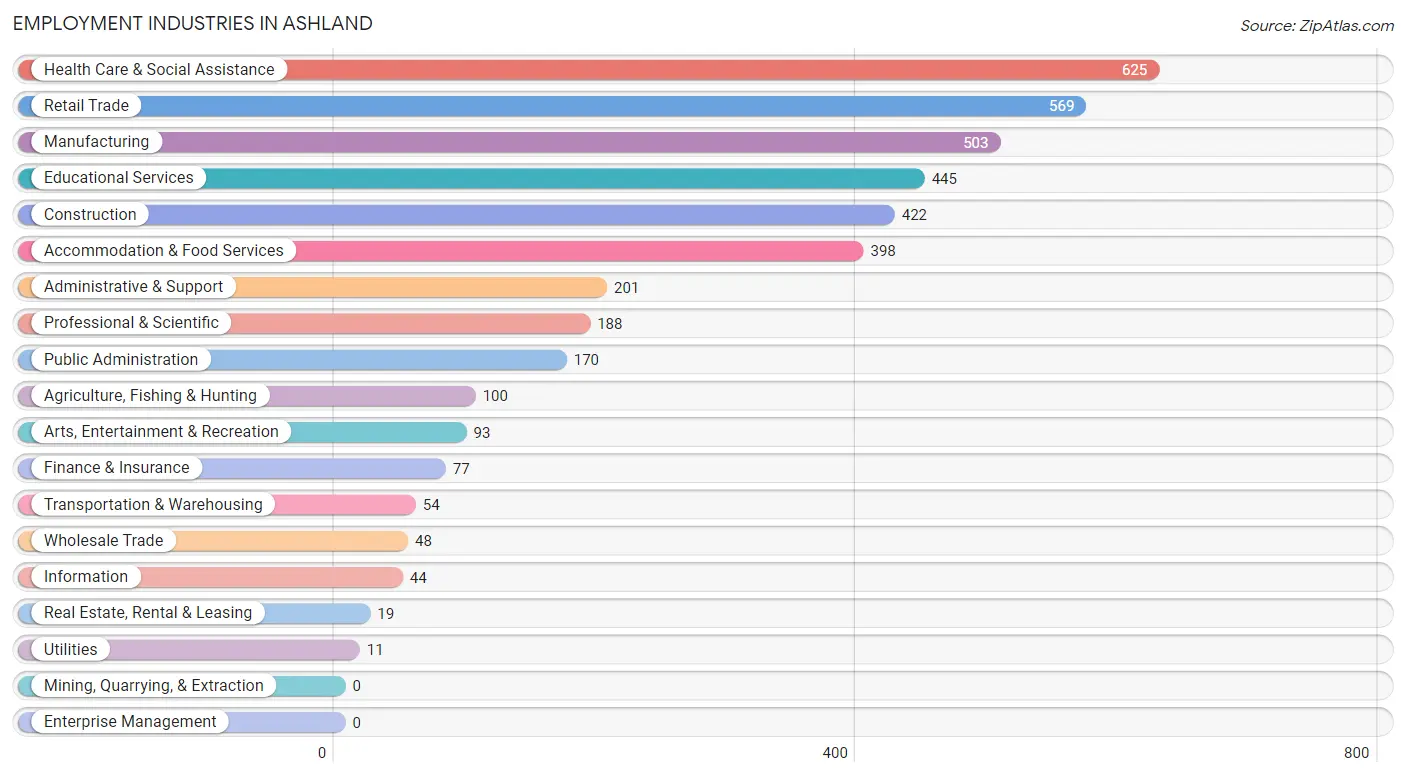
Employment Industries in Ashland
The major employment industries in Ashland include Health Care & Social Assistance (625 | 15.5%), Retail Trade (569 | 14.1%), Manufacturing (503 | 12.5%), Educational Services (445 | 11.0%), and Construction (422 | 10.4%).
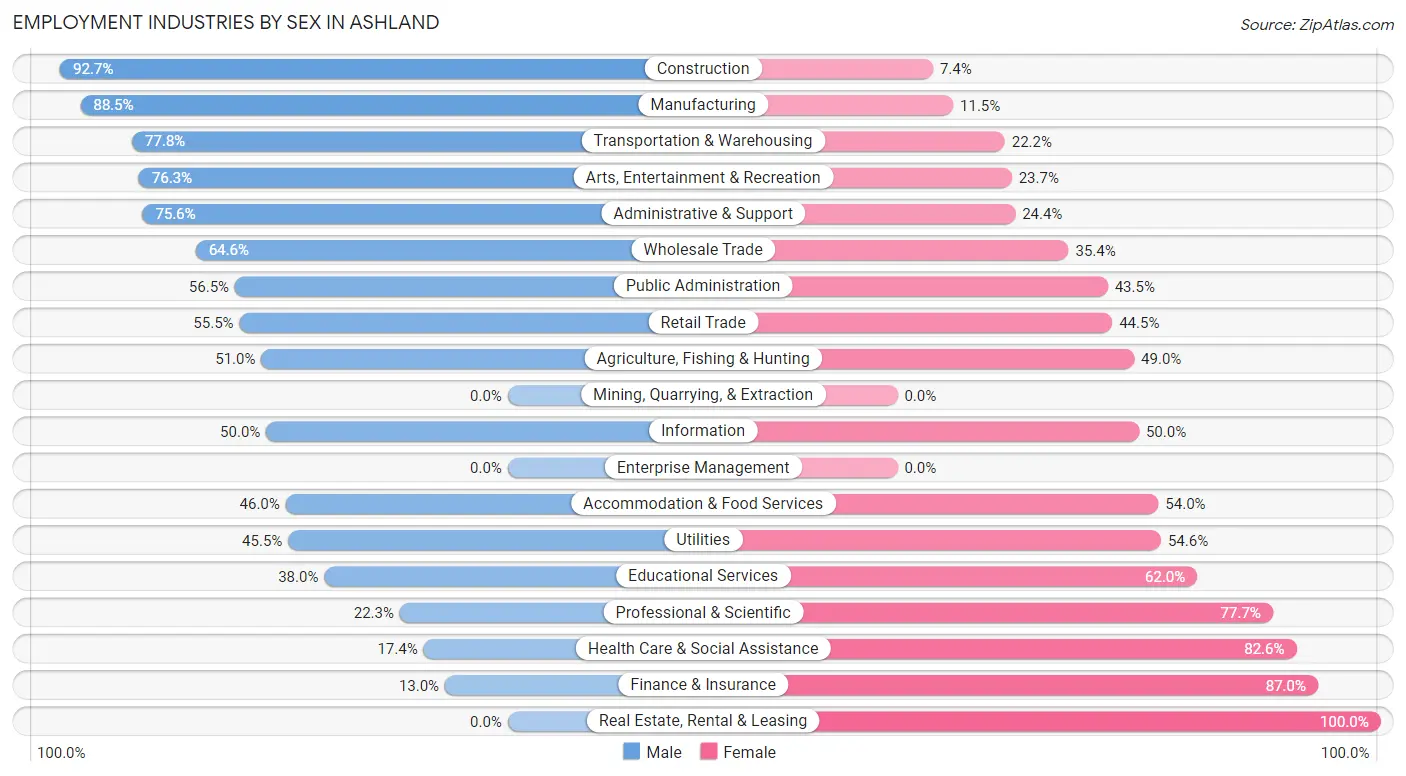
Employment Industries by Sex in Ashland
The Ashland industries that see more men than women are Construction (92.6%), Manufacturing (88.5%), and Transportation & Warehousing (77.8%), whereas the industries that tend to have a higher number of women are Real Estate, Rental & Leasing (100.0%), Finance & Insurance (87.0%), and Health Care & Social Assistance (82.6%).
| Industry | Male | Female |
| Agriculture, Fishing & Hunting | 51 (51.0%) | 49 (49.0%) |
| Mining, Quarrying, & Extraction | 0 (0.0%) | 0 (0.0%) |
| Construction | 391 (92.6%) | 31 (7.3%) |
| Manufacturing | 445 (88.5%) | 58 (11.5%) |
| Wholesale Trade | 31 (64.6%) | 17 (35.4%) |
| Retail Trade | 316 (55.5%) | 253 (44.5%) |
| Transportation & Warehousing | 42 (77.8%) | 12 (22.2%) |
| Utilities | 5 (45.5%) | 6 (54.5%) |
| Information | 22 (50.0%) | 22 (50.0%) |
| Finance & Insurance | 10 (13.0%) | 67 (87.0%) |
| Real Estate, Rental & Leasing | 0 (0.0%) | 19 (100.0%) |
| Professional & Scientific | 42 (22.3%) | 146 (77.7%) |
| Enterprise Management | 0 (0.0%) | 0 (0.0%) |
| Administrative & Support | 152 (75.6%) | 49 (24.4%) |
| Educational Services | 169 (38.0%) | 276 (62.0%) |
| Health Care & Social Assistance | 109 (17.4%) | 516 (82.6%) |
| Arts, Entertainment & Recreation | 71 (76.3%) | 22 (23.7%) |
| Accommodation & Food Services | 183 (46.0%) | 215 (54.0%) |
| Public Administration | 96 (56.5%) | 74 (43.5%) |
| Total | 2,165 (53.6%) | 1,873 (46.4%) |
Education in Ashland
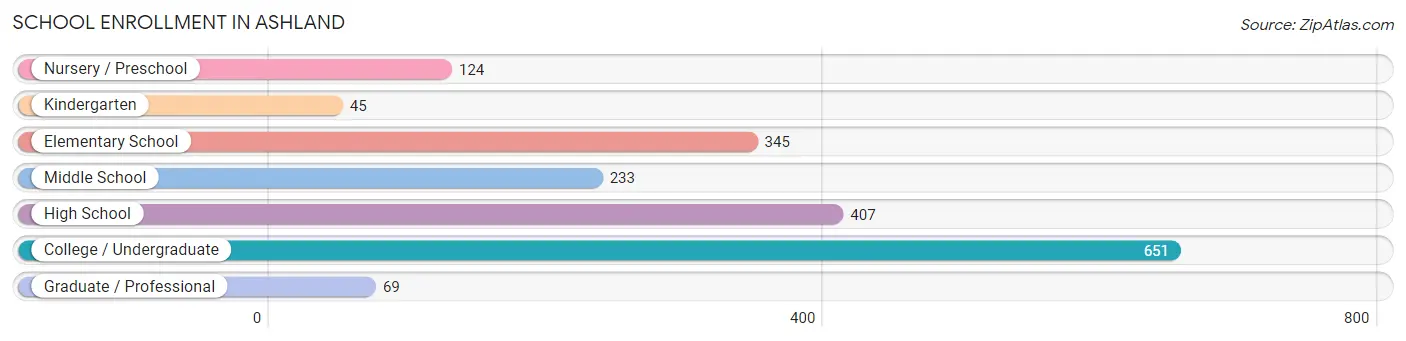
School Enrollment in Ashland
The most common levels of schooling among the 1,874 students in Ashland are college / undergraduate (651 | 34.7%), high school (407 | 21.7%), and elementary school (345 | 18.4%).
| School Level | # Students | % Students |
| Nursery / Preschool | 124 | 6.6% |
| Kindergarten | 45 | 2.4% |
| Elementary School | 345 | 18.4% |
| Middle School | 233 | 12.4% |
| High School | 407 | 21.7% |
| College / Undergraduate | 651 | 34.7% |
| Graduate / Professional | 69 | 3.7% |
| Total | 1,874 | 100.0% |
School Enrollment by Age by Funding Source in Ashland
Out of a total of 1,874 students who are enrolled in schools in Ashland, 647 (34.5%) attend a private institution, while the remaining 1,227 (65.5%) are enrolled in public schools. The age group of 20 to 24 year olds has the highest likelihood of being enrolled in private schools, with 358 (90.6% in the age bracket) enrolled. Conversely, the age group of 10 to 14 year olds has the lowest likelihood of being enrolled in a private school, with 275 (95.2% in the age bracket) attending a public institution.
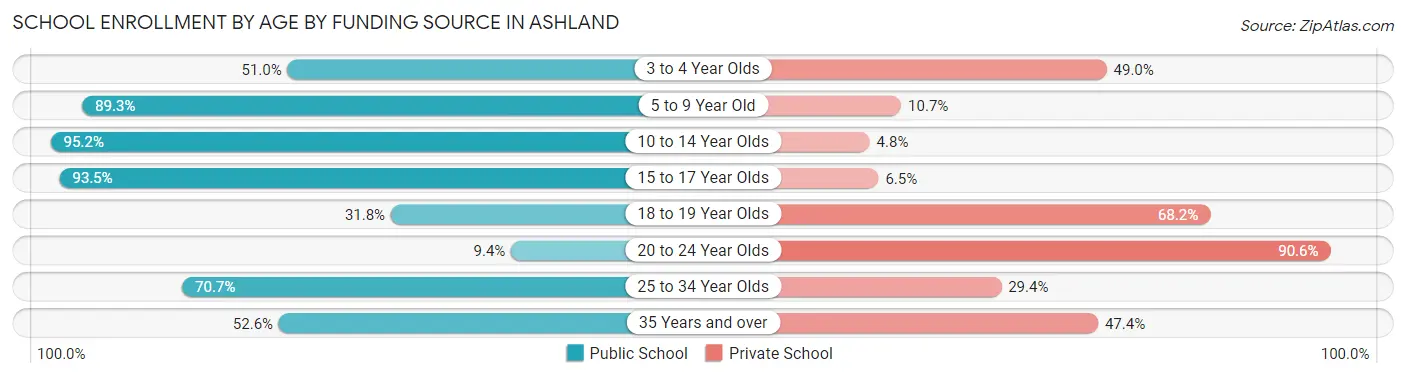
| Age Bracket | Public School | Private School |
| 3 to 4 Year Olds | 25 (51.0%) | 24 (49.0%) |
| 5 to 9 Year Old | 400 (89.3%) | 48 (10.7%) |
| 10 to 14 Year Olds | 275 (95.2%) | 14 (4.8%) |
| 15 to 17 Year Olds | 332 (93.5%) | 23 (6.5%) |
| 18 to 19 Year Olds | 54 (31.8%) | 116 (68.2%) |
| 20 to 24 Year Olds | 37 (9.4%) | 358 (90.6%) |
| 25 to 34 Year Olds | 65 (70.7%) | 27 (29.3%) |
| 35 Years and over | 40 (52.6%) | 36 (47.4%) |
| Total | 1,227 (65.5%) | 647 (34.5%) |
Educational Attainment by Field of Study in Ashland
Business (270 | 19.4%), education (215 | 15.4%), science & technology (171 | 12.3%), social sciences (123 | 8.8%), and arts & humanities (111 | 8.0%) are the most common fields of study among 1,394 individuals in Ashland who have obtained a bachelor's degree or higher.
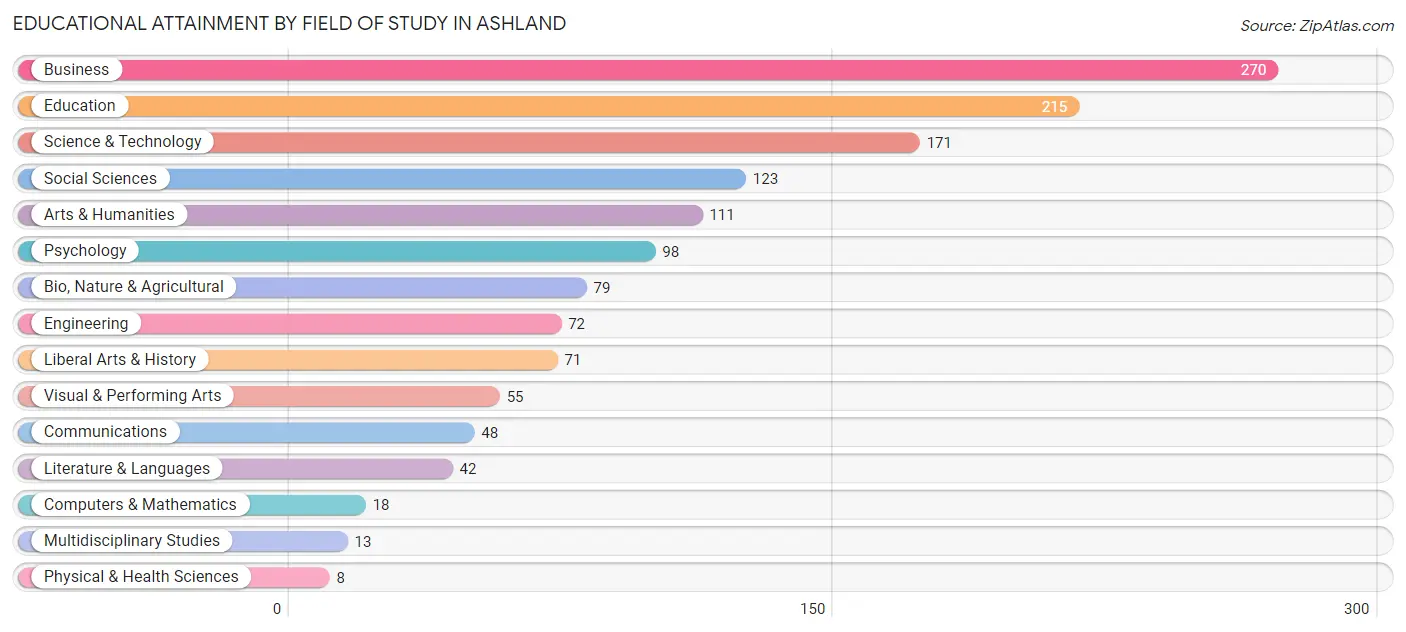
| Field of Study | # Graduates | % Graduates |
| Computers & Mathematics | 18 | 1.3% |
| Bio, Nature & Agricultural | 79 | 5.7% |
| Physical & Health Sciences | 8 | 0.6% |
| Psychology | 98 | 7.0% |
| Social Sciences | 123 | 8.8% |
| Engineering | 72 | 5.2% |
| Multidisciplinary Studies | 13 | 0.9% |
| Science & Technology | 171 | 12.3% |
| Business | 270 | 19.4% |
| Education | 215 | 15.4% |
| Literature & Languages | 42 | 3.0% |
| Liberal Arts & History | 71 | 5.1% |
| Visual & Performing Arts | 55 | 4.0% |
| Communications | 48 | 3.4% |
| Arts & Humanities | 111 | 8.0% |
| Total | 1,394 | 100.0% |
Transportation & Commute in Ashland
Vehicle Availability by Sex in Ashland
The most prevalent vehicle ownership categories in Ashland are males with 2 vehicles (1,082, accounting for 53.7%) and females with 2 vehicles (897, making up 62.0%).
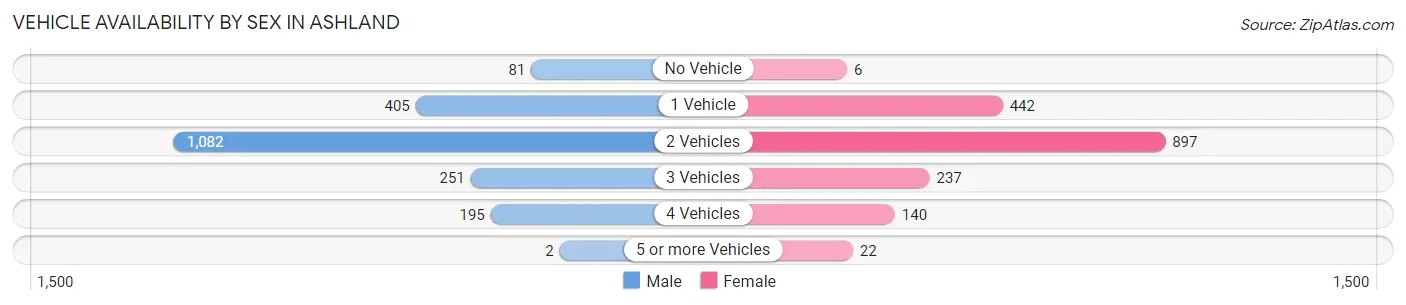
| Vehicles Available | Male | Female |
| No Vehicle | 81 (4.0%) | 6 (0.3%) |
| 1 Vehicle | 405 (20.1%) | 442 (25.3%) |
| 2 Vehicles | 1,082 (53.7%) | 897 (51.4%) |
| 3 Vehicles | 251 (12.4%) | 237 (13.6%) |
| 4 Vehicles | 195 (9.7%) | 140 (8.0%) |
| 5 or more Vehicles | 2 (0.1%) | 22 (1.3%) |
| Total | 2,016 (100.0%) | 1,744 (100.0%) |
Commute Time in Ashland
The most frequently occuring commute durations in Ashland are 5 to 9 minutes (1,436 commuters, 38.7%), 10 to 14 minutes (758 commuters, 20.4%), and less than 5 minutes (390 commuters, 10.5%).
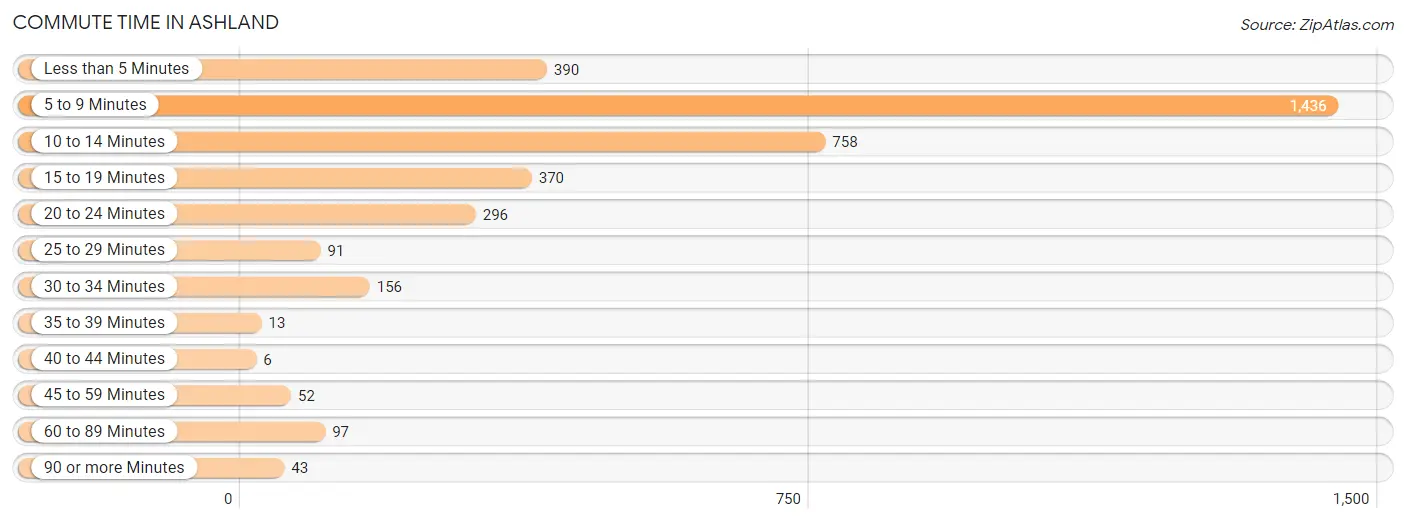
| Commute Time | # Commuters | % Commuters |
| Less than 5 Minutes | 390 | 10.5% |
| 5 to 9 Minutes | 1,436 | 38.7% |
| 10 to 14 Minutes | 758 | 20.4% |
| 15 to 19 Minutes | 370 | 10.0% |
| 20 to 24 Minutes | 296 | 8.0% |
| 25 to 29 Minutes | 91 | 2.5% |
| 30 to 34 Minutes | 156 | 4.2% |
| 35 to 39 Minutes | 13 | 0.4% |
| 40 to 44 Minutes | 6 | 0.2% |
| 45 to 59 Minutes | 52 | 1.4% |
| 60 to 89 Minutes | 97 | 2.6% |
| 90 or more Minutes | 43 | 1.2% |
Commute Time by Sex in Ashland
The most common commute times in Ashland are 5 to 9 minutes (644 commuters, 32.2%) for males and 5 to 9 minutes (792 commuters, 46.4%) for females.
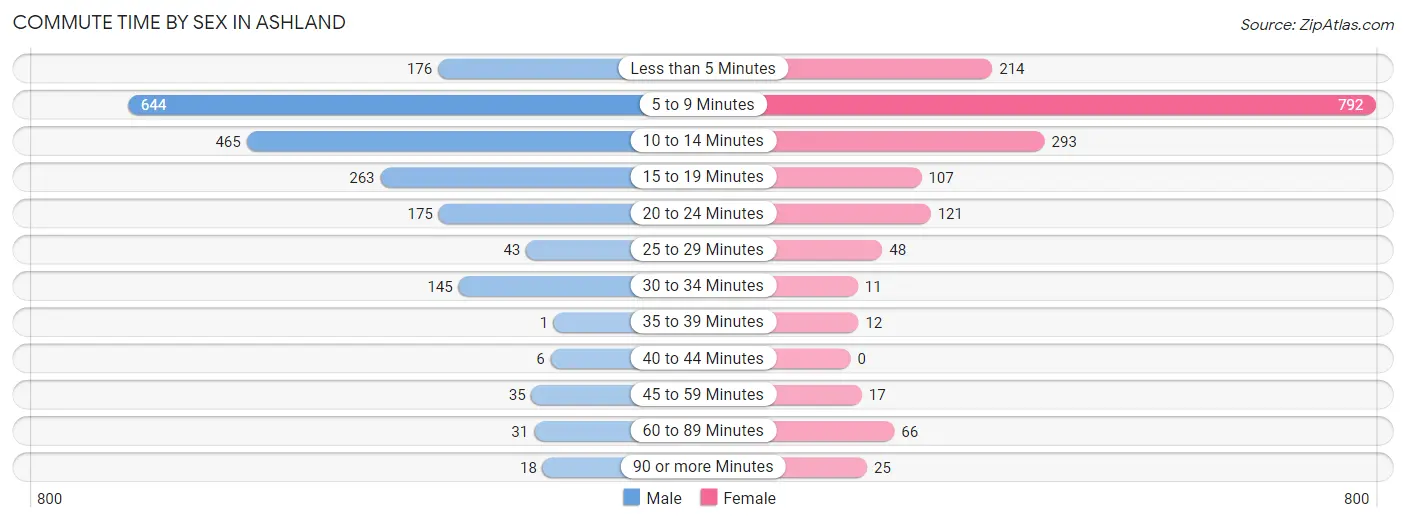
| Commute Time | Male | Female |
| Less than 5 Minutes | 176 (8.8%) | 214 (12.5%) |
| 5 to 9 Minutes | 644 (32.2%) | 792 (46.4%) |
| 10 to 14 Minutes | 465 (23.2%) | 293 (17.2%) |
| 15 to 19 Minutes | 263 (13.1%) | 107 (6.3%) |
| 20 to 24 Minutes | 175 (8.7%) | 121 (7.1%) |
| 25 to 29 Minutes | 43 (2.1%) | 48 (2.8%) |
| 30 to 34 Minutes | 145 (7.2%) | 11 (0.6%) |
| 35 to 39 Minutes | 1 (0.1%) | 12 (0.7%) |
| 40 to 44 Minutes | 6 (0.3%) | 0 (0.0%) |
| 45 to 59 Minutes | 35 (1.8%) | 17 (1.0%) |
| 60 to 89 Minutes | 31 (1.5%) | 66 (3.9%) |
| 90 or more Minutes | 18 (0.9%) | 25 (1.5%) |
Time of Departure to Work by Sex in Ashland
The most frequent times of departure to work in Ashland are 6:30 AM to 6:59 AM (361, 18.0%) for males and 7:30 AM to 7:59 AM (388, 22.7%) for females.
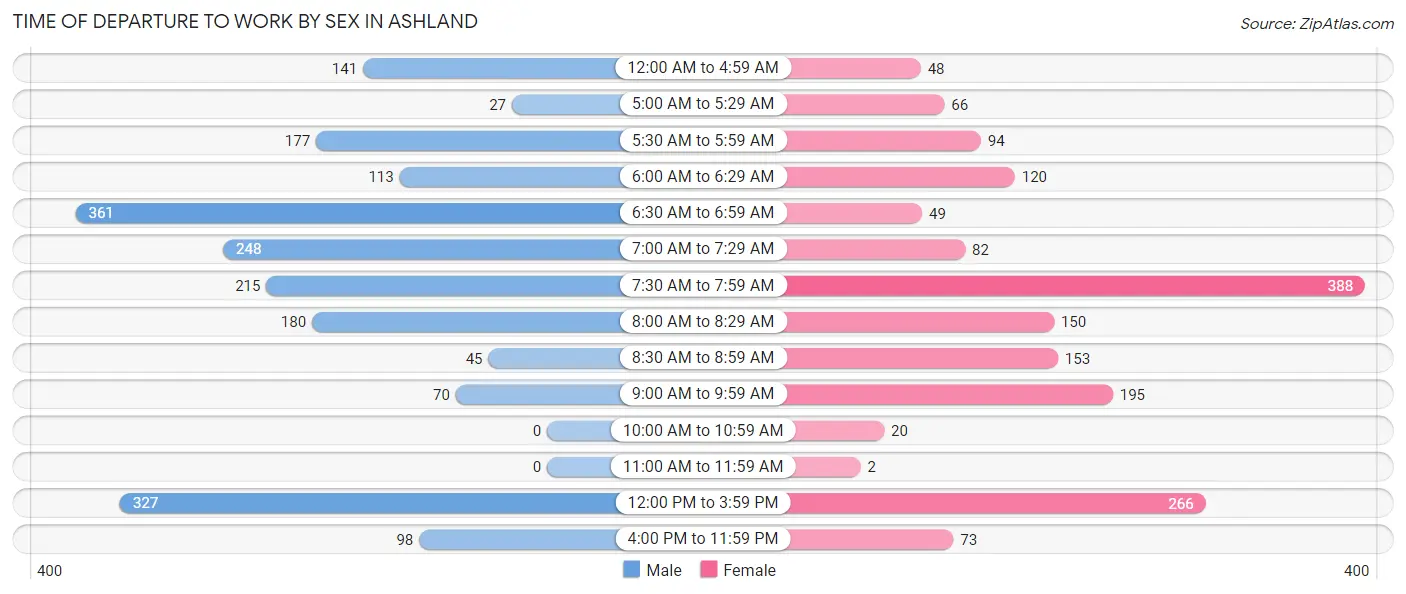
| Time of Departure | Male | Female |
| 12:00 AM to 4:59 AM | 141 (7.0%) | 48 (2.8%) |
| 5:00 AM to 5:29 AM | 27 (1.3%) | 66 (3.9%) |
| 5:30 AM to 5:59 AM | 177 (8.8%) | 94 (5.5%) |
| 6:00 AM to 6:29 AM | 113 (5.6%) | 120 (7.0%) |
| 6:30 AM to 6:59 AM | 361 (18.0%) | 49 (2.9%) |
| 7:00 AM to 7:29 AM | 248 (12.4%) | 82 (4.8%) |
| 7:30 AM to 7:59 AM | 215 (10.7%) | 388 (22.7%) |
| 8:00 AM to 8:29 AM | 180 (9.0%) | 150 (8.8%) |
| 8:30 AM to 8:59 AM | 45 (2.2%) | 153 (9.0%) |
| 9:00 AM to 9:59 AM | 70 (3.5%) | 195 (11.4%) |
| 10:00 AM to 10:59 AM | 0 (0.0%) | 20 (1.2%) |
| 11:00 AM to 11:59 AM | 0 (0.0%) | 2 (0.1%) |
| 12:00 PM to 3:59 PM | 327 (16.3%) | 266 (15.6%) |
| 4:00 PM to 11:59 PM | 98 (4.9%) | 73 (4.3%) |
| Total | 2,002 (100.0%) | 1,706 (100.0%) |
Housing Occupancy in Ashland
Occupancy by Ownership in Ashland
Of the total 3,437 dwellings in Ashland, owner-occupied units account for 2,097 (61.0%), while renter-occupied units make up 1,340 (39.0%).
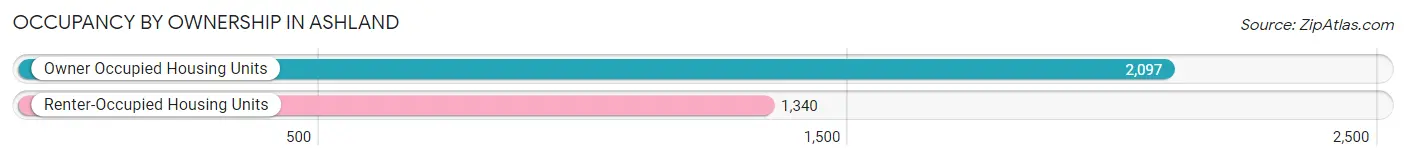
| Occupancy | # Housing Units | % Housing Units |
| Owner Occupied Housing Units | 2,097 | 61.0% |
| Renter-Occupied Housing Units | 1,340 | 39.0% |
| Total Occupied Housing Units | 3,437 | 100.0% |
Occupancy by Household Size in Ashland
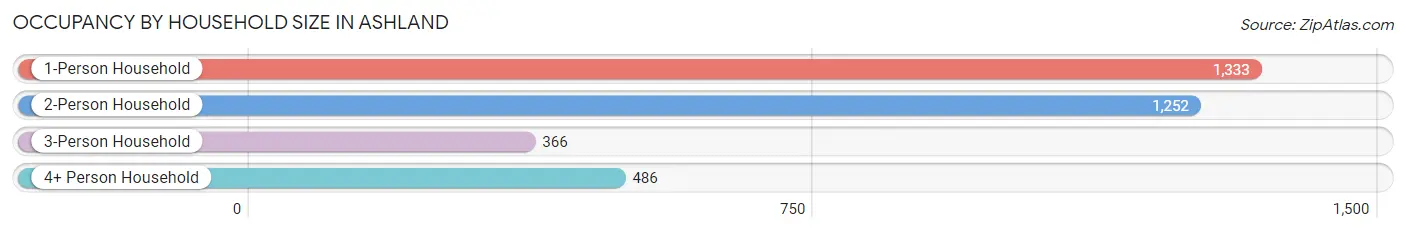
| Household Size | # Housing Units | % Housing Units |
| 1-Person Household | 1,333 | 38.8% |
| 2-Person Household | 1,252 | 36.4% |
| 3-Person Household | 366 | 10.6% |
| 4+ Person Household | 486 | 14.1% |
| Total Housing Units | 3,437 | 100.0% |
Occupancy by Ownership by Household Size in Ashland
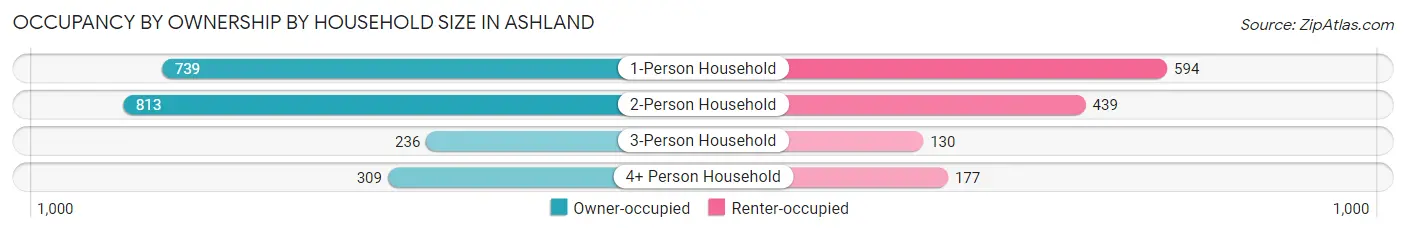
| Household Size | Owner-occupied | Renter-occupied |
| 1-Person Household | 739 (55.4%) | 594 (44.6%) |
| 2-Person Household | 813 (64.9%) | 439 (35.1%) |
| 3-Person Household | 236 (64.5%) | 130 (35.5%) |
| 4+ Person Household | 309 (63.6%) | 177 (36.4%) |
| Total Housing Units | 2,097 (61.0%) | 1,340 (39.0%) |
Occupancy by Educational Attainment in Ashland
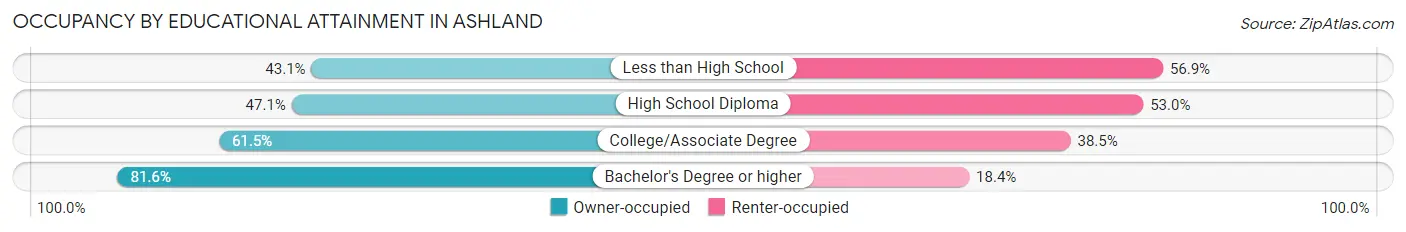
| Household Size | Owner-occupied | Renter-occupied |
| Less than High School | 22 (43.1%) | 29 (56.9%) |
| High School Diploma | 575 (47.0%) | 647 (52.9%) |
| College/Associate Degree | 810 (61.5%) | 508 (38.5%) |
| Bachelor's Degree or higher | 690 (81.6%) | 156 (18.4%) |
Occupancy by Age of Householder in Ashland
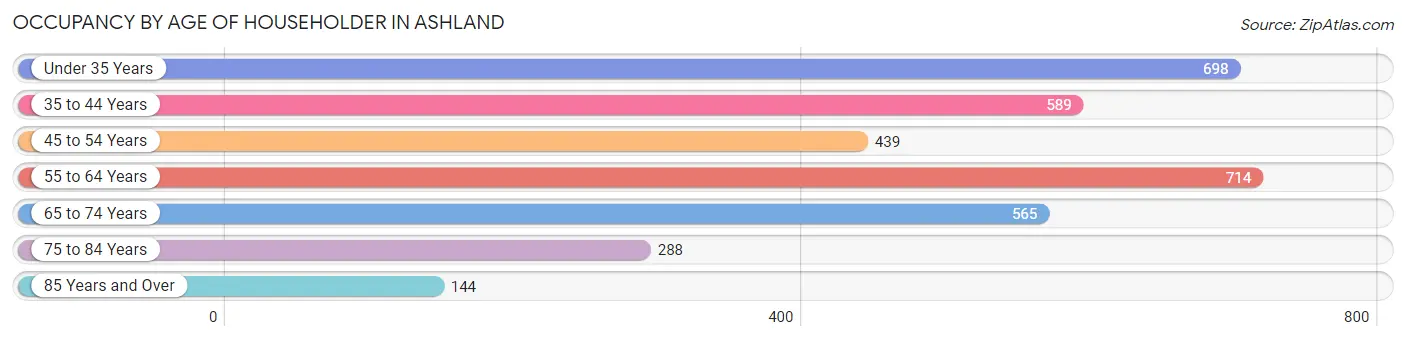
| Age Bracket | # Households | % Households |
| Under 35 Years | 698 | 20.3% |
| 35 to 44 Years | 589 | 17.1% |
| 45 to 54 Years | 439 | 12.8% |
| 55 to 64 Years | 714 | 20.8% |
| 65 to 74 Years | 565 | 16.4% |
| 75 to 84 Years | 288 | 8.4% |
| 85 Years and Over | 144 | 4.2% |
| Total | 3,437 | 100.0% |
Housing Finances in Ashland
Median Income by Occupancy in Ashland
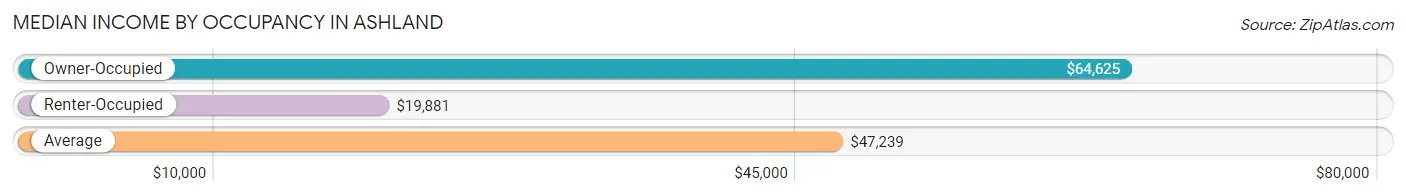
| Occupancy Type | # Households | Median Income |
| Owner-Occupied | 2,097 (61.0%) | $64,625 |
| Renter-Occupied | 1,340 (39.0%) | $19,881 |
| Average | 3,437 (100.0%) | $47,239 |
Occupancy by Householder Income Bracket in Ashland
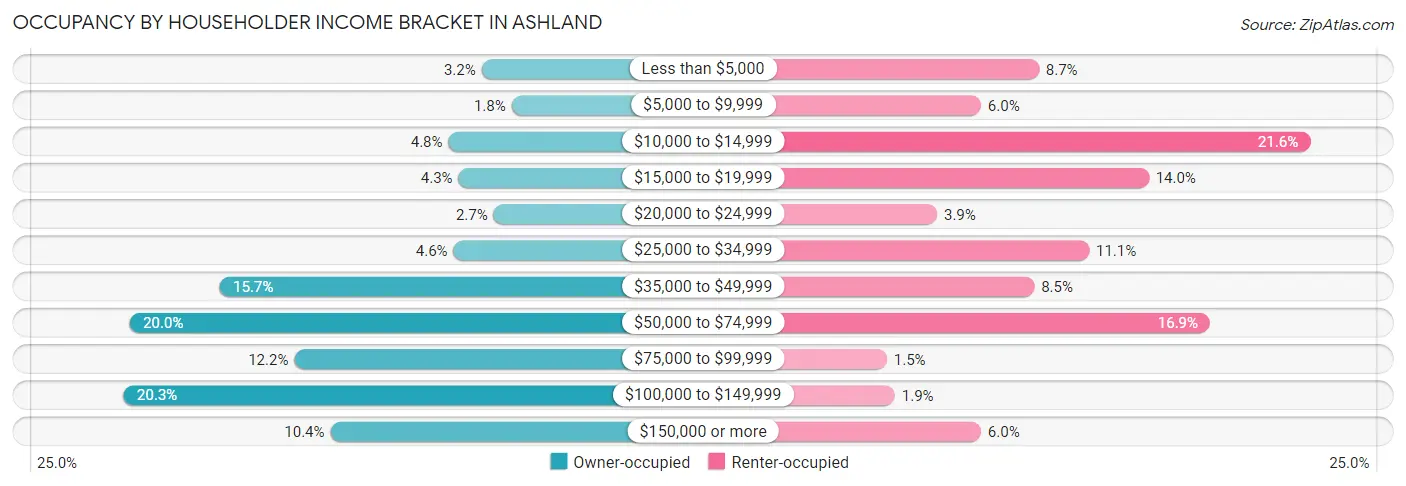
| Income Bracket | Owner-occupied | Renter-occupied |
| Less than $5,000 | 68 (3.2%) | 117 (8.7%) |
| $5,000 to $9,999 | 38 (1.8%) | 80 (6.0%) |
| $10,000 to $14,999 | 101 (4.8%) | 290 (21.6%) |
| $15,000 to $19,999 | 91 (4.3%) | 187 (14.0%) |
| $20,000 to $24,999 | 56 (2.7%) | 52 (3.9%) |
| $25,000 to $34,999 | 96 (4.6%) | 149 (11.1%) |
| $35,000 to $49,999 | 329 (15.7%) | 114 (8.5%) |
| $50,000 to $74,999 | 419 (20.0%) | 226 (16.9%) |
| $75,000 to $99,999 | 255 (12.2%) | 20 (1.5%) |
| $100,000 to $149,999 | 425 (20.3%) | 25 (1.9%) |
| $150,000 or more | 219 (10.4%) | 80 (6.0%) |
| Total | 2,097 (100.0%) | 1,340 (100.0%) |
Monthly Housing Cost Tiers in Ashland
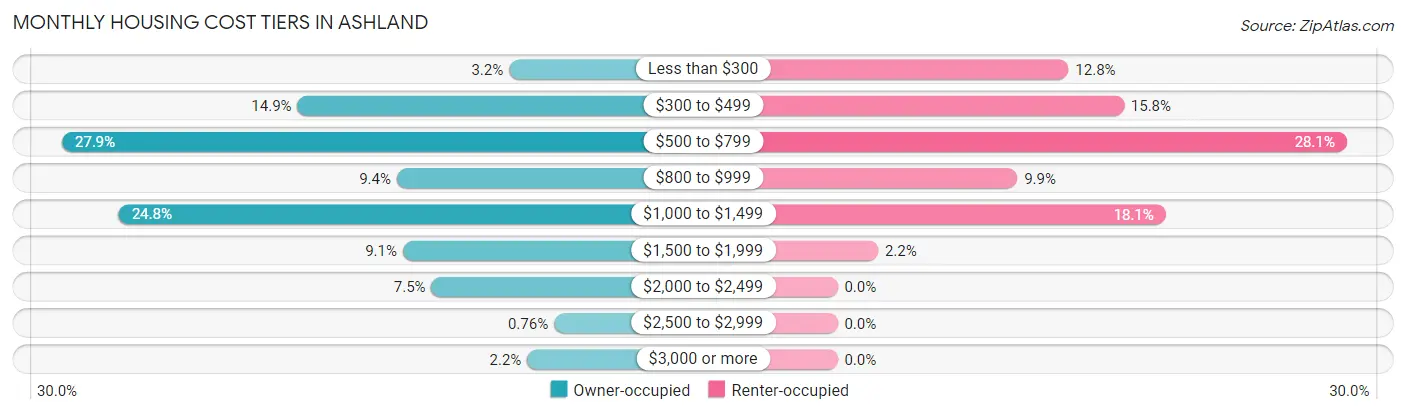
| Monthly Cost | Owner-occupied | Renter-occupied |
| Less than $300 | 68 (3.2%) | 171 (12.8%) |
| $300 to $499 | 313 (14.9%) | 212 (15.8%) |
| $500 to $799 | 586 (27.9%) | 377 (28.1%) |
| $800 to $999 | 198 (9.4%) | 133 (9.9%) |
| $1,000 to $1,499 | 520 (24.8%) | 243 (18.1%) |
| $1,500 to $1,999 | 191 (9.1%) | 30 (2.2%) |
| $2,000 to $2,499 | 158 (7.5%) | 0 (0.0%) |
| $2,500 to $2,999 | 16 (0.8%) | 0 (0.0%) |
| $3,000 or more | 47 (2.2%) | 0 (0.0%) |
| Total | 2,097 (100.0%) | 1,340 (100.0%) |
Physical Housing Characteristics in Ashland
Housing Structures in Ashland
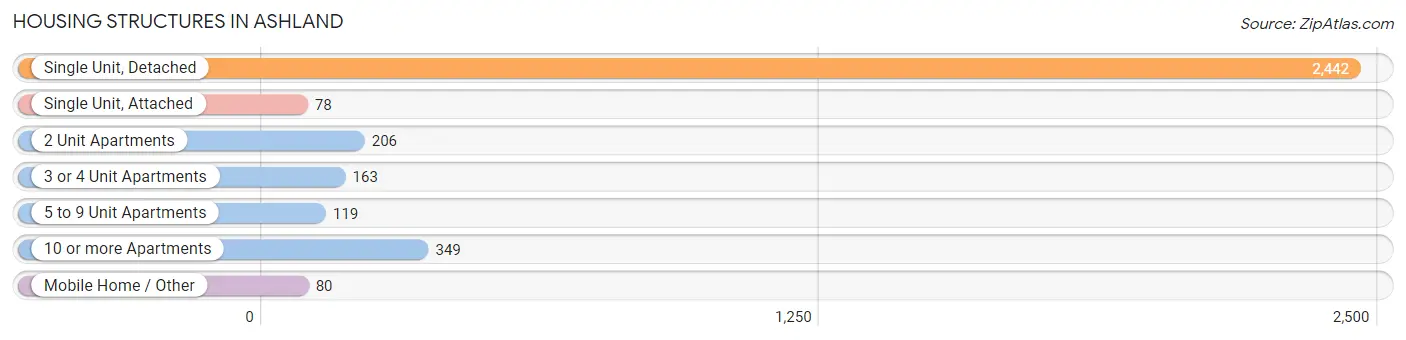
| Structure Type | # Housing Units | % Housing Units |
| Single Unit, Detached | 2,442 | 71.1% |
| Single Unit, Attached | 78 | 2.3% |
| 2 Unit Apartments | 206 | 6.0% |
| 3 or 4 Unit Apartments | 163 | 4.7% |
| 5 to 9 Unit Apartments | 119 | 3.5% |
| 10 or more Apartments | 349 | 10.2% |
| Mobile Home / Other | 80 | 2.3% |
| Total | 3,437 | 100.0% |
Housing Structures by Occupancy in Ashland
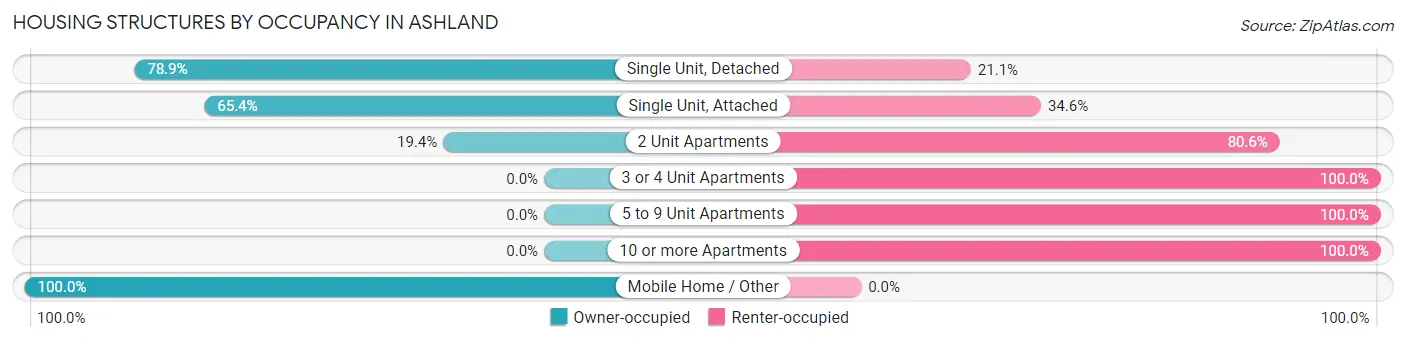
| Structure Type | Owner-occupied | Renter-occupied |
| Single Unit, Detached | 1,926 (78.9%) | 516 (21.1%) |
| Single Unit, Attached | 51 (65.4%) | 27 (34.6%) |
| 2 Unit Apartments | 40 (19.4%) | 166 (80.6%) |
| 3 or 4 Unit Apartments | 0 (0.0%) | 163 (100.0%) |
| 5 to 9 Unit Apartments | 0 (0.0%) | 119 (100.0%) |
| 10 or more Apartments | 0 (0.0%) | 349 (100.0%) |
| Mobile Home / Other | 80 (100.0%) | 0 (0.0%) |
| Total | 2,097 (61.0%) | 1,340 (39.0%) |
Housing Structures by Number of Rooms in Ashland
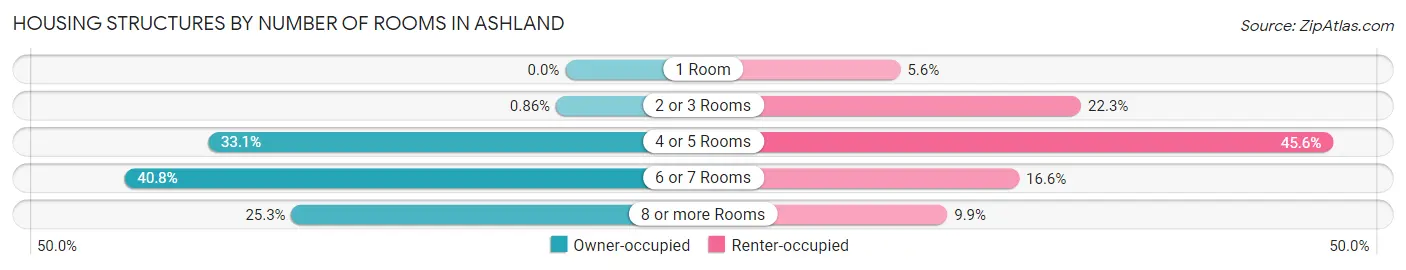
| Number of Rooms | Owner-occupied | Renter-occupied |
| 1 Room | 0 (0.0%) | 75 (5.6%) |
| 2 or 3 Rooms | 18 (0.9%) | 299 (22.3%) |
| 4 or 5 Rooms | 693 (33.1%) | 611 (45.6%) |
| 6 or 7 Rooms | 855 (40.8%) | 222 (16.6%) |
| 8 or more Rooms | 531 (25.3%) | 133 (9.9%) |
| Total | 2,097 (100.0%) | 1,340 (100.0%) |
Housing Structure by Heating Type in Ashland
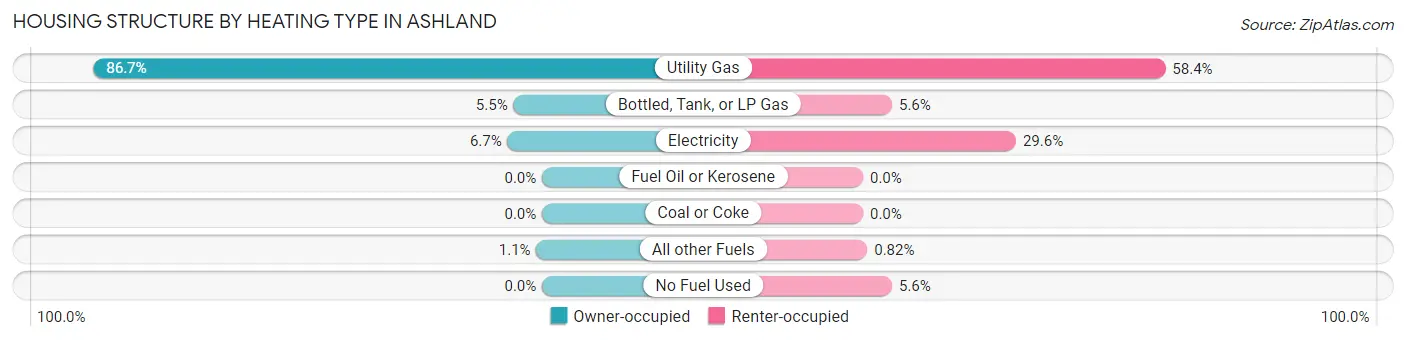
| Heating Type | Owner-occupied | Renter-occupied |
| Utility Gas | 1,818 (86.7%) | 783 (58.4%) |
| Bottled, Tank, or LP Gas | 116 (5.5%) | 75 (5.6%) |
| Electricity | 140 (6.7%) | 396 (29.5%) |
| Fuel Oil or Kerosene | 0 (0.0%) | 0 (0.0%) |
| Coal or Coke | 0 (0.0%) | 0 (0.0%) |
| All other Fuels | 23 (1.1%) | 11 (0.8%) |
| No Fuel Used | 0 (0.0%) | 75 (5.6%) |
| Total | 2,097 (100.0%) | 1,340 (100.0%) |
Household Vehicle Usage in Ashland
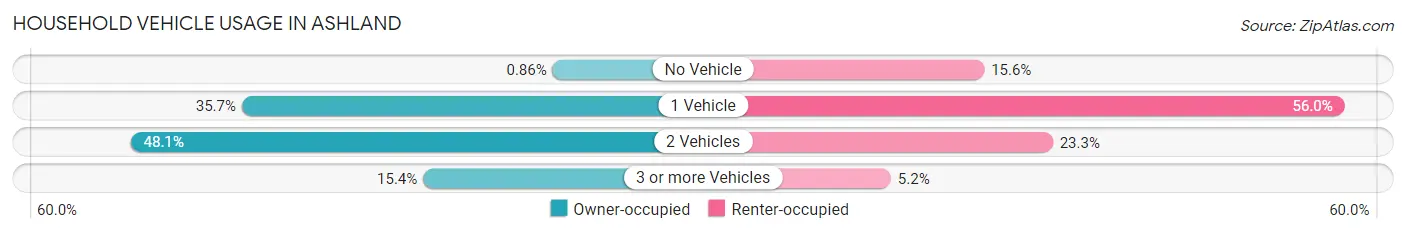
| Vehicles per Household | Owner-occupied | Renter-occupied |
| No Vehicle | 18 (0.9%) | 209 (15.6%) |
| 1 Vehicle | 748 (35.7%) | 750 (56.0%) |
| 2 Vehicles | 1,009 (48.1%) | 312 (23.3%) |
| 3 or more Vehicles | 322 (15.4%) | 69 (5.1%) |
| Total | 2,097 (100.0%) | 1,340 (100.0%) |
Real Estate & Mortgages in Ashland
Real Estate and Mortgage Overview in Ashland
| Characteristic | Without Mortgage | With Mortgage |
| Housing Units | 951 | 1,146 |
| Median Property Value | $126,900 | $150,100 |
| Median Household Income | $52,740 | $169 |
| Monthly Housing Costs | $556 | $31 |
| Real Estate Taxes | $2,200 | $69 |
Property Value by Mortgage Status in Ashland
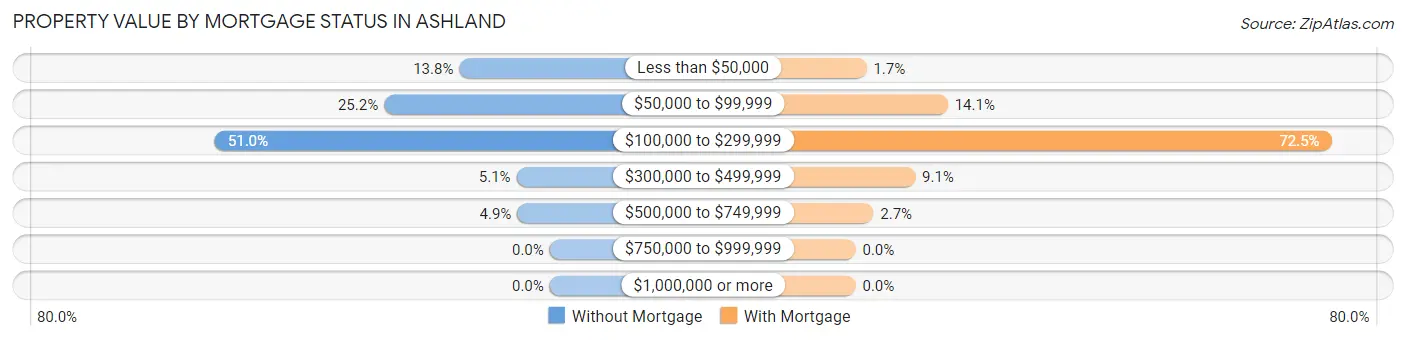
| Property Value | Without Mortgage | With Mortgage |
| Less than $50,000 | 131 (13.8%) | 19 (1.7%) |
| $50,000 to $99,999 | 240 (25.2%) | 161 (14.1%) |
| $100,000 to $299,999 | 485 (51.0%) | 831 (72.5%) |
| $300,000 to $499,999 | 48 (5.1%) | 104 (9.1%) |
| $500,000 to $749,999 | 47 (4.9%) | 31 (2.7%) |
| $750,000 to $999,999 | 0 (0.0%) | 0 (0.0%) |
| $1,000,000 or more | 0 (0.0%) | 0 (0.0%) |
| Total | 951 (100.0%) | 1,146 (100.0%) |
Household Income by Mortgage Status in Ashland
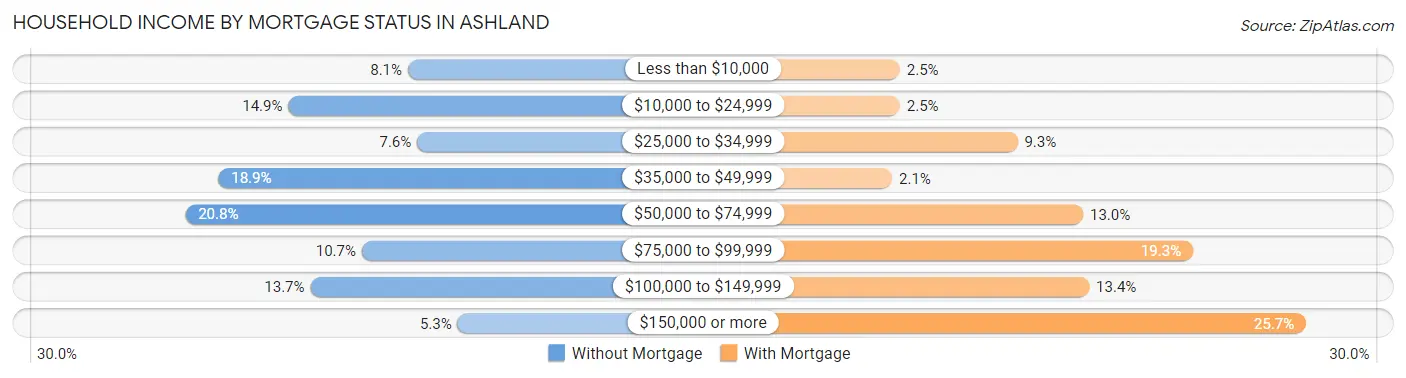
| Household Income | Without Mortgage | With Mortgage |
| Less than $10,000 | 77 (8.1%) | 29 (2.5%) |
| $10,000 to $24,999 | 142 (14.9%) | 29 (2.5%) |
| $25,000 to $34,999 | 72 (7.6%) | 106 (9.2%) |
| $35,000 to $49,999 | 180 (18.9%) | 24 (2.1%) |
| $50,000 to $74,999 | 198 (20.8%) | 149 (13.0%) |
| $75,000 to $99,999 | 102 (10.7%) | 221 (19.3%) |
| $100,000 to $149,999 | 130 (13.7%) | 153 (13.4%) |
| $150,000 or more | 50 (5.3%) | 295 (25.7%) |
| Total | 951 (100.0%) | 1,146 (100.0%) |
Property Value to Household Income Ratio in Ashland
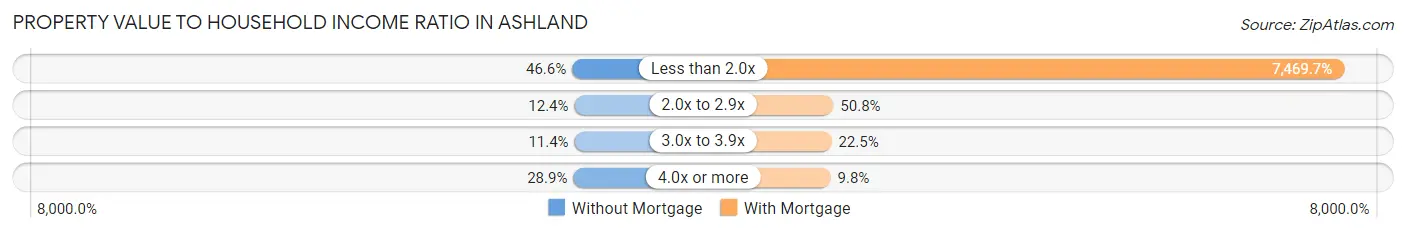
| Value-to-Income Ratio | Without Mortgage | With Mortgage |
| Less than 2.0x | 443 (46.6%) | 85,603 (7,469.7%) |
| 2.0x to 2.9x | 118 (12.4%) | 582 (50.8%) |
| 3.0x to 3.9x | 108 (11.4%) | 258 (22.5%) |
| 4.0x or more | 275 (28.9%) | 112 (9.8%) |
| Total | 951 (100.0%) | 1,146 (100.0%) |
Real Estate Taxes by Mortgage Status in Ashland
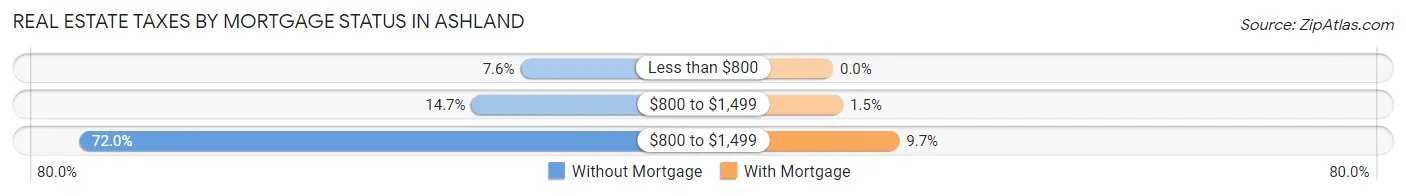
| Property Taxes | Without Mortgage | With Mortgage |
| Less than $800 | 72 (7.6%) | 0 (0.0%) |
| $800 to $1,499 | 140 (14.7%) | 17 (1.5%) |
| $800 to $1,499 | 685 (72.0%) | 111 (9.7%) |
| Total | 951 (100.0%) | 1,146 (100.0%) |
Health & Disability in Ashland
Health Insurance Coverage by Age in Ashland
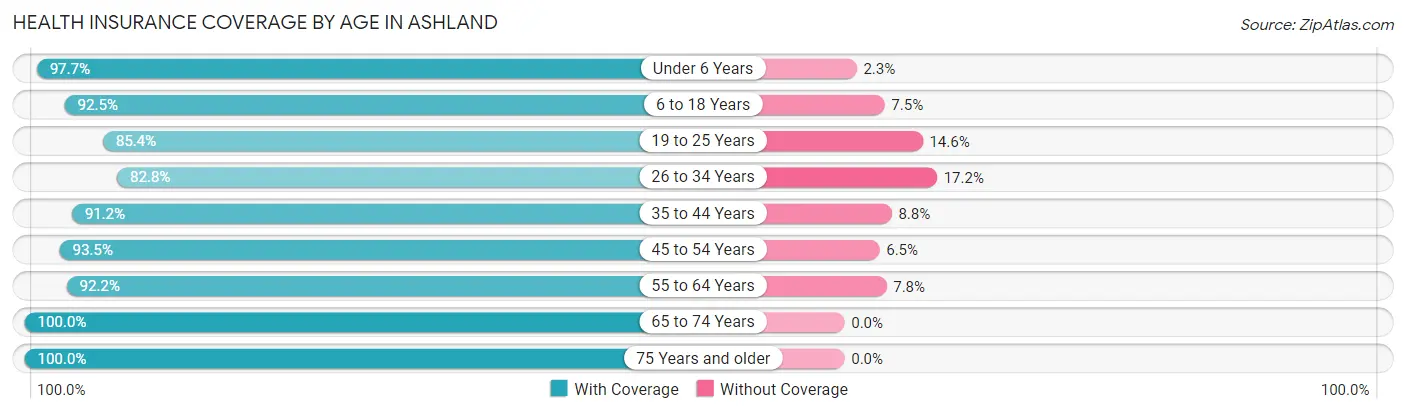
| Age Bracket | With Coverage | Without Coverage |
| Under 6 Years | 473 (97.7%) | 11 (2.3%) |
| 6 to 18 Years | 1,064 (92.5%) | 86 (7.5%) |
| 19 to 25 Years | 779 (85.4%) | 133 (14.6%) |
| 26 to 34 Years | 696 (82.8%) | 145 (17.2%) |
| 35 to 44 Years | 902 (91.2%) | 87 (8.8%) |
| 45 to 54 Years | 789 (93.5%) | 55 (6.5%) |
| 55 to 64 Years | 1,047 (92.2%) | 89 (7.8%) |
| 65 to 74 Years | 756 (100.0%) | 0 (0.0%) |
| 75 Years and older | 596 (100.0%) | 0 (0.0%) |
| Total | 7,102 (92.1%) | 606 (7.9%) |
Health Insurance Coverage by Citizenship Status in Ashland
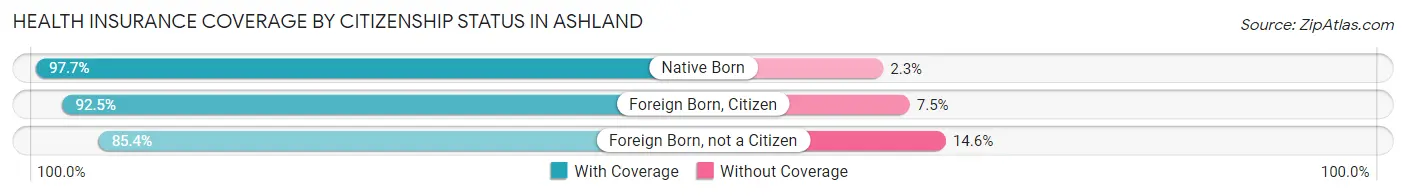
| Citizenship Status | With Coverage | Without Coverage |
| Native Born | 473 (97.7%) | 11 (2.3%) |
| Foreign Born, Citizen | 1,064 (92.5%) | 86 (7.5%) |
| Foreign Born, not a Citizen | 779 (85.4%) | 133 (14.6%) |
Health Insurance Coverage by Household Income in Ashland
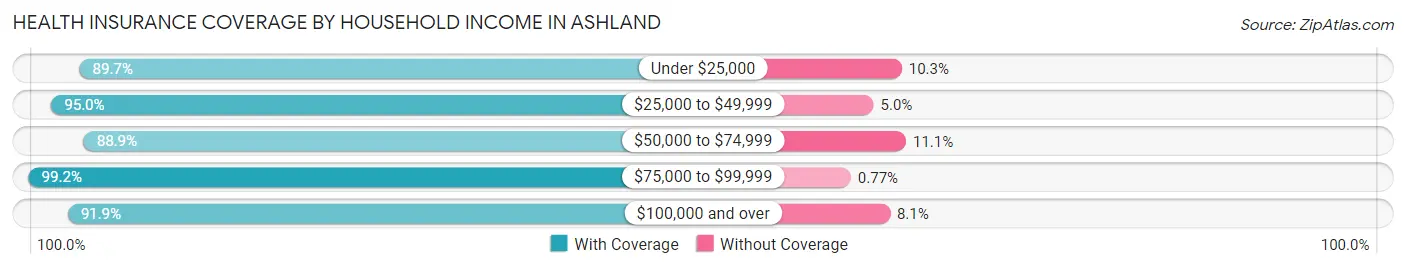
| Household Income | With Coverage | Without Coverage |
| Under $25,000 | 1,453 (89.7%) | 167 (10.3%) |
| $25,000 to $49,999 | 1,172 (95.0%) | 62 (5.0%) |
| $50,000 to $74,999 | 1,314 (88.9%) | 164 (11.1%) |
| $75,000 to $99,999 | 645 (99.2%) | 5 (0.8%) |
| $100,000 and over | 2,158 (91.9%) | 190 (8.1%) |
Public vs Private Health Insurance Coverage by Age in Ashland
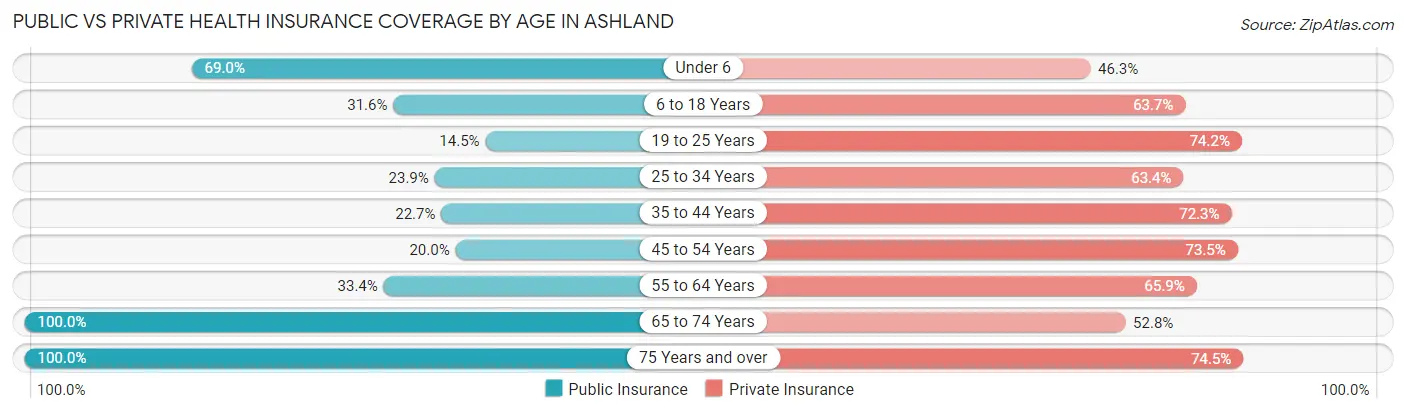
| Age Bracket | Public Insurance | Private Insurance |
| Under 6 | 334 (69.0%) | 224 (46.3%) |
| 6 to 18 Years | 363 (31.6%) | 733 (63.7%) |
| 19 to 25 Years | 132 (14.5%) | 677 (74.2%) |
| 25 to 34 Years | 201 (23.9%) | 533 (63.4%) |
| 35 to 44 Years | 224 (22.7%) | 715 (72.3%) |
| 45 to 54 Years | 169 (20.0%) | 620 (73.5%) |
| 55 to 64 Years | 379 (33.4%) | 748 (65.8%) |
| 65 to 74 Years | 756 (100.0%) | 399 (52.8%) |
| 75 Years and over | 596 (100.0%) | 444 (74.5%) |
| Total | 3,154 (40.9%) | 5,093 (66.1%) |
Disability Status by Sex by Age in Ashland
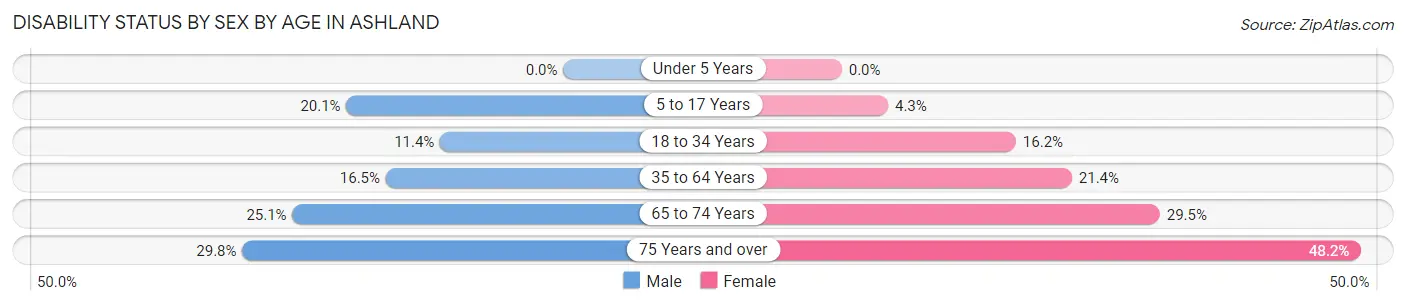
| Age Bracket | Male | Female |
| Under 5 Years | 0 (0.0%) | 0 (0.0%) |
| 5 to 17 Years | 127 (20.1%) | 21 (4.3%) |
| 18 to 34 Years | 120 (11.4%) | 134 (16.2%) |
| 35 to 64 Years | 253 (16.5%) | 306 (21.3%) |
| 65 to 74 Years | 87 (25.1%) | 121 (29.5%) |
| 75 Years and over | 70 (29.8%) | 174 (48.2%) |
Disability Class by Sex by Age in Ashland
Disability Class: Hearing Difficulty
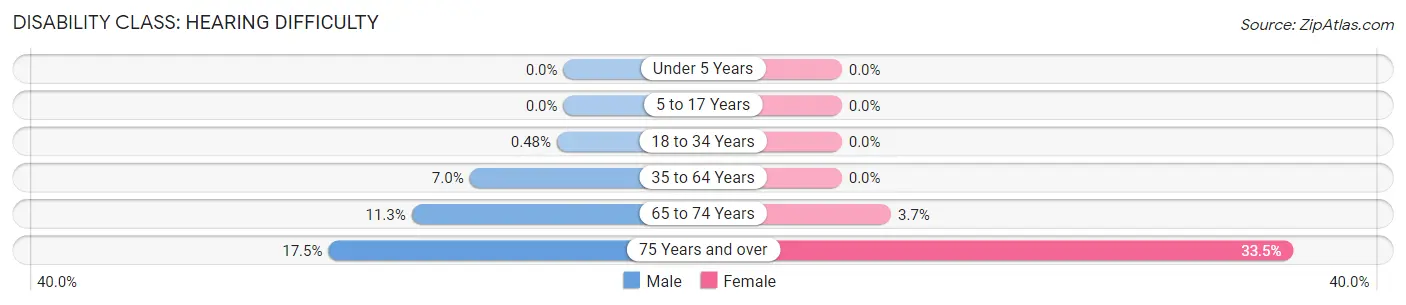
| Age Bracket | Male | Female |
| Under 5 Years | 0 (0.0%) | 0 (0.0%) |
| 5 to 17 Years | 0 (0.0%) | 0 (0.0%) |
| 18 to 34 Years | 5 (0.5%) | 0 (0.0%) |
| 35 to 64 Years | 107 (7.0%) | 0 (0.0%) |
| 65 to 74 Years | 39 (11.3%) | 15 (3.7%) |
| 75 Years and over | 41 (17.4%) | 121 (33.5%) |
Disability Class: Vision Difficulty
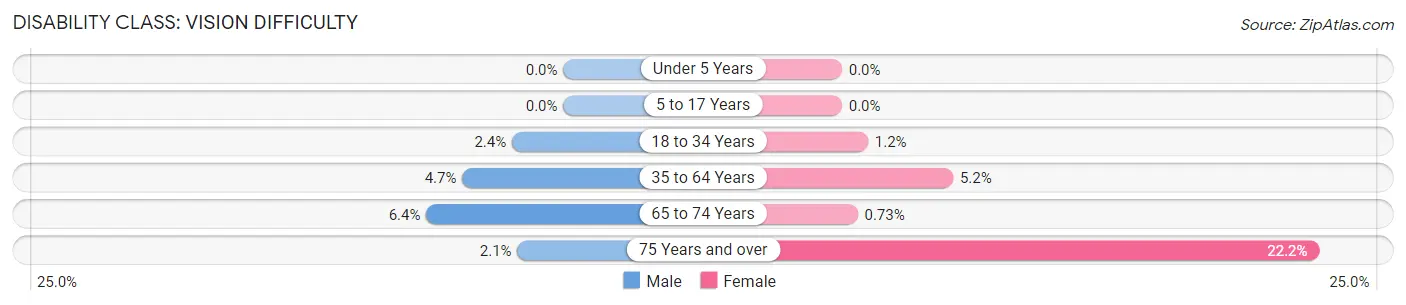
| Age Bracket | Male | Female |
| Under 5 Years | 0 (0.0%) | 0 (0.0%) |
| 5 to 17 Years | 0 (0.0%) | 0 (0.0%) |
| 18 to 34 Years | 25 (2.4%) | 10 (1.2%) |
| 35 to 64 Years | 72 (4.7%) | 74 (5.2%) |
| 65 to 74 Years | 22 (6.4%) | 3 (0.7%) |
| 75 Years and over | 5 (2.1%) | 80 (22.2%) |
Disability Class: Cognitive Difficulty
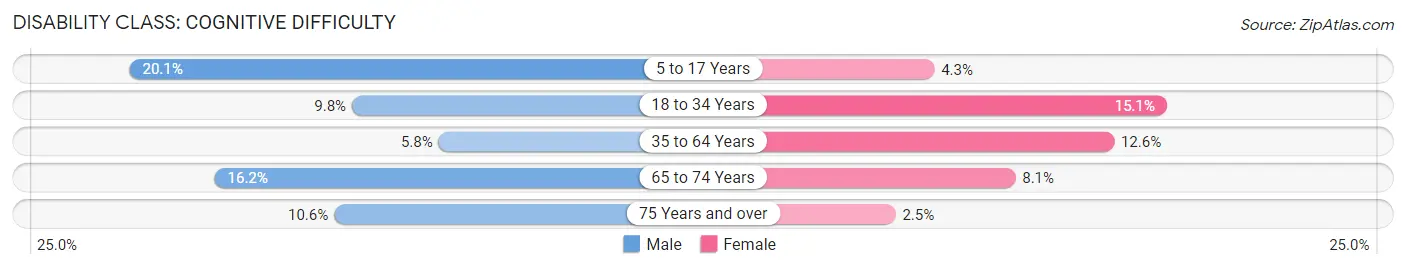
| Age Bracket | Male | Female |
| 5 to 17 Years | 127 (20.1%) | 21 (4.3%) |
| 18 to 34 Years | 103 (9.8%) | 125 (15.1%) |
| 35 to 64 Years | 89 (5.8%) | 181 (12.6%) |
| 65 to 74 Years | 56 (16.2%) | 33 (8.1%) |
| 75 Years and over | 25 (10.6%) | 9 (2.5%) |
Disability Class: Ambulatory Difficulty
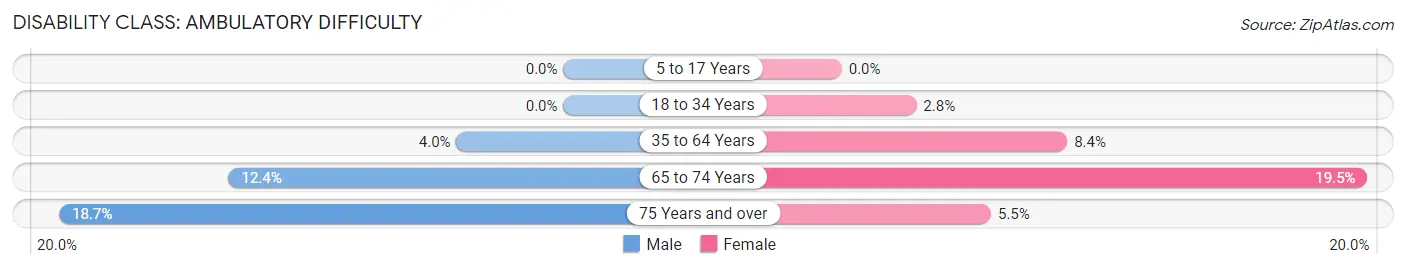
| Age Bracket | Male | Female |
| 5 to 17 Years | 0 (0.0%) | 0 (0.0%) |
| 18 to 34 Years | 0 (0.0%) | 23 (2.8%) |
| 35 to 64 Years | 61 (4.0%) | 120 (8.4%) |
| 65 to 74 Years | 43 (12.4%) | 80 (19.5%) |
| 75 Years and over | 44 (18.7%) | 20 (5.5%) |
Disability Class: Self-Care Difficulty
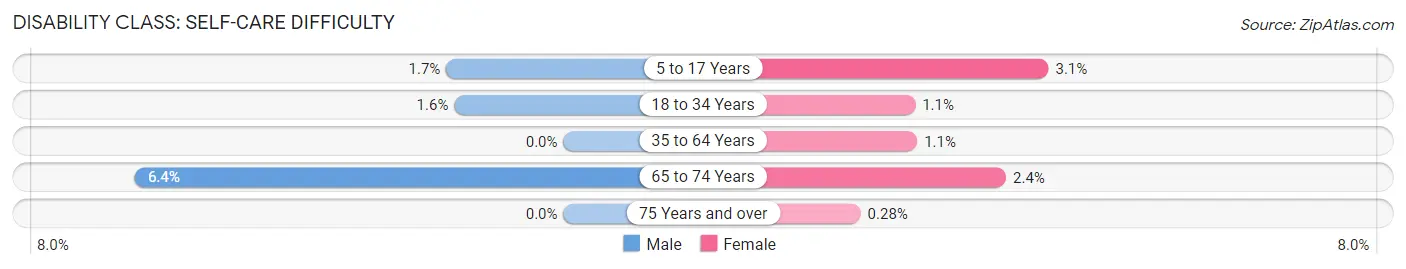
| Age Bracket | Male | Female |
| 5 to 17 Years | 11 (1.7%) | 15 (3.1%) |
| 18 to 34 Years | 17 (1.6%) | 9 (1.1%) |
| 35 to 64 Years | 0 (0.0%) | 16 (1.1%) |
| 65 to 74 Years | 22 (6.4%) | 10 (2.4%) |
| 75 Years and over | 0 (0.0%) | 1 (0.3%) |
Technology Access in Ashland
Computing Device Access in Ashland
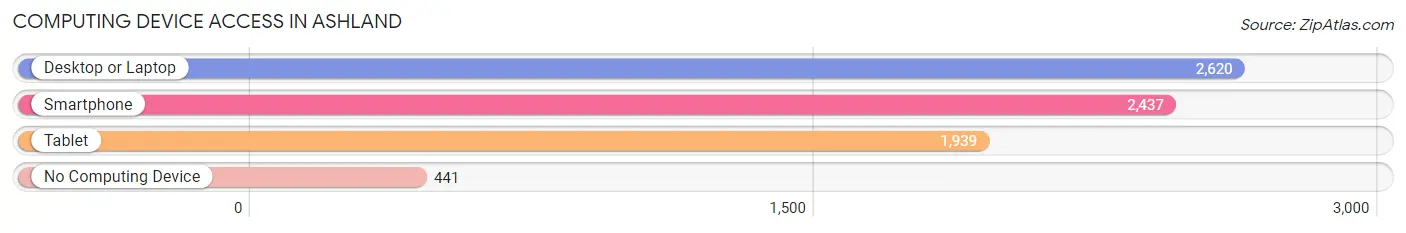
| Device Type | # Households | % Households |
| Desktop or Laptop | 2,620 | 76.2% |
| Smartphone | 2,437 | 70.9% |
| Tablet | 1,939 | 56.4% |
| No Computing Device | 441 | 12.8% |
| Total | 3,437 | 100.0% |
Internet Access in Ashland
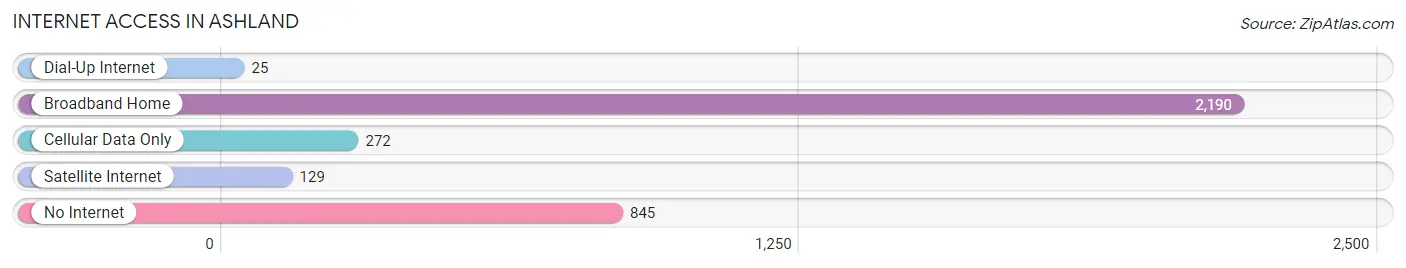
| Internet Type | # Households | % Households |
| Dial-Up Internet | 25 | 0.7% |
| Broadband Home | 2,190 | 63.7% |
| Cellular Data Only | 272 | 7.9% |
| Satellite Internet | 129 | 3.7% |
| No Internet | 845 | 24.6% |
| Total | 3,437 | 100.0% |
Ashland Summary
Ashland, Wisconsin is a city located in the northern part of the state, in Ashland County. It is situated on the shore of Lake Superior, the largest of the Great Lakes. The city has a population of 8,216, according to the 2010 census.
History
The area that is now Ashland was first inhabited by the Ojibwe people, who called the area “Gitchigami,” meaning “big water.” The first European settlers arrived in the area in the early 1800s, and the city was officially founded in 1854. The city was named after Henry Clay’s estate in Kentucky, and was incorporated in 1872.
The city’s economy was initially based on the lumber industry, and the city was home to several sawmills. The city also had a thriving fishing industry, and was home to several fish processing plants. The city’s economy shifted in the early 1900s, when the lumber industry began to decline. The city’s economy shifted to tourism, and the city became a popular destination for fishing and boating.
Geography
Ashland is located in the northern part of Wisconsin, in Ashland County. The city is situated on the shore of Lake Superior, the largest of the Great Lakes. The city is located at the mouth of the Chequamegon Bay, and is surrounded by forests and lakes. The city is located about 100 miles east of Duluth, Minnesota, and about 200 miles north of Milwaukee, Wisconsin.
The city has a total area of 8.3 square miles, of which 7.9 square miles is land and 0.4 square miles is water. The city has a humid continental climate, with cold winters and warm summers.
Economy
The economy of Ashland is largely based on tourism. The city is a popular destination for fishing and boating, and is home to several marinas and boat launches. The city is also home to several resorts and hotels, which cater to tourists. The city is also home to several restaurants and bars, which cater to both tourists and locals.
The city is also home to several manufacturing companies, including a paper mill and a steel mill. The city is also home to several retail stores, including a Walmart Supercenter.
Demographics
According to the 2010 census, the population of Ashland was 8,216. The racial makeup of the city was 94.2% White, 0.7% African American, 0.7% Native American, 0.7% Asian, 0.1% Pacific Islander, 1.7% from other races, and 2.0% from two or more races. Hispanic or Latino of any race were 3.3% of the population.
The median income for a household in the city was $37,917, and the median income for a family was $45,938. The per capita income for the city was $20,845. About 11.2% of families and 14.2% of the population were below the poverty line, including 19.2% of those under age 18 and 8.2% of those age 65 or over.
Common Questions
What is Per Capita Income in Ashland?
Per Capita income in Ashland is $30,062.
What is the Median Family Income in Ashland?
Median Family Income in Ashland is $72,993.
What is the Median Household income in Ashland?
Median Household Income in Ashland is $47,239.
What is Income or Wage Gap in Ashland?
Income or Wage Gap in Ashland is 46.0%.
Women in Ashland earn 54.0 cents for every dollar earned by a man.
What is Inequality or Gini Index in Ashland?
Inequality or Gini Index in Ashland is 0.48.
What is the Total Population of Ashland?
Total Population of Ashland is 7,903.
What is the Total Male Population of Ashland?
Total Male Population of Ashland is 4,134.
What is the Total Female Population of Ashland?
Total Female Population of Ashland is 3,769.
What is the Ratio of Males per 100 Females in Ashland?
There are 109.68 Males per 100 Females in Ashland.
What is the Ratio of Females per 100 Males in Ashland?
There are 91.17 Females per 100 Males in Ashland.
What is the Median Population Age in Ashland?
Median Population Age in Ashland is 39.7 Years.
What is the Average Family Size in Ashland
Average Family Size in Ashland is 2.9 People.
What is the Average Household Size in Ashland
Average Household Size in Ashland is 2.1 People.
How Large is the Labor Force in Ashland?
There are 4,199 People in the Labor Forcein in Ashland.
What is the Percentage of People in the Labor Force in Ashland?
63.5% of People are in the Labor Force in Ashland.
What is the Unemployment Rate in Ashland?
Unemployment Rate in Ashland is 3.8%.