Zip Codes with the Highest Percentage of Population Employed in Administrative & Support Services in Las Vegas, NV

RELATED REPORTS & OPTIONS

Administrative & Support Services
Population
Families and Households
Female Fertility
Female Fertility (Unmarried)
Race (Community Size)
Race (Percentage)
Ancestry (Community Size)
AfghanAfricanAlaska NativeAlbanianAleutAmericanApacheArabArapahoArgentineanArmenianAssyrian / Chaldean / SyriacAustralianAustrianBangladeshiBarbadianBasqueBelgianBelizeanBhutaneseBlackfeetBolivianBrazilianBritishBritish West IndianBulgarianBurmeseCajunCambodianCanadianCape VerdeanCelticCentral AmericanCentral American IndianCherokeeCheyenneChickasawChileanChineseChippewaChoctawColombianComancheCosta RicanCreeCreekCroatianCubanCzechCzechoslovakianDanishDelawareDominicanDutchDutch West IndianEastern EuropeanEcuadorianEgyptianEnglishEstonianEthiopianEuropeanFijianFilipinoFinnishFrenchFrench American IndianFrench CanadianGermanGerman RussianGhanaianGreekGuamanian / ChamorroGuatemalanGuyaneseHaitianHonduranHopiHungarianIcelanderIndian (Asian)IndonesianInupiatIranianIraqiIrishIroquoisIsraeliItalianJamaicanJapaneseJordanianKenyanKoreanLaotianLatvianLebaneseLiberianLithuanianLuxembourgerMacedonianMalaysianMalteseMenomineeMexicanMexican American IndianMongolianMoroccanNative HawaiianNavajoNew ZealanderNicaraguanNigerianNorthern EuropeanNorwegianOkinawanOsagePaiutePakistaniPalestinianPanamanianParaguayanPennsylvania GermanPeruvianPimaPolishPortuguesePotawatomiPuebloPuerto RicanPuget Sound SalishRomanianRussianSalvadoranSamoanScandinavianScotch-IrishScottishSeminoleSenegaleseSerbianShoshoneSierra LeoneanSiouxSlavicSlovakSloveneSomaliSouth AfricanSouth AmericanSouth American IndianSoviet UnionSpaniardSpanishSpanish AmericanSpanish American IndianSri LankanSubsaharan AfricanSudaneseSwedishSwissSyrianThaiTlingit-HaidaTohono O'OdhamTonganTrinidadian and TobagonianTurkishU.S. Virgin IslanderUgandanUkrainianUruguayanUteVenezuelanVietnameseWelshWest IndianYaquiYugoslavianYumanYup'ikZimbabwean
Ancestry (Percentage)
AfghanAfricanAlaska NativeAlbanianAleutAmericanApacheArabArapahoArgentineanArmenianAssyrian / Chaldean / SyriacAustralianAustrianBangladeshiBarbadianBasqueBelgianBelizeanBhutaneseBlackfeetBolivianBrazilianBritishBritish West IndianBulgarianBurmeseCajunCambodianCanadianCape VerdeanCelticCentral AmericanCentral American IndianCherokeeCheyenneChickasawChileanChineseChippewaChoctawColombianComancheCosta RicanCreeCreekCroatianCubanCzechCzechoslovakianDanishDelawareDominicanDutchDutch West IndianEastern EuropeanEcuadorianEgyptianEnglishEstonianEthiopianEuropeanFijianFilipinoFinnishFrenchFrench American IndianFrench CanadianGermanGerman RussianGhanaianGreekGuamanian / ChamorroGuatemalanGuyaneseHaitianHonduranHopiHungarianIcelanderIndian (Asian)IndonesianInupiatIranianIraqiIrishIroquoisIsraeliItalianJamaicanJapaneseJordanianKenyanKoreanLaotianLatvianLebaneseLiberianLithuanianLuxembourgerMacedonianMalaysianMalteseMenomineeMexicanMexican American IndianMongolianMoroccanNative HawaiianNavajoNew ZealanderNicaraguanNigerianNorthern EuropeanNorwegianOkinawanOsagePaiutePakistaniPalestinianPanamanianParaguayanPennsylvania GermanPeruvianPimaPolishPortuguesePotawatomiPuebloPuerto RicanPuget Sound SalishRomanianRussianSalvadoranSamoanScandinavianScotch-IrishScottishSeminoleSenegaleseSerbianShoshoneSierra LeoneanSiouxSlavicSlovakSloveneSomaliSouth AfricanSouth AmericanSouth American IndianSoviet UnionSpaniardSpanishSpanish AmericanSpanish American IndianSri LankanSubsaharan AfricanSudaneseSwedishSwissSyrianThaiTlingit-HaidaTohono O'OdhamTonganTrinidadian and TobagonianTurkishU.S. Virgin IslanderUgandanUkrainianUruguayanUteVenezuelanVietnameseWelshWest IndianYaquiYugoslavianYumanYup'ikZimbabwean
Immigrant Origin (Total)
AfghanistanAfricaAlbaniaArgentinaArmeniaAsiaAustraliaAustriaBahamasBangladeshBarbadosBelarusBelgiumBelizeBoliviaBosnia and HerzegovinaBrazilBulgariaBurma / MyanmarCambodiaCameroonCanadaCaribbeanCentral AmericaChileChinaColombiaCosta RicaCroatiaCubaCzechoslovakiaDenmarkDominican RepublicEastern AfricaEastern AsiaEastern EuropeEcuadorEgyptEl SalvadorEnglandEritreaEthiopiaEuropeFijiFranceGermanyGhanaGreeceGuatemalaGuyanaHaitiHondurasHong KongHungaryIndiaIndonesiaIranIraqIrelandIsraelItalyJamaicaJapanJordanKazakhstanKenyaKoreaLaosLatin AmericaLatviaLebanonLiberiaLithuaniaMalaysiaMexicoMicronesiaMiddle AfricaMoldovaMoroccoNepalNetherlandsNicaraguaNigeriaNorth MacedoniaNorthern AfricaNorthern EuropeNorwayOceaniaPakistanPanamaPeruPhilippinesPolandPortugalRomaniaRussiaSaudi ArabiaScotlandSenegalSerbiaSierra LeoneSingaporeSomaliaSouth AfricaSouth AmericaSouth Central AsiaSouth Eastern AsiaSouthern EuropeSpainSri LankaSudanSwedenSwitzerlandSyriaTaiwanThailandTrinidad and TobagoTurkeyUgandaUkraineUruguayUzbekistanVenezuelaVietnamWest IndiesWestern AfricaWestern AsiaWestern EuropeYemenZaireZimbabwe
Immigrant Origin (Percentage)
AfghanistanAfricaAlbaniaArgentinaArmeniaAsiaAustraliaAustriaBahamasBangladeshBarbadosBelarusBelgiumBelizeBoliviaBosnia and HerzegovinaBrazilBulgariaBurma / MyanmarCambodiaCameroonCanadaCaribbeanCentral AmericaChileChinaColombiaCosta RicaCroatiaCubaCzechoslovakiaDenmarkDominican RepublicEastern AfricaEastern AsiaEastern EuropeEcuadorEgyptEl SalvadorEnglandEritreaEthiopiaEuropeFijiFranceGermanyGhanaGreeceGuatemalaGuyanaHaitiHondurasHong KongHungaryIndiaIndonesiaIranIraqIrelandIsraelItalyJamaicaJapanJordanKazakhstanKenyaKoreaLaosLatin AmericaLatviaLebanonLiberiaLithuaniaMalaysiaMexicoMicronesiaMiddle AfricaMoldovaMoroccoNepalNetherlandsNicaraguaNigeriaNorth MacedoniaNorthern AfricaNorthern EuropeNorwayOceaniaPakistanPanamaPeruPhilippinesPolandPortugalRomaniaRussiaSaudi ArabiaScotlandSenegalSerbiaSierra LeoneSingaporeSomaliaSouth AfricaSouth AmericaSouth Central AsiaSouth Eastern AsiaSouthern EuropeSpainSri LankaSudanSwedenSwitzerlandSyriaTaiwanThailandTrinidad and TobagoTurkeyUgandaUkraineUruguayUzbekistanVenezuelaVietnamWest IndiesWestern AfricaWestern AsiaWestern EuropeYemenZaireZimbabwe
Income
Income (Families)
Income (Households)
Poverty
Poverty (Families)
Unemployment
Employment Occupations
Employment Industries
Employer Class
Commute Time
Commute Means
School Enrollment
Education by Degree Field
Occupancy
Finances
Physical Characteristics
Las Vegas
Compare Zip Codes
Comparison Subject

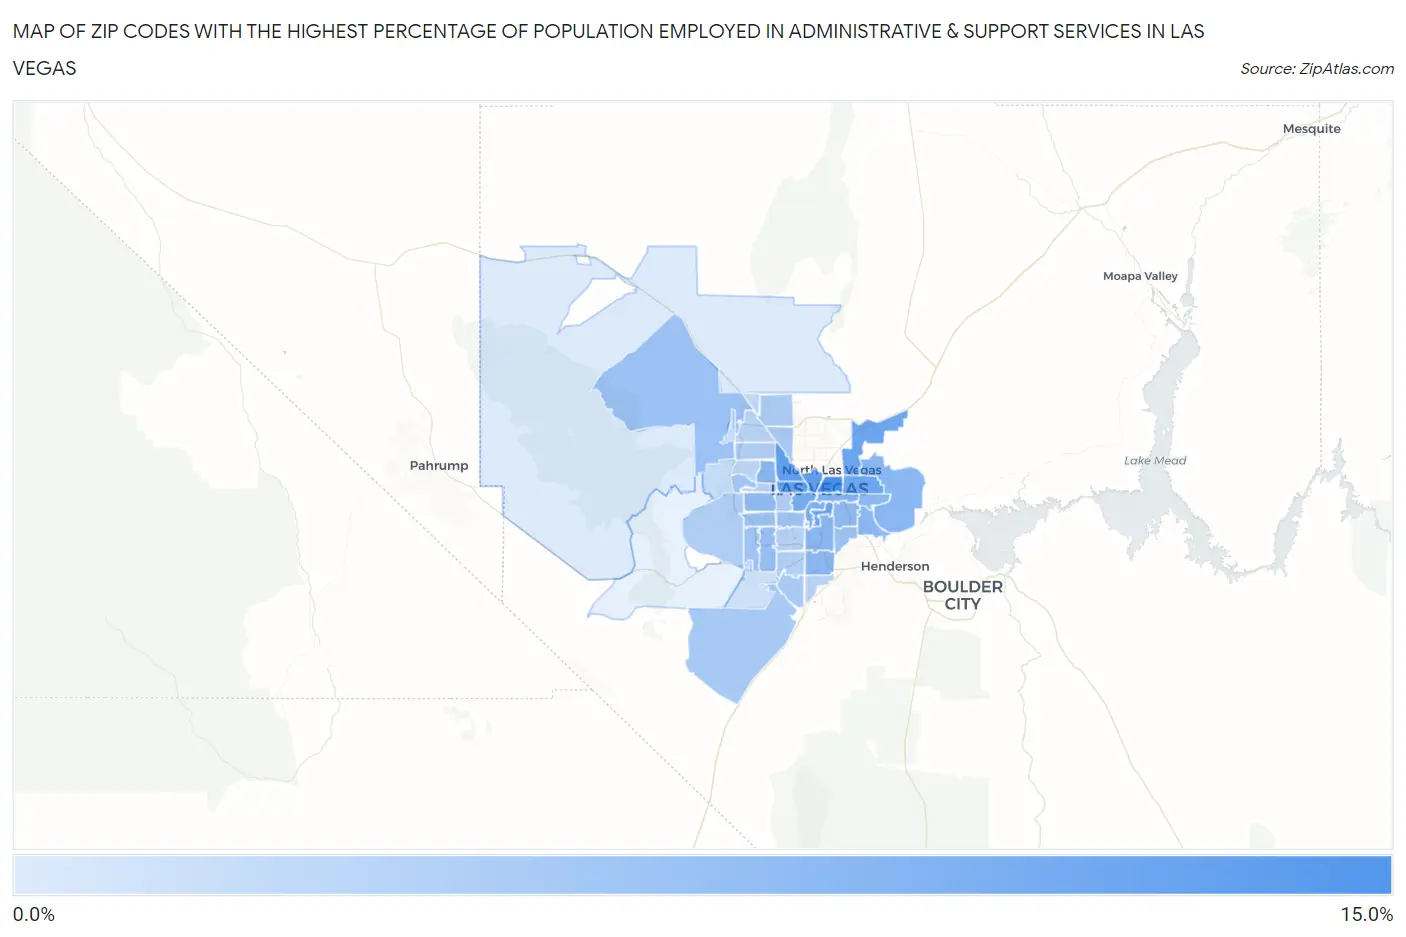
Map of Zip Codes with the Highest Percentage of Population Employed in Administrative & Support Services in Las Vegas

0.0%
15.0%
Zip Codes with the Highest Percentage of Population Employed in Administrative & Support Services in Las Vegas Map

Zip Codes with the Highest Percentage of Population Employed in Administrative & Support Services in Las Vegas, NV

Zip Code % Employed vs State vs National
1.8910112.2%5.5%(+6.66)#24.1%(+8.03)#825
2.8910610.3%5.5%(+4.76)#84.1%(+6.12)#1,208
3.8910810.0%5.5%(+4.47)#94.1%(+5.84)#1,293
4.8910710.0%5.5%(+4.43)#104.1%(+5.80)#1,304
5.891699.5%5.5%(+3.93)#134.1%(+5.30)#1,491
6.891109.2%5.5%(+3.66)#144.1%(+5.03)#1,597
7.891159.1%5.5%(+3.55)#154.1%(+4.92)#1,652
8.891028.5%5.5%(+2.98)#184.1%(+4.35)#1,964
9.891097.9%5.5%(+2.43)#224.1%(+3.80)#2,320
10.891047.4%5.5%(+1.92)#244.1%(+3.29)#2,750
11.891287.2%5.5%(+1.65)#274.1%(+3.01)#3,017
12.891567.1%5.5%(+1.59)#284.1%(+2.96)#3,078
13.891197.1%5.5%(+1.59)#294.1%(+2.96)#3,088
14.891236.9%5.5%(+1.34)#334.1%(+2.70)#3,411
15.891426.7%5.5%(+1.21)#354.1%(+2.58)#3,574
16.891226.7%5.5%(+1.16)#364.1%(+2.53)#3,658
17.891176.5%5.5%(+0.997)#384.1%(+2.36)#3,884
18.891216.5%5.5%(+0.984)#394.1%(+2.35)#3,908
19.891136.1%5.5%(+0.537)#454.1%(+1.90)#4,684
20.891665.7%5.5%(+0.179)#484.1%(+1.55)#5,365
21.891475.5%5.5%(+0.017)#504.1%(+1.38)#5,752
22.891205.5%5.5%(-0.010)#524.1%(+1.36)#5,828
23.891035.5%5.5%(-0.011)#534.1%(+1.36)#5,829
24.891485.3%5.5%(-0.224)#564.1%(+1.14)#6,347
25.891445.2%5.5%(-0.303)#574.1%(+1.06)#6,568
26.891585.1%5.5%(-0.396)#594.1%(+0.970)#6,799
27.891794.8%5.5%(-0.684)#644.1%(+0.682)#7,619
28.891304.7%5.5%(-0.821)#664.1%(+0.545)#8,046
29.891414.6%5.5%(-0.872)#684.1%(+0.494)#8,212
30.891314.5%5.5%(-0.984)#704.1%(+0.382)#8,621
31.891354.4%5.5%(-1.14)#734.1%(+0.225)#9,190
32.891464.3%5.5%(-1.23)#754.1%(+0.133)#9,511
33.891294.2%5.5%(-1.35)#794.1%(+0.020)#9,963
34.891394.0%5.5%(-1.55)#834.1%(-0.182)#10,827
35.891183.8%5.5%(-1.69)#864.1%(-0.321)#11,404
36.891453.8%5.5%(-1.72)#874.1%(-0.351)#11,536
37.891493.5%5.5%(-1.97)#934.1%(-0.606)#12,745
38.891833.5%5.5%(-2.03)#964.1%(-0.668)#13,067
39.891343.2%5.5%(-2.27)#1044.1%(-0.908)#14,247
40.891432.9%5.5%(-2.59)#1074.1%(-1.23)#15,887
41.891382.6%5.5%(-2.91)#1144.1%(-1.54)#17,558
42.891782.0%5.5%(-3.49)#1174.1%(-2.12)#20,491
43.891240.99%5.5%(-4.53)#1254.1%(-3.16)#24,524

Common Questions

What are the Top 10 Zip Codes with the Highest Percentage of Population Employed in Administrative & Support Services in Las Vegas, NV?
Top 10 Zip Codes with the Highest Percentage of Population Employed in Administrative & Support Services in Las Vegas, NV are:
#1
12.2%
#2
10.3%
#3
10.0%
#4
10.0%
#5
9.5%
#6
9.2%
#7
9.1%
#8
8.5%
#9
7.9%
#10
7.4%
What zip code has the Highest Percentage of Population Employed in Administrative & Support Services in Las Vegas, NV?
89101 has the Highest Percentage of Population Employed in Administrative & Support Services in Las Vegas, NV with 12.2%.
What is the Percentage of Population Employed in Administrative & Support Services in Las Vegas, NV?
Percentage of Population Employed in Administrative & Support Services in Las Vegas is 6.8%.
What is the Percentage of Population Employed in Administrative & Support Services in Nevada?
Percentage of Population Employed in Administrative & Support Services in Nevada is 5.5%.
What is the Percentage of Population Employed in Administrative & Support Services in the United States?
Percentage of Population Employed in Administrative & Support Services in the United States is 4.1%.